
Top 3 Price Prediction: Bitcoin, Ethereum, Ripple – BTC, ETH and XRP post cautious recovery amid downside risks
作者 Manish Chhetri
发布日期: 25 Feb 2026 | 修改日期: 25 Feb 2026


热门文章

Bitcoin (BTC), Ethereum (ETH), and Ripple (XRP) are posting a cautious recovery on Wednesday following a market correction earlier this week. BTC is approaching a key breakdown level, while ETH and XRP are rebounding from crucial support levels.
- Bitcoin price is nearing the previously broken lower consolidation boundary at $65,729, rejection suggests further correction ahead.
- Ethereum price rises 4% after finding support around the $1,800 level the previous day.
- XRP recovers slightly after retesting its weekly support at $1.30, though broader downside pressure remains intact.
Bitcoin (BTC), Ethereum (ETH), and Ripple (XRP) are posting a cautious recovery on Wednesday following a market correction earlier this week. BTC is approaching a key breakdown level, while ETH and XRP are rebounding from crucial support levels. Despite the short-term bounce in the top three cryptocurrencies, traders should be cautious as technical indicators suggest downside risks remain intact.
Bitcoin tests breakdown zone
Bitcoin price broke and closed below the lower consolidation boundary at $65,729 on Monday and declined slightly, hitting a daily low of $62,510 the next day. As of writing on Wednesday, BTC is testing this breakdown zone.
If BTC fails to close above the $65,729 breakdown level on a daily basis, it could extend the decline toward the key support level at $60,000.
The Relative Strength Index (RSI) reads 36, rebounding from the oversold territory, indicating fading bearish momentum. The Moving Average Convergence Divergence (MACD) showed a bullish crossover that remains intact, suggesting a positive outlook.
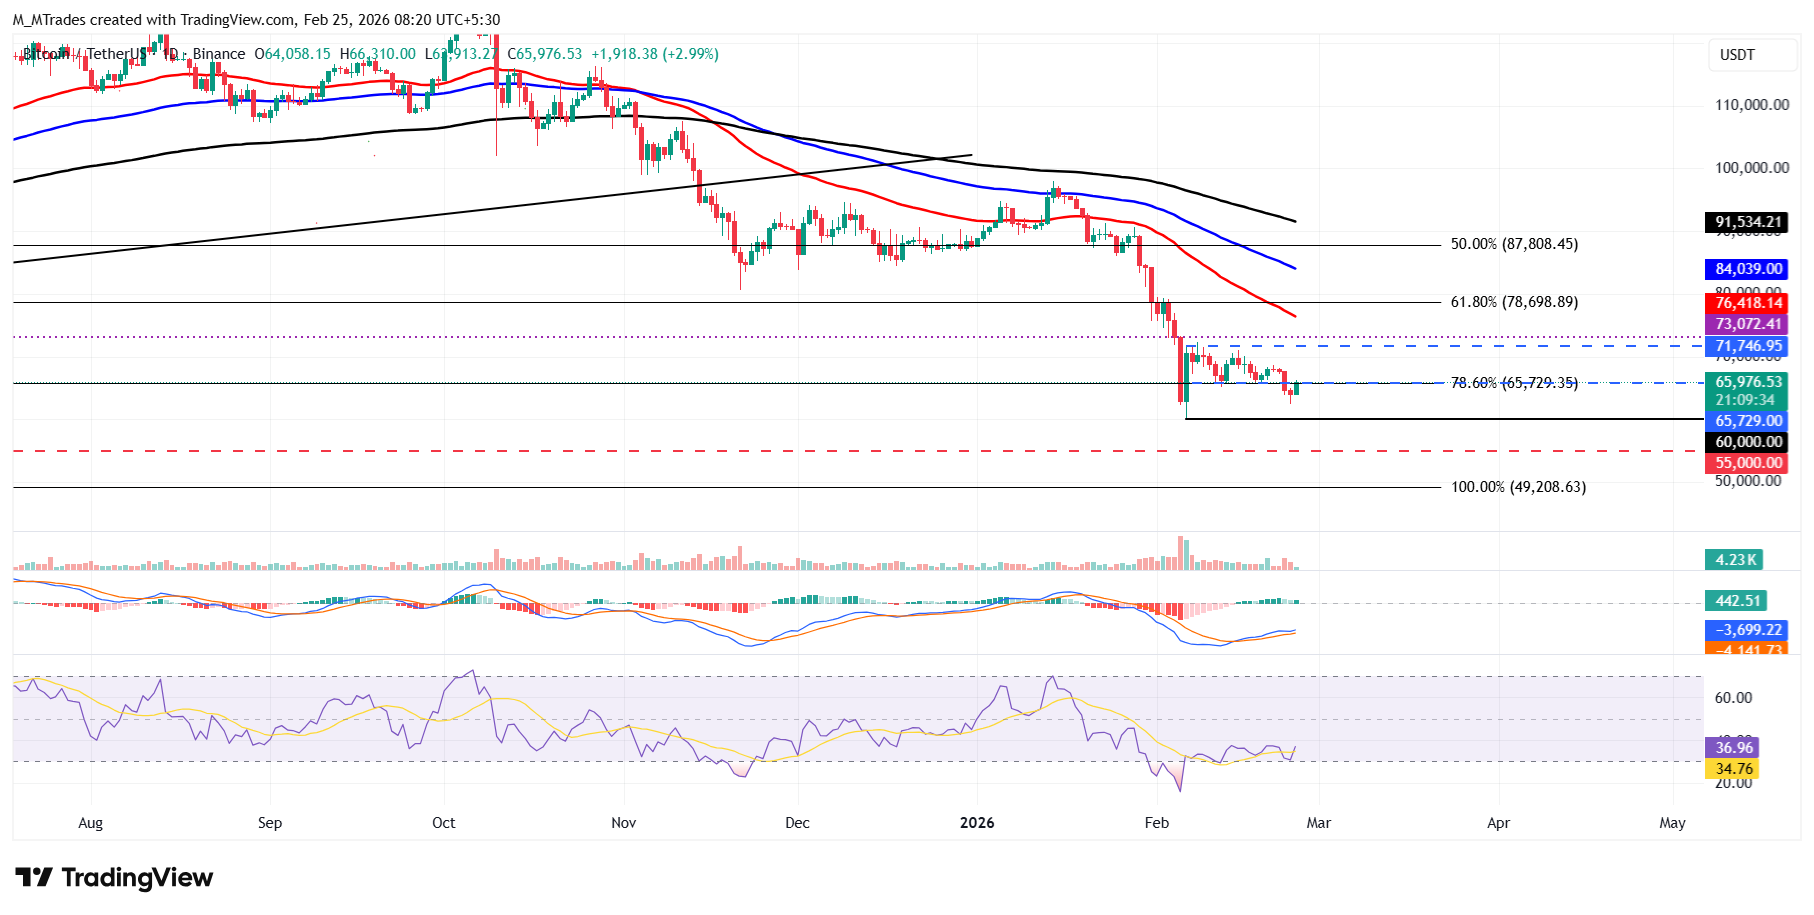
If BTC continues its recovery and closes above $65,729 on a daily basis, it could extend the advance toward the upper boundary of the mentioned consolidation range at $71,746.
Ethereum finds support around $1,800
Ethereum price corrected slightly during the previous week, extending its loss since mid-January. ETH continued its correction, falling 5.5% to test the key psychological level at $1,800 on Tuesday. As of writing on Wednesday, ETH is trading at $1,916.
If ETH continues its downward trend and closes below $1,800, it could extend the decline toward the lower consolidation range at $1,747. A firm close below this level could extend further losses toward the daily support at $1,669.
Like Bitcoin, Ethereum’s momentum indicators show mixed signals: the RSI indicates fading bearish momentum, while the MACD is showing a bullish crossover.
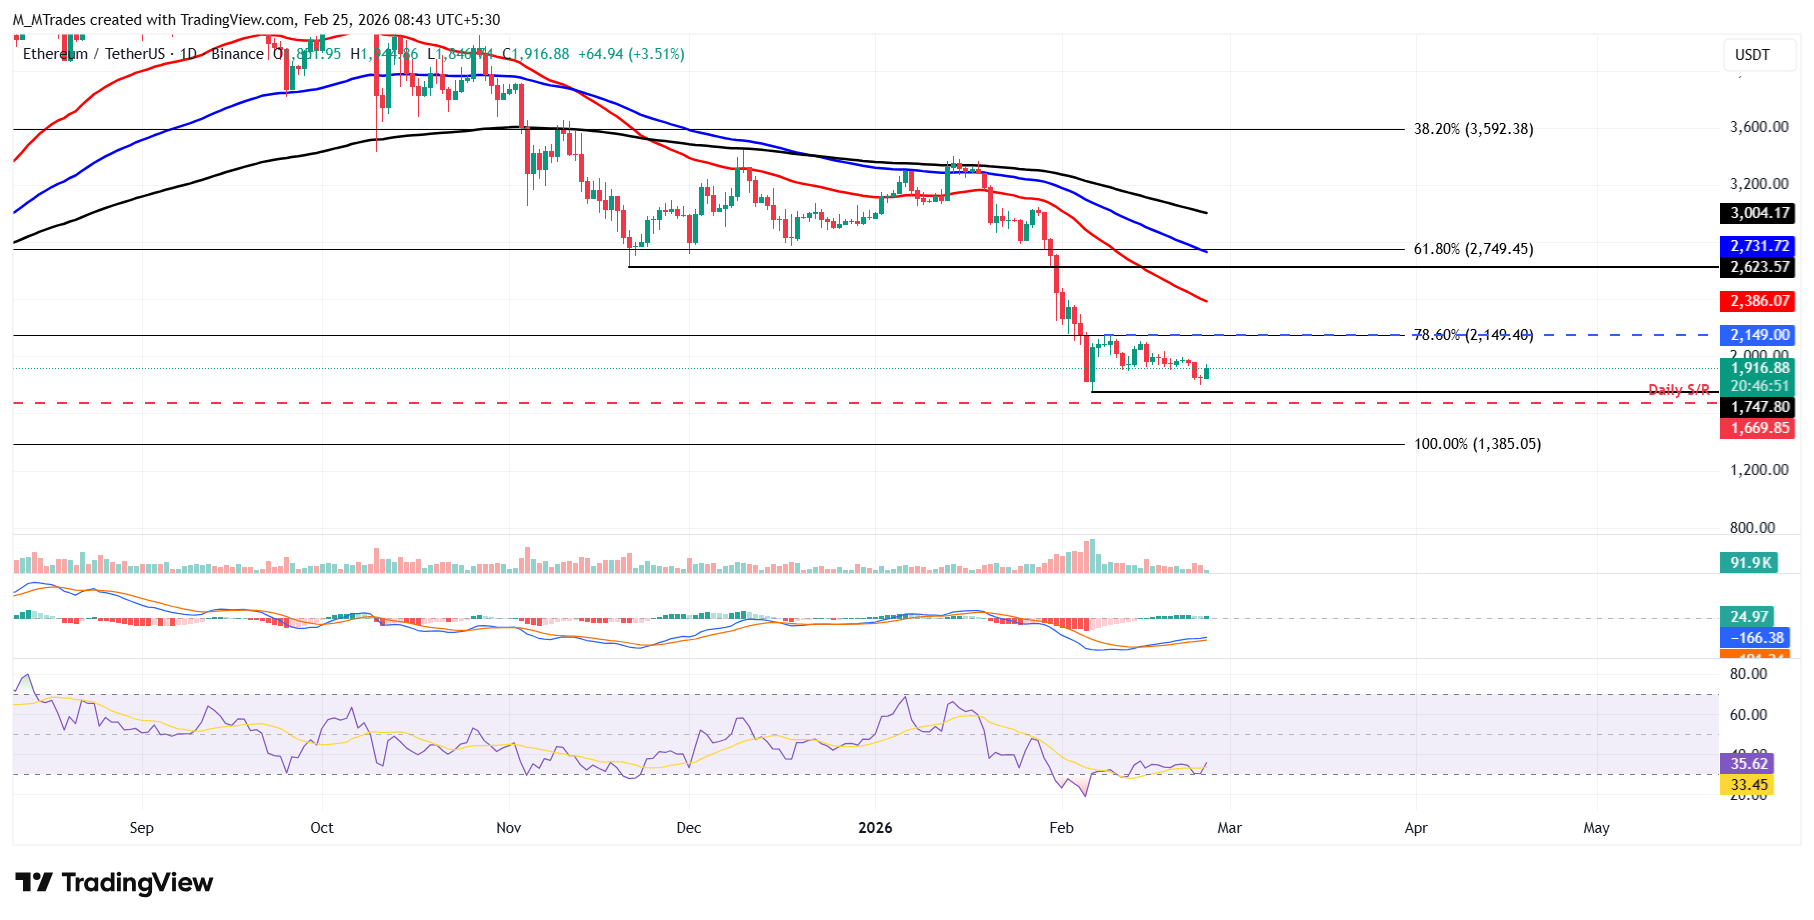
However, if ETH recovers, it could extend the advance toward the upper consolidation range at $2,149.
XRP revisits its lower trendline boundary
XRP price closed below the lower trendline boundary of a falling wedge on Monday and declined slightly, nearing the weekly support at $1.30 the next day. As of Wednesday, XRP is recovering slightly, revisiting this broken trendline.
If XRP fails to find support around the trendline and corrects, it could extend the decline toward the weekly support at $1.30. A close below this level could extend the losses toward the February 6 low of $1.11.
Like Bitcoin and Ethereum, XRP’s momentum indicators also show mixed signals: the RSI indicates fading bearish momentum, while the MACD is showing a bullish crossover.
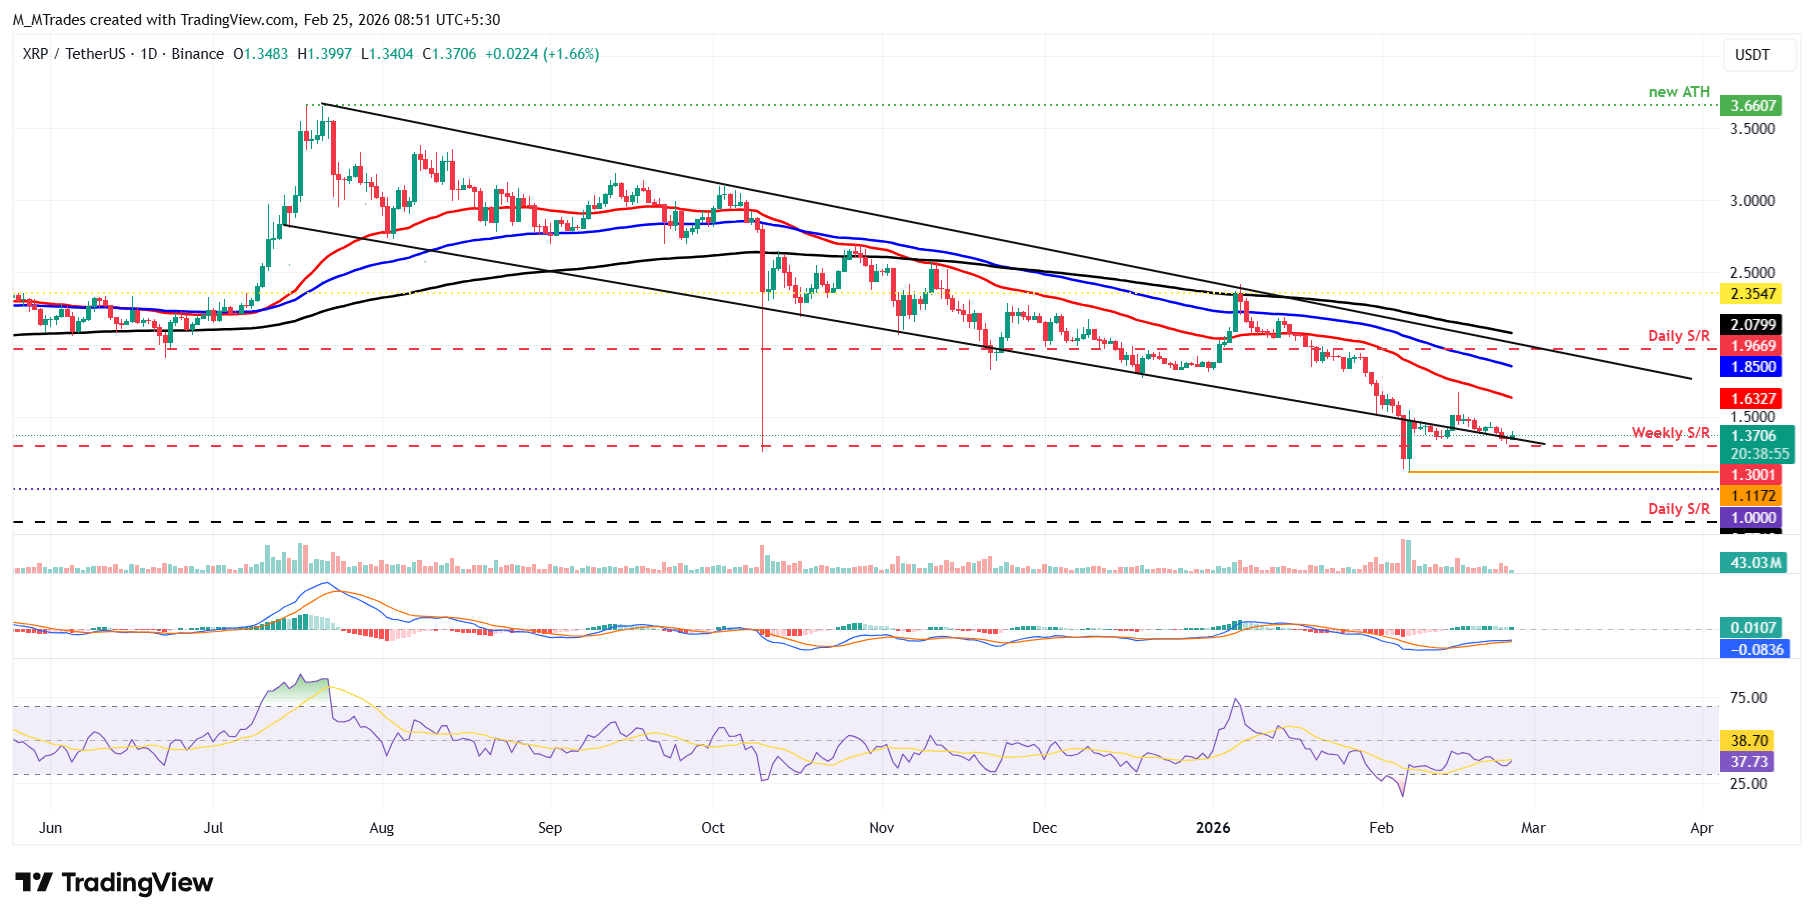
Conversely, if the lower trendline boundary holds as support, it could extend the recovery toward the key psychological level at $1.50.
Cryptocurrency metrics FAQs
The developer or creator of each cryptocurrency decides on the total number of tokens that can be minted or issued. Only a certain number of these assets can be minted by mining, staking or other mechanisms. This is defined by the algorithm of the underlying blockchain technology. On the other hand, circulating supply can also be decreased via actions such as burning tokens, or mistakenly sending assets to addresses of other incompatible blockchains.
Market capitalization is the result of multiplying the circulating supply of a certain asset by the asset’s current market value.
Trading volume refers to the total number of tokens for a specific asset that has been transacted or exchanged between buyers and sellers within set trading hours, for example, 24 hours. It is used to gauge market sentiment, this metric combines all volumes on centralized exchanges and decentralized exchanges. Increasing trading volume often denotes the demand for a certain asset as more people are buying and selling the cryptocurrency.
Funding rates are a concept designed to encourage traders to take positions and ensure perpetual contract prices match spot markets. It defines a mechanism by exchanges to ensure that future prices and index prices periodic payments regularly converge. When the funding rate is positive, the price of the perpetual contract is higher than the mark price. This means traders who are bullish and have opened long positions pay traders who are in short positions. On the other hand, a negative funding rate means perpetual prices are below the mark price, and hence traders with short positions pay traders who have opened long positions.

Acuity Trading 是一家成立于 2013 年、总部位于伦敦的金融科技公司,专注于 AI 驱动的另类数据和情绪分析,用于交易与投资。他们以可视化新闻和情绪工具革新在线交易体验,如今持续以最新的 AI 研究与技术提供可产生阿尔法的另类数据与高度互动的交易工具。
阅读更多


