
Top 3 Price Prediction: Bitcoin, Ethereum, Ripple – BTC, ETH and XRP under pressure as key supports face breakdown risk
作者 Manish Chhetri
发布日期: 2 Mar 2026 | 修改日期: 2 Mar 2026


热门文章

Bitcoin (BTC), Ethereum (ETH), and Ripple (XRP) prices trade on the back foot at the start of this week on Monday, after extending losses in the previous week. BTC is on the brink of a breakdown, ETH is capped below key resistance, and XRP risks a crack of the trendline.
- Bitcoin price hovers around the lower consolidation range at $65,729, a firm close below suggests a deeper correction ahead.
- Ethereum steadies around $1,950 after being rejected by the upper consolidation boundary the previous week.
- XRP finds support around the lower trendline, a breakdown below this structure would likely trigger a corrective move.
Bitcoin (BTC), Ethereum (ETH), and Ripple (XRP) prices trade on the back foot at the start of this week on Monday, after extending losses in the previous week. BTC is on the brink of a breakdown, ETH is capped below key resistance, and XRP risks a crack of the trendline. Meanwhile, the broader market sentiment remains risk-off, as the escalating military aggression in the Middle East over the weekend continues to weigh on the crypto market.
Bitcoin could extend its correction if it closes below key support
Bitcoin price has been finding support around the lower consolidation range at $65,729 since Friday, with the price hovering there. As of writing on Monday, BTC is trading at $66,000, nearing this support level.
If BTC breaks and closes below the lower consolidation range at $65,729, it could extend the decline toward Tuesday’s low at $62,510. A close below this level could extend losses toward the key support at $60,000.
The Relative Strength Index (RSI) on the daily chart is 39, below the neutral 50 level, indicating bearish momentum gaining traction. However, the Moving Average Convergence Divergence (MACD) showed a bullish crossover on February 15 that remains intact, suggesting a positive outlook.
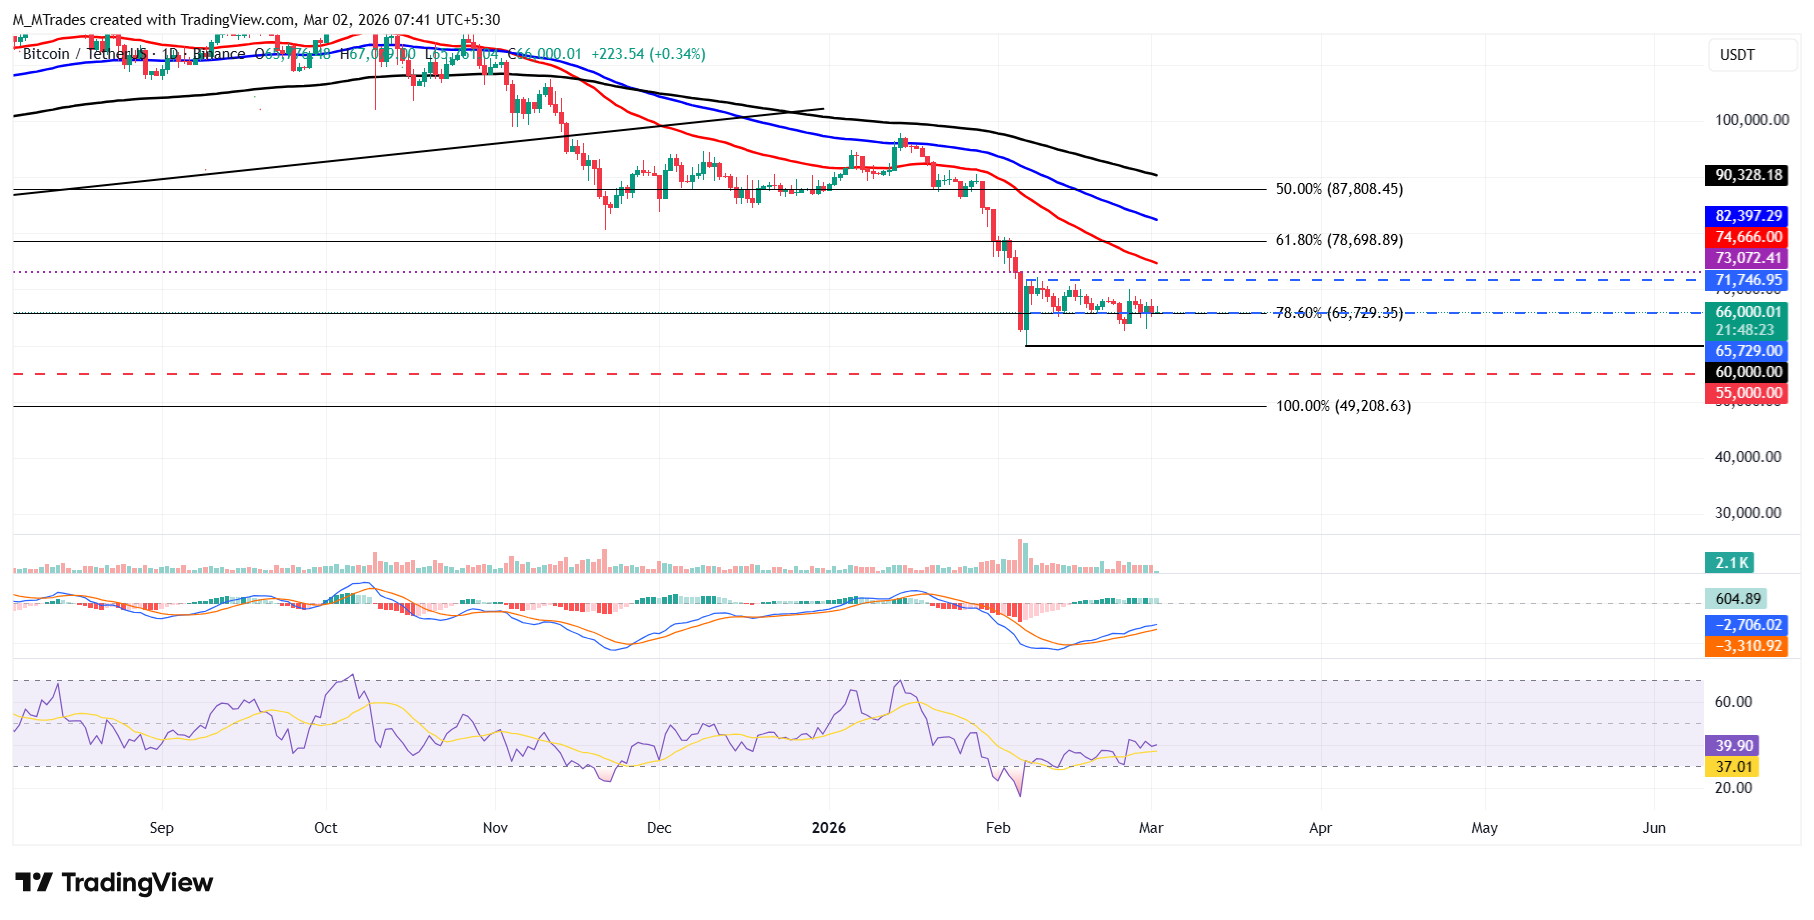
If the lower consolidation range at $65,729 continues to hold and BTC recovers, the first significant resistance area emerges at the upper boundary of the consolidation range at $71,746.
Ethereum faces rejection from the upper consolidation range
Ethereum price faced rejection near the upper consolidation boundary at $2,149 and declined slightly last week. As of Monday, it hovers at $1,940.
If ETH continues to correct, it could extend the decline toward the lower consolidation range at $1,747.
Like Bitcoin, ETH’s momentum indicators show mixed signals: the RSI points to bearish pressure, while the MACD suggests a potential recovery could be brewing.
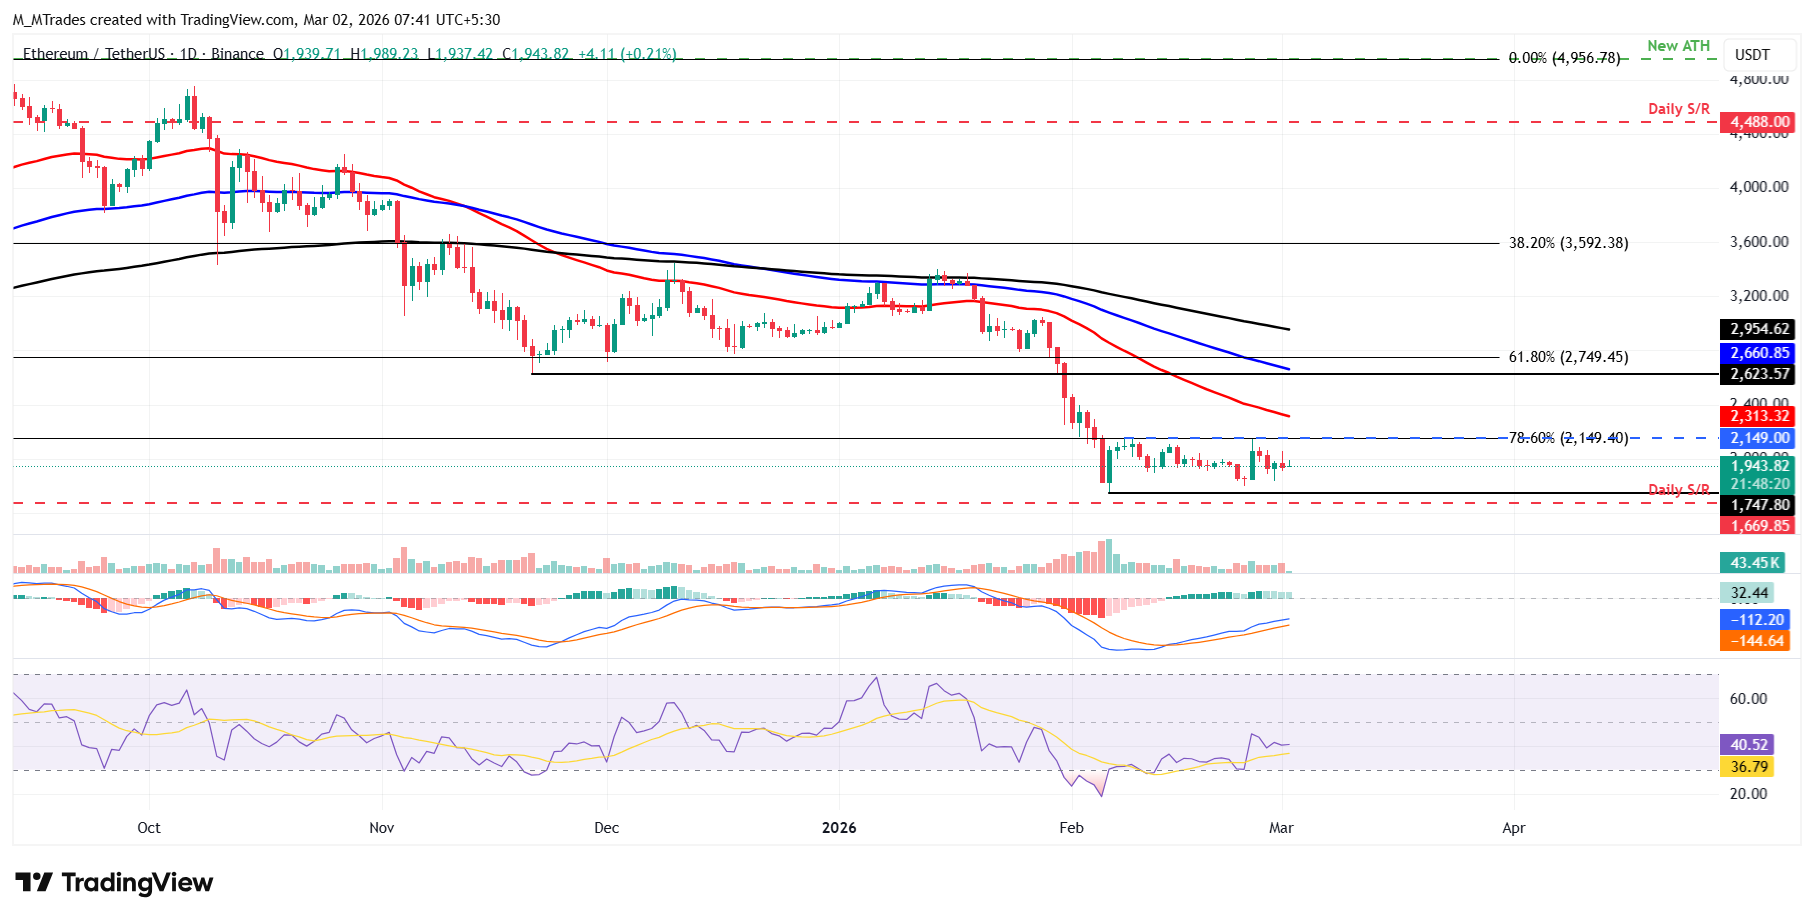
On the other hand, if ETH recovers, it could extend the advance toward the upper consolidation range at $2,149.
XRP risks trendline crack
XRP price has been finding support around the lower trendline boundary of a falling wedge since last week. This trendline roughly coincides with the weekly support level at $1.30, making it a key support zone. As of writing on Monday, XRP continues to find support around this level.
If XRP fails to find support around the trendline and corrects, it could extend the decline toward the weekly support at $1.30. A close below this level could extend the losses toward the February 6 low of $1.11.
Like Bitcoin and Ethereum, XRP’s momentum indicators also show mixed signals, indicating indecision among traders as the price hovers near a key support zone.
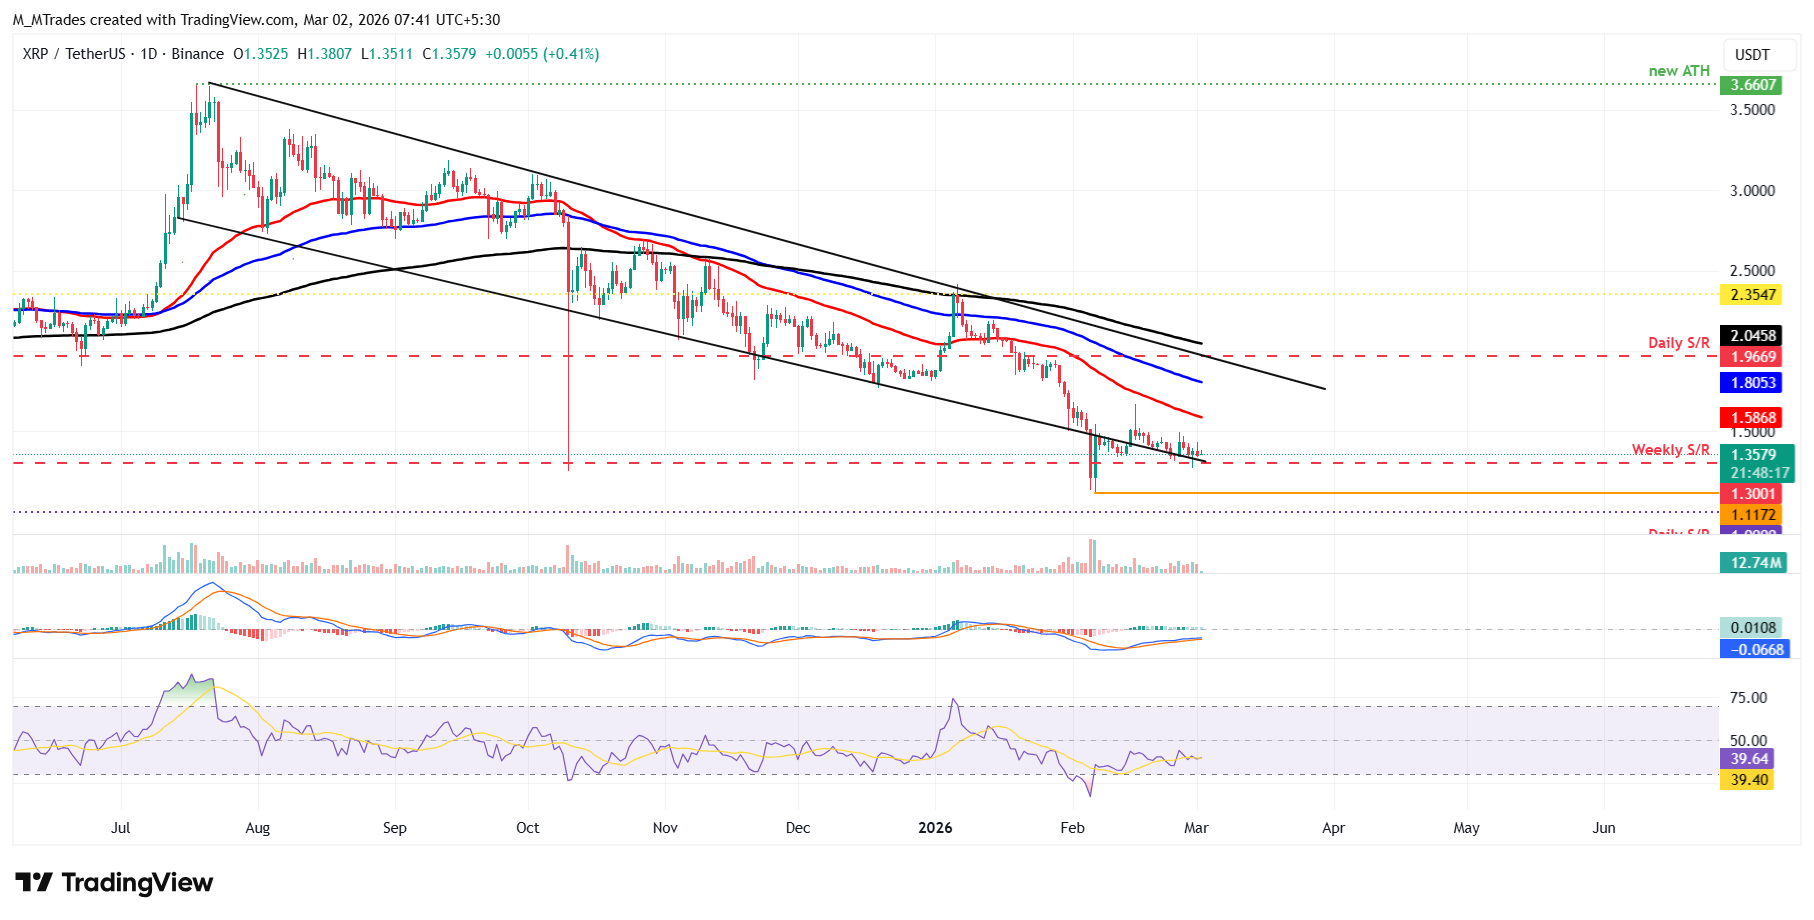
However, if the lower trendline boundary holds as support, it could extend the recovery toward the key psychological $1.50 level.
Cryptocurrency metrics FAQs
The developer or creator of each cryptocurrency decides on the total number of tokens that can be minted or issued. Only a certain number of these assets can be minted by mining, staking or other mechanisms. This is defined by the algorithm of the underlying blockchain technology. On the other hand, circulating supply can also be decreased via actions such as burning tokens, or mistakenly sending assets to addresses of other incompatible blockchains.
Market capitalization is the result of multiplying the circulating supply of a certain asset by the asset’s current market value.
Trading volume refers to the total number of tokens for a specific asset that has been transacted or exchanged between buyers and sellers within set trading hours, for example, 24 hours. It is used to gauge market sentiment, this metric combines all volumes on centralized exchanges and decentralized exchanges. Increasing trading volume often denotes the demand for a certain asset as more people are buying and selling the cryptocurrency.
Funding rates are a concept designed to encourage traders to take positions and ensure perpetual contract prices match spot markets. It defines a mechanism by exchanges to ensure that future prices and index prices periodic payments regularly converge. When the funding rate is positive, the price of the perpetual contract is higher than the mark price. This means traders who are bullish and have opened long positions pay traders who are in short positions. On the other hand, a negative funding rate means perpetual prices are below the mark price, and hence traders with short positions pay traders who have opened long positions.

Acuity Trading 是一家成立于 2013 年、总部位于伦敦的金融科技公司,专注于 AI 驱动的另类数据和情绪分析,用于交易与投资。他们以可视化新闻和情绪工具革新在线交易体验,如今持续以最新的 AI 研究与技术提供可产生阿尔法的另类数据与高度互动的交易工具。
阅读更多


