
USD/CAD Price Forecast: Remains below 1.4050, near nine-day EMA barrier
作者 Akhtar Faruqui
发布日期: 28 Nov 2025 | 修改日期: 28 Nov 2025


热门文章

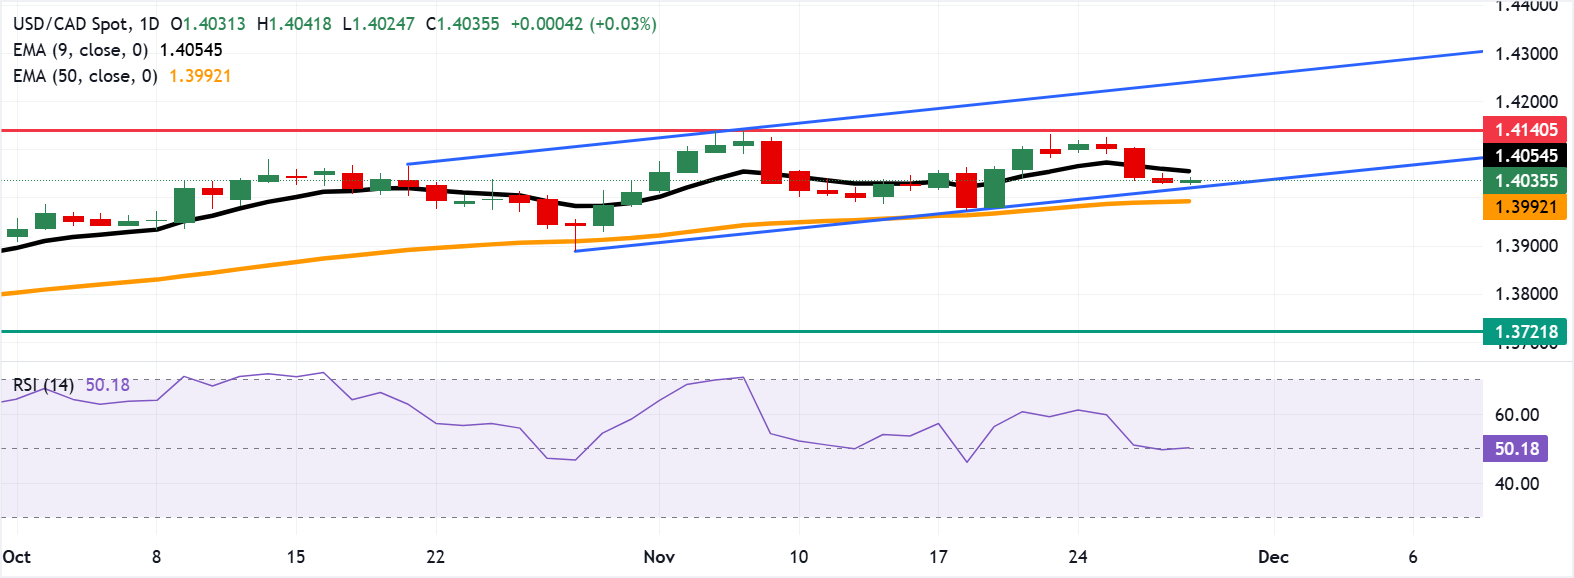
USD/CAD holds ground after three days of losses, trading around 1.4040 during the early European hours on Friday. The daily chart’s technical setup reflects an ongoing bullish bias, with the pair remaining within its ascending channel pattern.
- USD/CAD may find a primary barrier at the nine-day EMA of 1.4055.
- The 14-day Relative Strength Index near 50 signals balanced momentum, favoring potential breakouts over range-bound moves.
- The initial support lies around the ascending channel’s lower boundary at 1.4020.
USD/CAD holds ground after three days of losses, trading around 1.4040 during the early European hours on Friday. The daily chart’s technical setup reflects an ongoing bullish bias, with the pair remaining within its ascending channel pattern.
The USD/CAD pair holds above the rising 50-day Exponential Moving Average (EMA) at 1.3992. A dip below the nine-day EMA at 1.4055 flags cooling short-term momentum. Trend conditions remain mildly bullish with the 50-day EMA ascending, yet the flattening nine-EMA caps follow-through. Price’s stance between the two averages points to consolidation until a decisive break.
The 14-day Relative Strength Index (RSI) at 50 (neutral) after retreating from overbought readings confirms subdued directional conviction. RSI around 50 keeps momentum balanced, leaving cues to breakouts rather than oscillations.
The USD/CAD pair could face immediate resistance at the nine-day EMA near 1.4055. A break above this level would strengthen short-term momentum and pave the way for a retest of the seven-month high at 1.4140 from November 5. A sustained move beyond that level could open the door toward the upper boundary of the ascending channel around 1.4240.
On the downside, the immediate support is seen at the ascending channel’s lower boundary near 1.4020, followed by the psychological 1.4000 level and the 50-day EMA at 1.3992. A break below this confluence of supports would dent the bullish bias and pressure USD/CAD toward the four-month low near 1.3721.
(The technical analysis of this story was written with the help of an AI tool.)
Canadian Dollar Price Today
The table below shows the percentage change of Canadian Dollar (CAD) against listed major currencies today. Canadian Dollar was the weakest against the US Dollar.
| USD | EUR | GBP | JPY | CAD | AUD | NZD | CHF | |
|---|---|---|---|---|---|---|---|---|
| USD | 0.09% | 0.15% | 0.05% | 0.04% | 0.05% | 0.12% | 0.05% | |
| EUR | -0.09% | 0.07% | -0.05% | -0.05% | -0.04% | 0.04% | -0.03% | |
| GBP | -0.15% | -0.07% | -0.10% | -0.11% | -0.14% | -0.03% | -0.10% | |
| JPY | -0.05% | 0.05% | 0.10% | 0.01% | 0.00% | 0.07% | 0.01% | |
| CAD | -0.04% | 0.05% | 0.11% | -0.01% | -0.00% | 0.06% | -0.00% | |
| AUD | -0.05% | 0.04% | 0.14% | -0.01% | 0.00% | 0.07% | -0.02% | |
| NZD | -0.12% | -0.04% | 0.03% | -0.07% | -0.06% | -0.07% | -0.07% | |
| CHF | -0.05% | 0.03% | 0.10% | -0.01% | 0.00% | 0.02% | 0.07% |
The heat map shows percentage changes of major currencies against each other. The base currency is picked from the left column, while the quote currency is picked from the top row. For example, if you pick the Canadian Dollar from the left column and move along the horizontal line to the US Dollar, the percentage change displayed in the box will represent CAD (base)/USD (quote).

Acuity Trading 是一家成立于 2013 年、总部位于伦敦的金融科技公司,专注于 AI 驱动的另类数据和情绪分析,用于交易与投资。他们以可视化新闻和情绪工具革新在线交易体验,如今持续以最新的 AI 研究与技术提供可产生阿尔法的另类数据与高度互动的交易工具。
阅读更多


