
USD/CAD Price Forecast: Slips below 1.3900 toward moving averages
作者 Akhtar Faruqui
发布日期: 16 Jan 2026 | 修改日期: 16 Jan 2026


热门文章

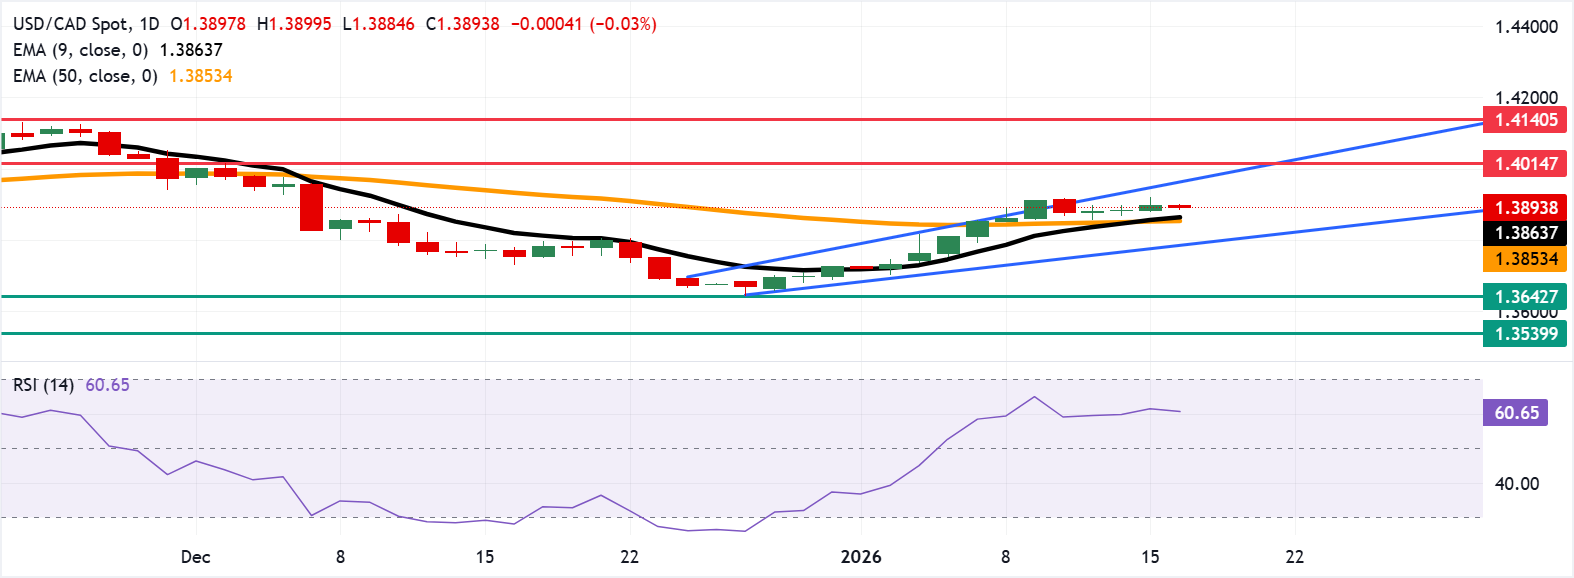
USD/CAD inches lower after three days of gains, trading around 1.3890 during the European hours on Friday. The technical analysis of the daily chart shows the pair remains within an ascending channel pattern, suggesting a persistent bullish bias.
- USD/CAD may target the initial resistance at the upper boundary of the ascending channel around 1.3970.
- The 14-day Relative Strength Index at 60 signals bullish momentum without overbought conditions.
- Initial support is seen at the nine-day EMA near 1.3864, followed by the 50-day EMA at 1.3853.
USD/CAD inches lower after three days of gains, trading around 1.3890 during the European hours on Friday. The technical analysis of the daily chart shows the pair remains within an ascending channel pattern, suggesting a persistent bullish bias. The 14-day Relative Strength Index (RSI) at 60 is bullish and not overbought. RSI above the 50 midline keeps dips shallow.
The nine-day Exponential Moving Average (EMA) has turned higher and now stands above the 50-day EMA, with price holding over both, keeping a topside bias. The 50-day EMA is flattening after a prolonged decline, indicating diminishing downside pressure.
As long as the USD/CAD pair holds above the short-term averages, the bias would remain for tests of overhead resistance at the upper boundary of the ascending channel around 1.3970, followed by the seven-week high of 1.4014, reached on December 2.
Pullbacks would find initial support at the rising nine-day EMA of 1.3864 and at the 50-day EMA at 1.3853. A drop below moving averages would slow the advance and shift risk toward the lower ascending channel boundary around 1.3790. A break below the channel would weaken the bullish bias and put downward pressure on the USD/CAD pair to test the five-month low of 1.3642, recorded on December 26.
(The technical analysis of this story was written with the help of an AI tool.)
Canadian Dollar Price Today
The table below shows the percentage change of Canadian Dollar (CAD) against listed major currencies today. Canadian Dollar was the strongest against the US Dollar.
| USD | EUR | GBP | JPY | CAD | AUD | NZD | CHF | |
|---|---|---|---|---|---|---|---|---|
| USD | -0.06% | -0.07% | -0.25% | -0.03% | -0.05% | -0.34% | -0.14% | |
| EUR | 0.06% | -0.01% | -0.20% | 0.03% | 0.00% | -0.27% | -0.08% | |
| GBP | 0.07% | 0.01% | -0.19% | 0.04% | 0.02% | -0.26% | -0.07% | |
| JPY | 0.25% | 0.20% | 0.19% | 0.25% | 0.21% | -0.08% | 0.12% | |
| CAD | 0.03% | -0.03% | -0.04% | -0.25% | -0.04% | -0.32% | -0.12% | |
| AUD | 0.05% | -0.01% | -0.02% | -0.21% | 0.04% | -0.29% | -0.09% | |
| NZD | 0.34% | 0.27% | 0.26% | 0.08% | 0.32% | 0.29% | 0.20% | |
| CHF | 0.14% | 0.08% | 0.07% | -0.12% | 0.12% | 0.09% | -0.20% |
The heat map shows percentage changes of major currencies against each other. The base currency is picked from the left column, while the quote currency is picked from the top row. For example, if you pick the Canadian Dollar from the left column and move along the horizontal line to the US Dollar, the percentage change displayed in the box will represent CAD (base)/USD (quote).

Acuity Trading 是一家成立于 2013 年、总部位于伦敦的金融科技公司,专注于 AI 驱动的另类数据和情绪分析,用于交易与投资。他们以可视化新闻和情绪工具革新在线交易体验,如今持续以最新的 AI 研究与技术提供可产生阿尔法的另类数据与高度互动的交易工具。
阅读更多


