
Trade The World
USD/CAD Price Forecast: Stays silent below 1.3800, nine-day EMA
作者 Akhtar Faruqui
发布日期: 9 Sep 2025 | 修改日期: 9 Sep 2025


POPULAR ARTICLES

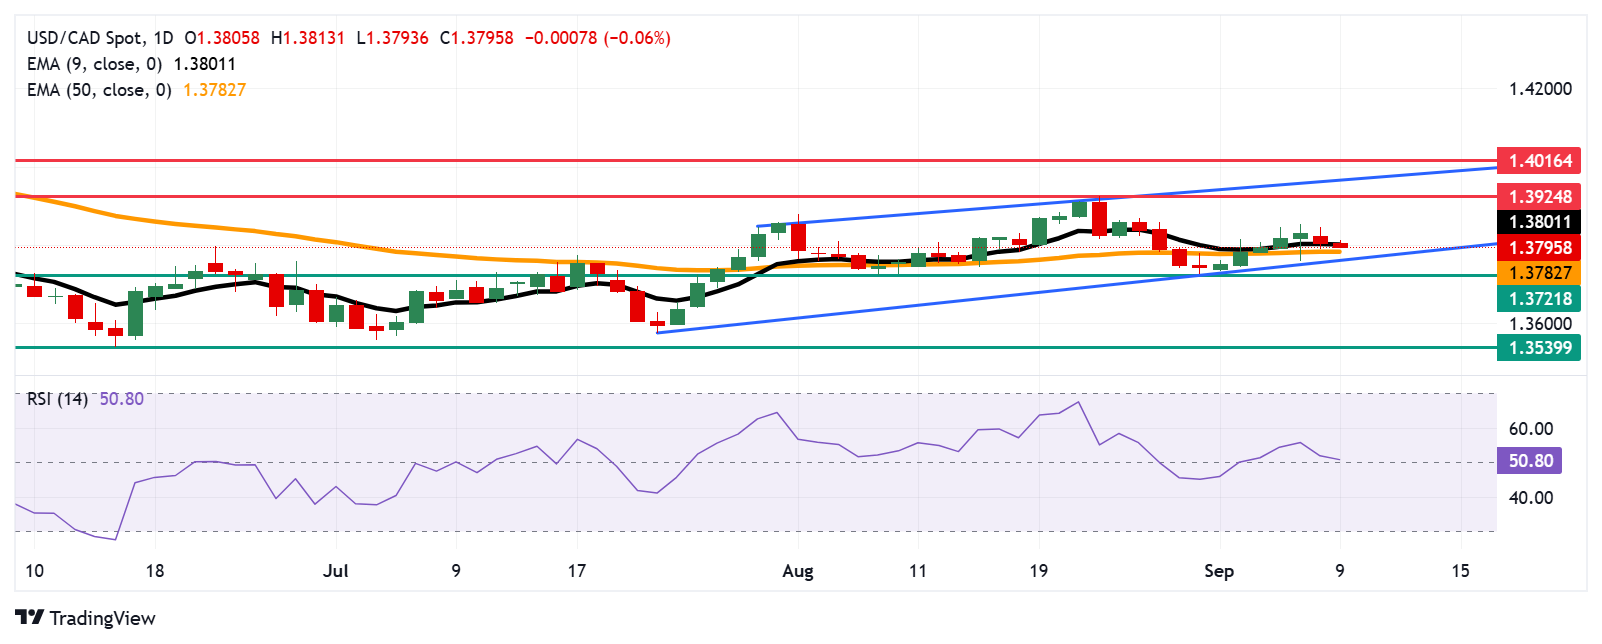
USD/CAD trades around 1.3800 during the European hours on Tuesday, extending its losses for the second consecutive day. The technical analysis of the daily chart suggests that the pair consolidates within an ascending channel pattern, indicating that market bias is bullish.
- USD/CAD is testing the immediate barrier at the nine-day EMA of 1.3801.
- The bullish bias is still active as the 14-day RSI is positioned slightly above the 50 level.
- The primary support appears at the 50-day EMA of 1.3782.
USD/CAD trades around 1.3800 during the European hours on Tuesday, extending its losses for the second consecutive day. The technical analysis of the daily chart suggests that the pair consolidates within an ascending channel pattern, indicating that market bias is bullish.
The USD/CAD pair has moved below the nine-day Exponential Moving Average (EMA), suggesting the short-term price momentum is weakening. However, the 14-day Relative Strength Index (RSI) is still positioned slightly above the 50 level, indicating that bullish bias is in play.
On the upside, the USD/CAD pair is testing the nine-day EMA at 1.3801. A break above this level would improve the short-term price momentum and lead the pair to explore the region around the four-month high at 1.3924, which was recorded on August 22, followed by the upper boundary of the ascending channel around 1.3970. Further barrier lies at the five-month high at 1.4016, reached on May 13.
The USD/CAD pair may find its initial support at the 50-day EMA of 1.3782, followed by the ascending channel’s lower boundary around 1.3760 and the two-month low of 1.3721, which was recorded on August 7. Further declines would cause the emergence of the bearish bias and put downward pressure on the pair to navigate the area around the two-month low of 1.3539.
USD/CAD: Daily Chart
Canadian Dollar Price Today
The table below shows the percentage change of Canadian Dollar (CAD) against listed major currencies today. Canadian Dollar was the strongest against the US Dollar.
| USD | EUR | GBP | JPY | CAD | AUD | NZD | CHF | |
|---|---|---|---|---|---|---|---|---|
| USD | -0.02% | -0.27% | -0.67% | -0.05% | -0.46% | -0.29% | -0.06% | |
| EUR | 0.02% | -0.25% | -0.67% | -0.03% | -0.36% | -0.24% | -0.04% | |
| GBP | 0.27% | 0.25% | -0.44% | 0.22% | -0.11% | 0.00% | 0.21% | |
| JPY | 0.67% | 0.67% | 0.44% | 0.62% | 0.27% | 0.41% | 0.62% | |
| CAD | 0.05% | 0.03% | -0.22% | -0.62% | -0.37% | -0.20% | -0.01% | |
| AUD | 0.46% | 0.36% | 0.11% | -0.27% | 0.37% | 0.13% | 0.33% | |
| NZD | 0.29% | 0.24% | -0.01% | -0.41% | 0.20% | -0.13% | 0.22% | |
| CHF | 0.06% | 0.04% | -0.21% | -0.62% | 0.00% | -0.33% | -0.22% |
The heat map shows percentage changes of major currencies against each other. The base currency is picked from the left column, while the quote currency is picked from the top row. For example, if you pick the Canadian Dollar from the left column and move along the horizontal line to the US Dollar, the percentage change displayed in the box will represent CAD (base)/USD (quote).

Acuity Trading
Acuity Trading 是一家成立于 2013 年、总部位于伦敦的金融科技公司,专注于 AI 驱动的另类数据和情绪分析,用于交易与投资。他们以可视化新闻和情绪工具革新在线交易体验,如今持续以最新的 AI 研究与技术提供可产生阿尔法的另类数据与高度互动的交易工具。
Read More


