
USD/CHF Price Forecast: Consolidates within a bearish triangle, threatens breakdown
作者 Christian Borjon Valencia
发布日期: 26 Feb 2026 | 修改日期: 26 Feb 2026


热门文章

USD/CHF extends its losses for the fourth consecutive trading day, down 0.14%, yet it remains confined to the 0.7718-0.7757 range for the last three days. At the time of writing, exchanges hands at 0.7729, above the 20-day Simple Moving Average (SMA) at 0.7726.
- USD/CHF consolidates within a symmetrical triangle, signaling potential continuation of the broader downtrend.
- Bearish RSI momentum suggests sellers could test key support near 0.7650.
- Break below 0.7600 exposes yearly low at 0.7603, while 0.7770 caps rebounds.
USD/CHF extends its losses for the fourth consecutive trading day, down 0.14%, yet it remains confined to the 0.7718-0.7757 range for the last three days. At the time of writing, exchanges hands at 0.7729, above the 20-day Simple Moving Average (SMA) at 0.7726.
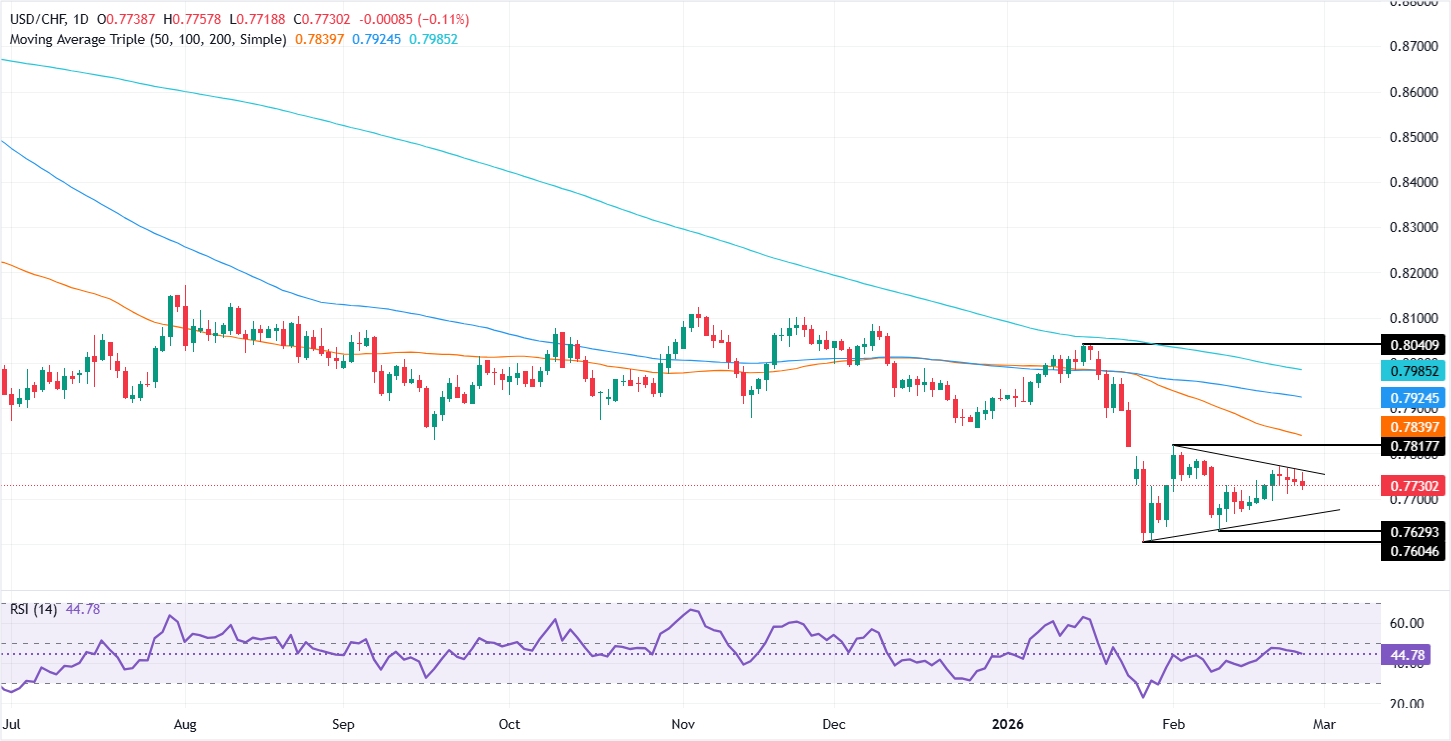
USD/CHF Price Forecast: Technical outlook
The technical picture shows USD/CHF consolidating inside a symmetrical triangle on a downtrend, which implies that the downtrend could resume once sellers push the exchange rate below the key support trendline of the triangle at around 0.7650-0.7665.
The Relative Strength Index (RSI) is bearish and aiming downwards, an indication that further losses lie ahead.
If sellers clear the support trendline, this will clear the way to challenge yearly lows of 0.7603, reached on January 27. Once surpassed, the next stop would be 0.7600, ahead of August’s 2011 low of 0.7069.
For a bullish reversal, buyers need to clear the triangle’s resistance trendline at around 0.7772, ahead of 0.7800. Further gains lie overhead at the 50-day SMA at 0.7841, before testing the 100-day SMA at 0.7911.
USD/CHF Price Chart – Daily
Swiss Franc Price This week
The table below shows the percentage change of Swiss Franc (CHF) against listed major currencies this week. Swiss Franc was the strongest against the Japanese Yen.
| USD | EUR | GBP | JPY | CAD | AUD | NZD | CHF | |
|---|---|---|---|---|---|---|---|---|
| USD | -0.05% | -0.45% | 1.02% | 0.04% | -0.53% | -0.28% | -0.21% | |
| EUR | 0.05% | -0.38% | 1.07% | 0.12% | -0.49% | -0.22% | -0.14% | |
| GBP | 0.45% | 0.38% | 1.63% | 0.51% | -0.13% | 0.17% | 0.26% | |
| JPY | -1.02% | -1.07% | -1.63% | -0.95% | -1.51% | -1.19% | -1.21% | |
| CAD | -0.04% | -0.12% | -0.51% | 0.95% | -0.58% | -0.26% | -0.24% | |
| AUD | 0.53% | 0.49% | 0.13% | 1.51% | 0.58% | 0.27% | 0.36% | |
| NZD | 0.28% | 0.22% | -0.17% | 1.19% | 0.26% | -0.27% | 0.08% | |
| CHF | 0.21% | 0.14% | -0.26% | 1.21% | 0.24% | -0.36% | -0.08% |
The heat map shows percentage changes of major currencies against each other. The base currency is picked from the left column, while the quote currency is picked from the top row. For example, if you pick the Swiss Franc from the left column and move along the horizontal line to the US Dollar, the percentage change displayed in the box will represent CHF (base)/USD (quote).
(This story was corrected on February 25 at 20:41 to say that USD/CHF extends its losses for the fourth consecutive session, not the second.)

Acuity Trading 是一家成立于 2013 年、总部位于伦敦的金融科技公司,专注于 AI 驱动的另类数据和情绪分析,用于交易与投资。他们以可视化新闻和情绪工具革新在线交易体验,如今持续以最新的 AI 研究与技术提供可产生阿尔法的另类数据与高度互动的交易工具。
阅读更多


