
Trade The World
USD/JPY Price Forecast: Rebounds above 153.00 as buyers stepped in
作者 Christian Borjon Valencia
发布日期: 8 Nov 2025 | 修改日期: 8 Nov 2025


POPULAR ARTICLES

The USD/JPY stages a recovery on Friday with buyers claiming 153.00, an indication that the uptrend might resume in the short term.
- USD/JPY rebounds, erasing prior 100-pip loss as yields stabilize and Dollar demand strengthens.
- Support sits near 20-day SMA and lower trend levels, while resistance capped near recent highs.
- RSI supports bullish continuation if price clears key resistance, signaling momentum buildup ahead.
The USD/JPY stages a recovery on Friday with buyers claiming 153.00, an indication that the uptrend might resume in the short term. The 100-pip or 0.68% Thursday’s loss was offset by traders buying the US Dollar due to its close correlation with the US 10-year Treasury note yield, which was steady during the trading day.
USD/JPY Price Forecast: Technical outlook
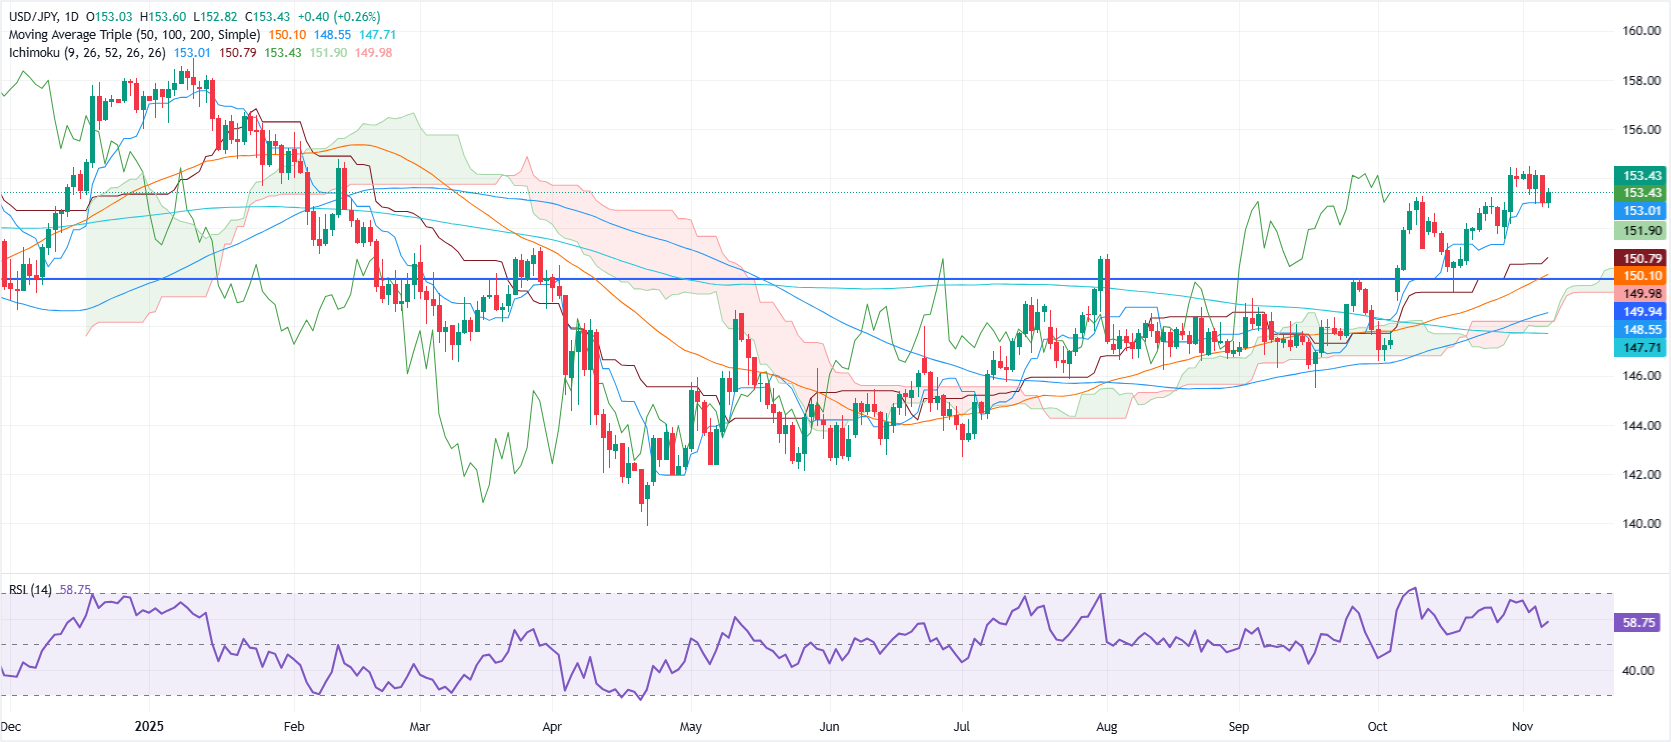
The USD/JPY technical picture shows that buyers regained momentum at around 153.00 with the next support level seen at the 20-day SMA at 152.52. Although buyers kept the exchange rate from falling to 152.80, a breach of the latter opens the door towards the 20-day SMA and on further weakness, the October 29 low lies next at 151.53.
However, buyers remain in charge as depicted by the RSI. That said, if USD/JPY rises above 154.00, the next resistance would be the November 4 peak at 154.48, followed by 155.00.
USD/JPY Price Chart – Daily
Japanese Yen Price This week
The table below shows the percentage change of Japanese Yen (JPY) against listed major currencies this week. Japanese Yen was the strongest against the New Zealand Dollar.
| USD | EUR | GBP | JPY | CAD | AUD | NZD | CHF | |
|---|---|---|---|---|---|---|---|---|
| USD | -0.29% | -0.22% | -0.41% | 0.11% | 0.76% | 1.70% | 0.05% | |
| EUR | 0.29% | 0.07% | -0.05% | 0.40% | 1.04% | 1.99% | 0.34% | |
| GBP | 0.22% | -0.07% | -0.28% | 0.33% | 0.97% | 1.92% | 0.27% | |
| JPY | 0.41% | 0.05% | 0.28% | 0.48% | 1.15% | 2.09% | 0.58% | |
| CAD | -0.11% | -0.40% | -0.33% | -0.48% | 0.59% | 1.57% | -0.06% | |
| AUD | -0.76% | -1.04% | -0.97% | -1.15% | -0.59% | 0.95% | -0.70% | |
| NZD | -1.70% | -1.99% | -1.92% | -2.09% | -1.57% | -0.95% | -1.62% | |
| CHF | -0.05% | -0.34% | -0.27% | -0.58% | 0.06% | 0.70% | 1.62% |
The heat map shows percentage changes of major currencies against each other. The base currency is picked from the left column, while the quote currency is picked from the top row. For example, if you pick the Japanese Yen from the left column and move along the horizontal line to the US Dollar, the percentage change displayed in the box will represent JPY (base)/USD (quote).

Acuity Trading
Acuity Trading 是一家成立于 2013 年、总部位于伦敦的金融科技公司,专注于 AI 驱动的另类数据和情绪分析,用于交易与投资。他们以可视化新闻和情绪工具革新在线交易体验,如今持续以最新的 AI 研究与技术提供可产生阿尔法的另类数据与高度互动的交易工具。
Read More


