
Trade The World
Aave Price Forecast: AAVE eyes bullish breakout as on-chain and derivatives data turns supportive
作者 Manish Chhetri
发布日期: 7 Jan 2026 | 修改日期: 7 Jan 2026


POPULAR ARTICLES

Aave (AAVE) price hovers around $172 on Wednesday, nearing the upper trendline of the falling parallel channel pattern. A break above this technical pattern favors the bulls.
- Aave price nears the upper trendline of the falling parallel channel on Wednesday, a breakout suggests a bullish move.
- Sideline investors looking to accumulate AAVE in the $176-$179 range after a breakout.
- On-chain and derivatives data indicate positive sentiment, with rising whale orders, buy-side dominance, and favorable funding rates.
Aave (AAVE) price hovers around $172 on Wednesday, nearing the upper trendline of the falling parallel channel pattern. A break above this technical pattern favors the bulls. Supporting this bullish setup, on-chain and derivatives metrics indicate improving market sentiment, hinting at a potential near-term breakout.
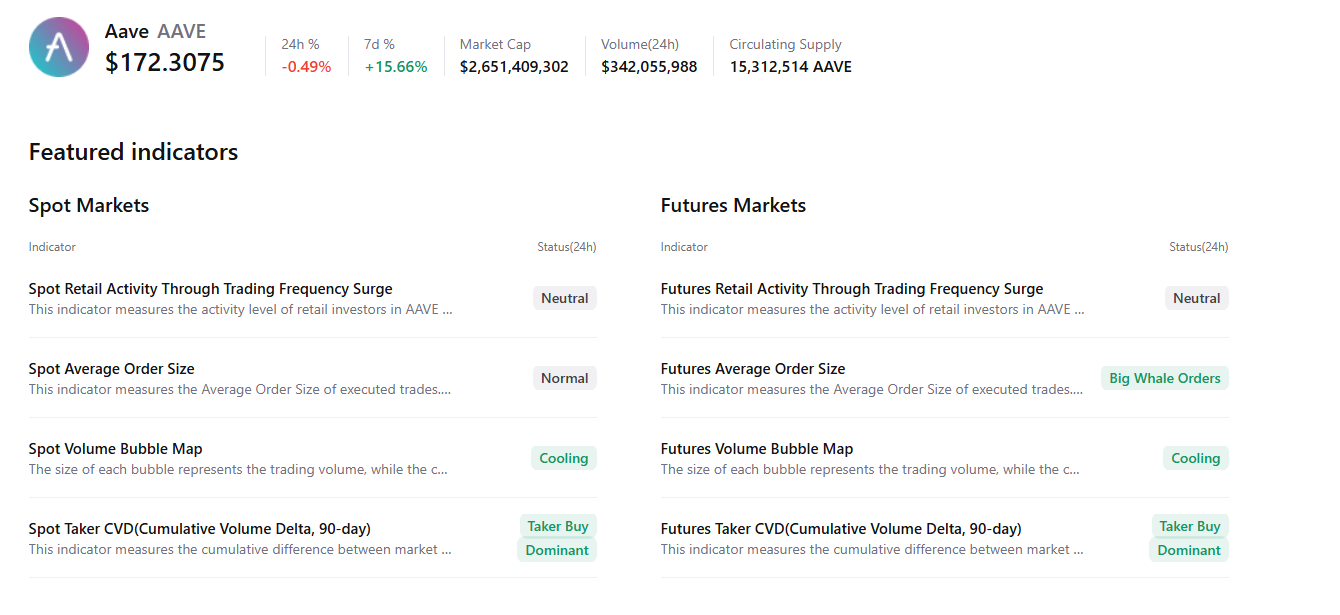
Aave’s on-chain and derivatives data build bullish sentiment
CryptoQuant’s summary data points to a positive outlook, as AAVE’s spot market data shows cooling conditions and buy-side dominance, alongside futures markets showing large whale orders. All these factors signal improving sentiment among traders, hinting at a potential breakout in the upcoming days.
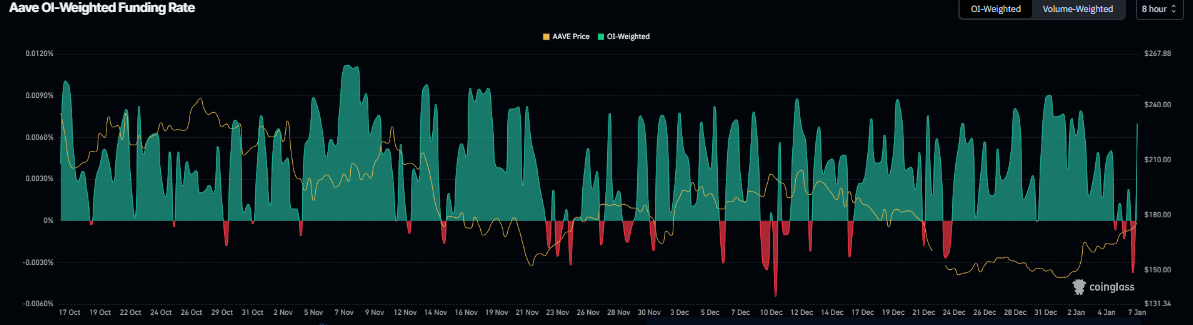
On the derivatives side, AAVE’s funding rate data also hints at a bullish bias. Coinglass’s OI-Weighted Funding Rate data shows that the number of traders betting that the price of Aave will slide further is lower than those anticipating a price increase.
The metric flipped to a positive rate on Wednesday, reading 0.0070%, indicating that longs are paying shorts. Historically, as shown in the chart below, when the funding rates have flipped from negative to positive, Aave’s price has rallied sharply.
Aave Price Forecast: Breakout of bullish pattern suggests rally ahead
Aave price trades within a falling parallel channel pattern (drawn by connecting multiple highs and lows with two trendlines since mid-August), a breakout of this pattern favors the bulls. As of Wednesday, Aave is slightly below the upper trendline of this pattern, which coincides with the 50-day Exponential Moving Average (EMA) at $176.99.
Suppose Aave breaks above this pattern and closes above the daily resistance level at $179.27, signaling a bullish move. Sideline traders looking to accumulate AAVE could do so between $176.99 (50-day EMA) and $179.27 (daily level), with a technical target at $267.68 (the distance between the channels from the breakout point) and a stop-loss at $158.27, the weekly support level.
The Relative Strength Index (RSI) on the daily chart reads 53, above the neutral level of 50, indicating bullish momentum is gaining traction. In addition, the Moving Average Convergence Divergence (MACD) indicator shows a bullish crossover and rising green histogram bars above the neutral level, further supporting the bullish outlook.
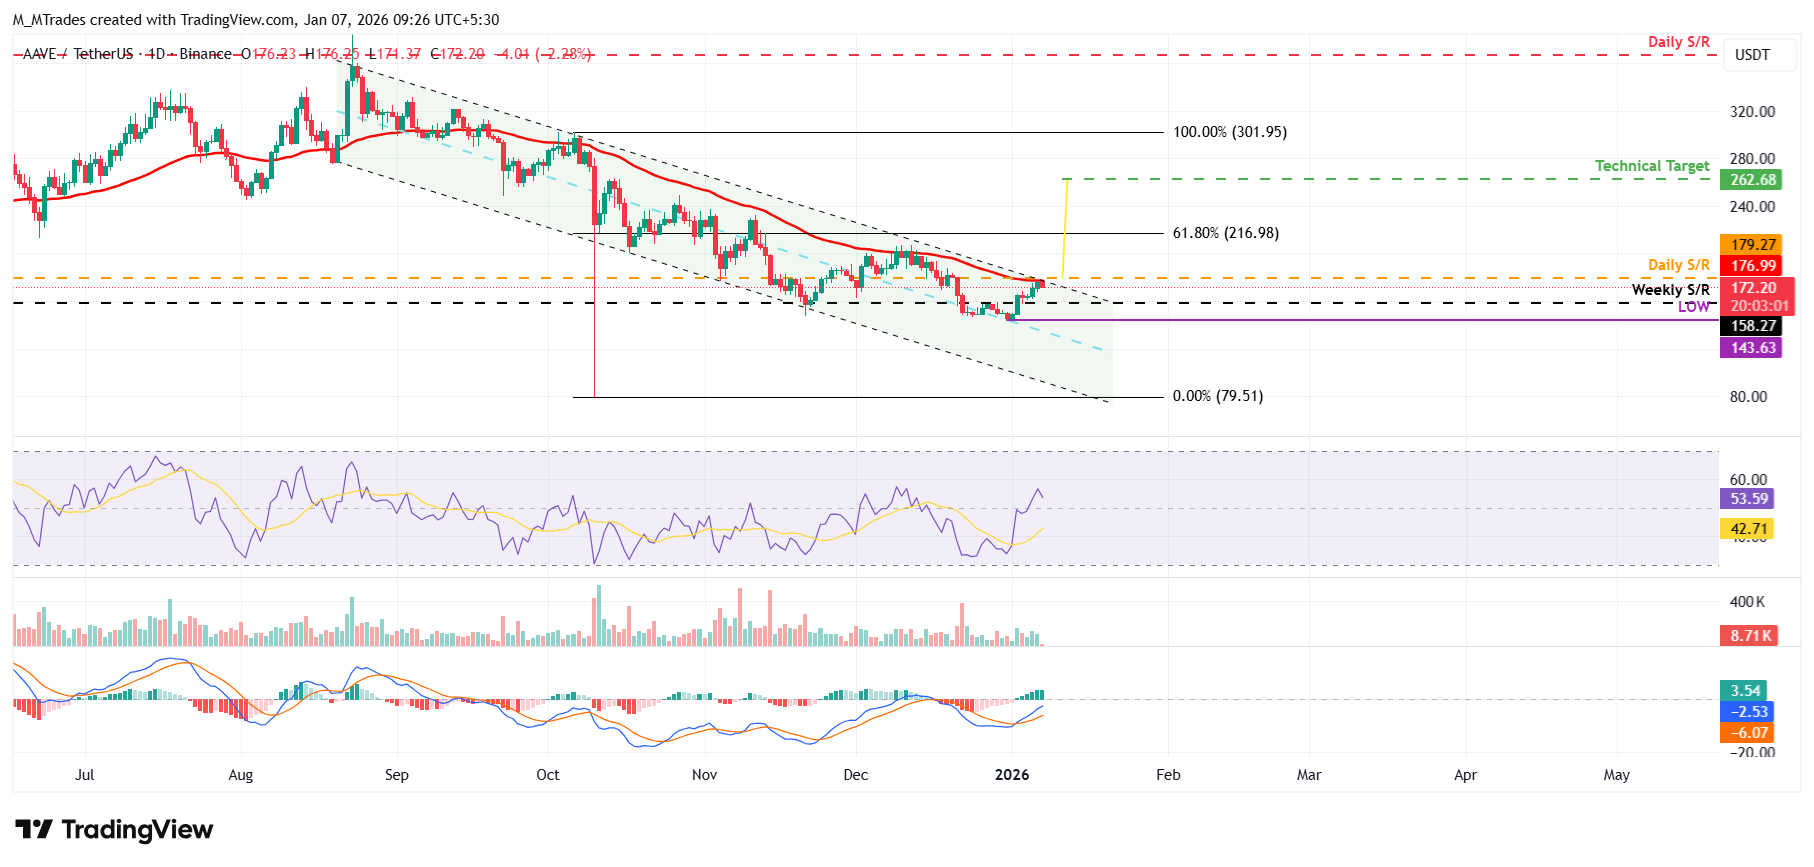
However, if AAVE fails to close above the technical pattern, it could extend the decline toward the December 31 low of $146.63, which coincides with the mid-point of the parallel channel.

FXStreet
超过一百万用户依赖 FXStreet 获取实时市场数据、图表工具、专家洞见和外汇新闻。其全面的经济日历和教育网络研讨会帮助交易者保持信息领先、做出审慎决策。FXStreet 拥有约 60 人的团队,分布在巴塞罗那总部及全球各地区。
Read More


