
Trade The World
Altcoin season stalls: PUMP, FARTCOIN, PENGU post double-digit losses as bullish momentum fades
作者 Vishal Dixit
发布日期: 25 Jul 2025 | 修改日期: 25 Jul 2025


POPULAR ARTICLES

Altcoin season stalls as Bitcoin (BTC) drops below $118,000, catalyzing a broader cryptocurrency market pullback. Pump.fun (PUMP), Fartcoin (FARTCOIN), and Pudgy Penguins (PENGU) lead the decline with double-digit losses over the last 24 hours, risking further losses as bullish momentum wanes.
- Altcoin Pump.fun edges lower for the fifth consecutive day, accounting for nearly a 40% drop so far this week.
- Fartcoin fails to uphold momentum above a critical resistance, erasing this week’s gains.
- Pudgy Penguins tick lower by 1% extending the 12% drop from Thursday.
Altcoin season stalls as Bitcoin (BTC) drops below $118,000, catalyzing a broader cryptocurrency market pullback. Pump.fun (PUMP), Fartcoin (FARTCOIN), and Pudgy Penguins (PENGU) lead the decline with double-digit losses over the last 24 hours, risking further losses as bullish momentum wanes.
PUMP extends the bearish trend, eyes further decline
PUMP edges lower by 5% at press time on Friday, extending a clear downtrend in the 4-hour price chart. The meme coin launchpad token dropped under the $0.003000 round figure on Thursday, suggesting increased selling pressure.
PUMP’s bearish turnaround from $0.006882 inches closer to the S1 pivot level at $0.002366. A decisive close below this level could extend the decline to $0.002084 level.
The Relative Strength Index (RSI) reads 25 on the 4-hour chart, indicating increased selling pressure resulting in oversold conditions. Sidelined investors must remain cautious, as oversold conditions could signal a potential bounce back.

PUMP/USDT daily price chart.
To reinforce an uptrend, PUMP must surpass the $0.003000 level, which could drive the uptrend to the R2 pivot level at $0.003542.
FARTCOIN’s bullish failure risks testing the $1.00 mark
Fartcoin has appreciated by over 1% so far on Friday, following the 21% decline in the last two days. The meme coin failed to hold an uptrend above the 78.6% Fibonacci level at $1.56, retracing from $2.74 on January 19 to $0.19 on March 10.
Fartcoin inches closer to the 50-day Exponential Moving Average (EMA) at $1.24. A clean push below the dynamic support could test the 61.8% Fibonacci level at $1.00.
The RSI reads 50 on the daily chart, indicating a neutral phase, while the drop from the overbought boundary to the midline suggests a significant decrease in buying pressure.
The Moving Average Convergence Divergence (MACD) crosses below its signal line, indicating a trend reversal. A surge in red histogram bars would indicate an increase in selling pressure.
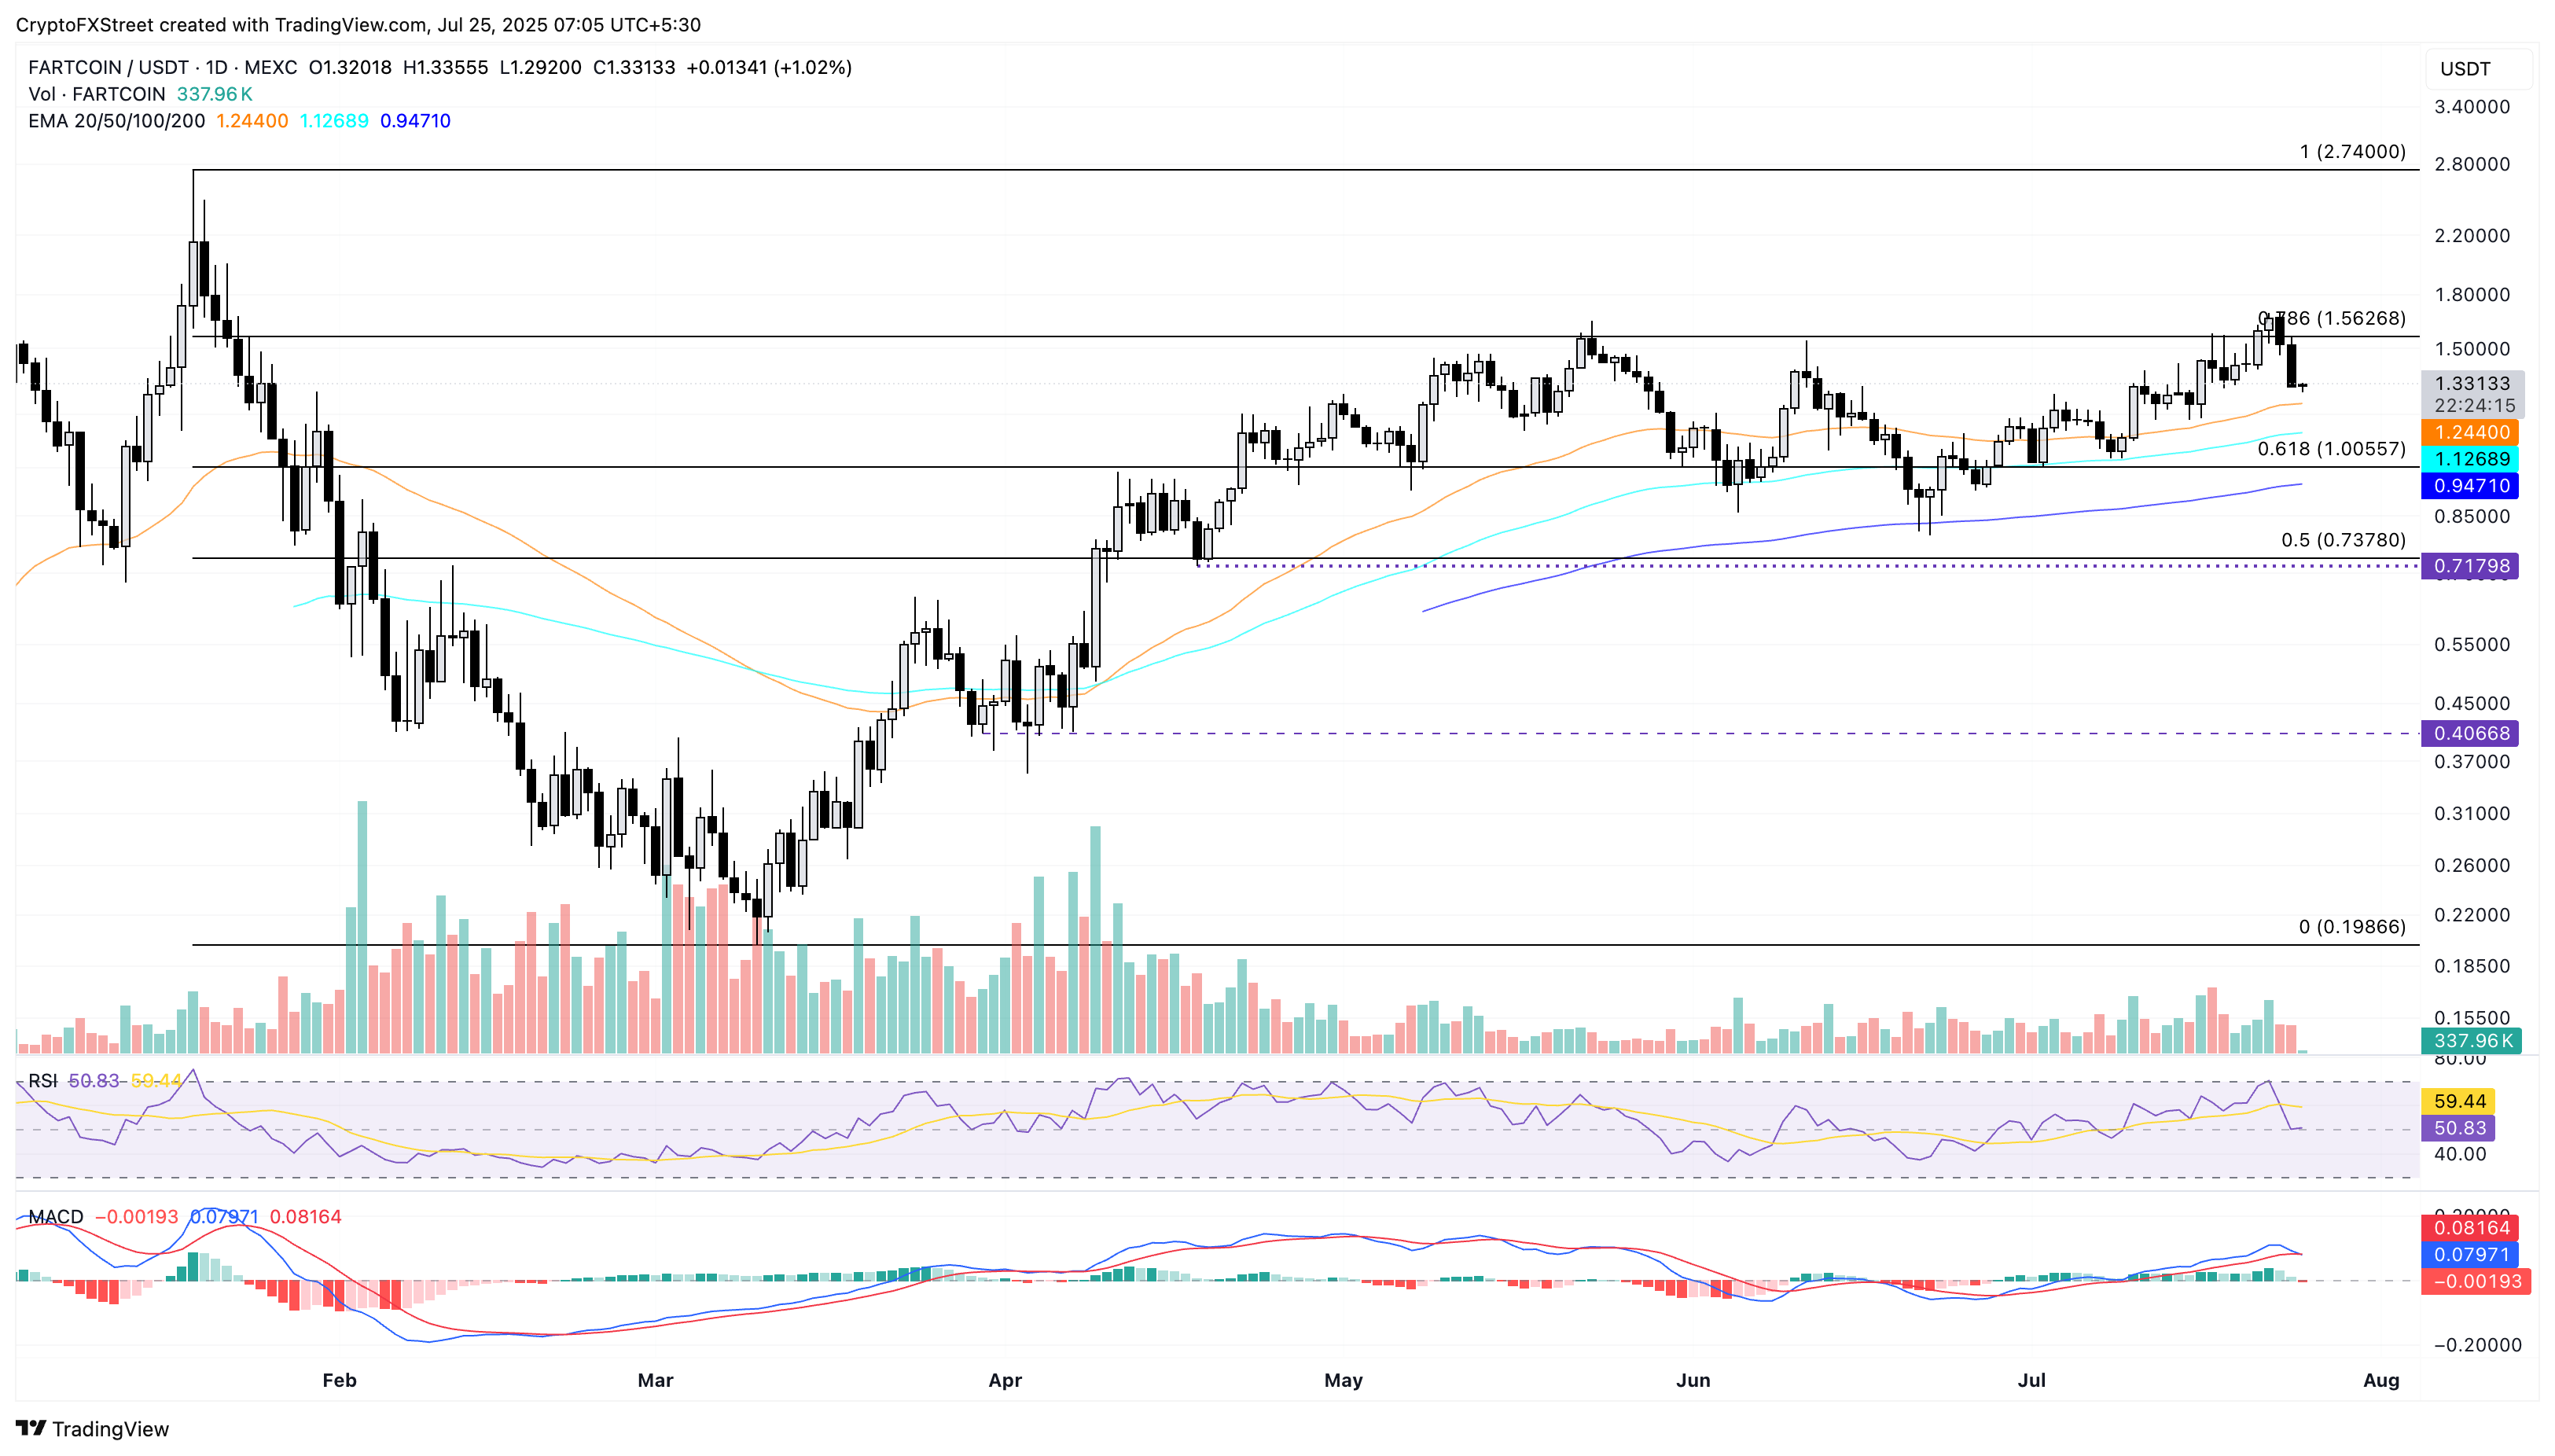
FARTCOIN/USDT daily price chart.
If the broader market recovers, the meme coin could retest the $1.56 resistance level.
PENGU risks further losses as bullish momentum fades
PENGU edges lower by 1% at the time of writing on Friday, following the 12% drop on Thursday that completed an evening star pattern. The sudden reversal in PENGU is slipping under the 78.6% Fibonacci level at $0.03731, drawn from $0.070000 on December 17 to $0.00370 on April 9.
A decisive close below this level could result in further losses for PENGU, potentially testing the 61.8% Fibonacci level at $0.02277.
The technical indicators signal a sudden shift in momentum as the RSI declines to 68 on the daily chart, from the overbought zone, indicating decreased buying pressure. Meanwhile, the MACD indicator displays declining bullish momentum, as the green histogram bars lose intensity.
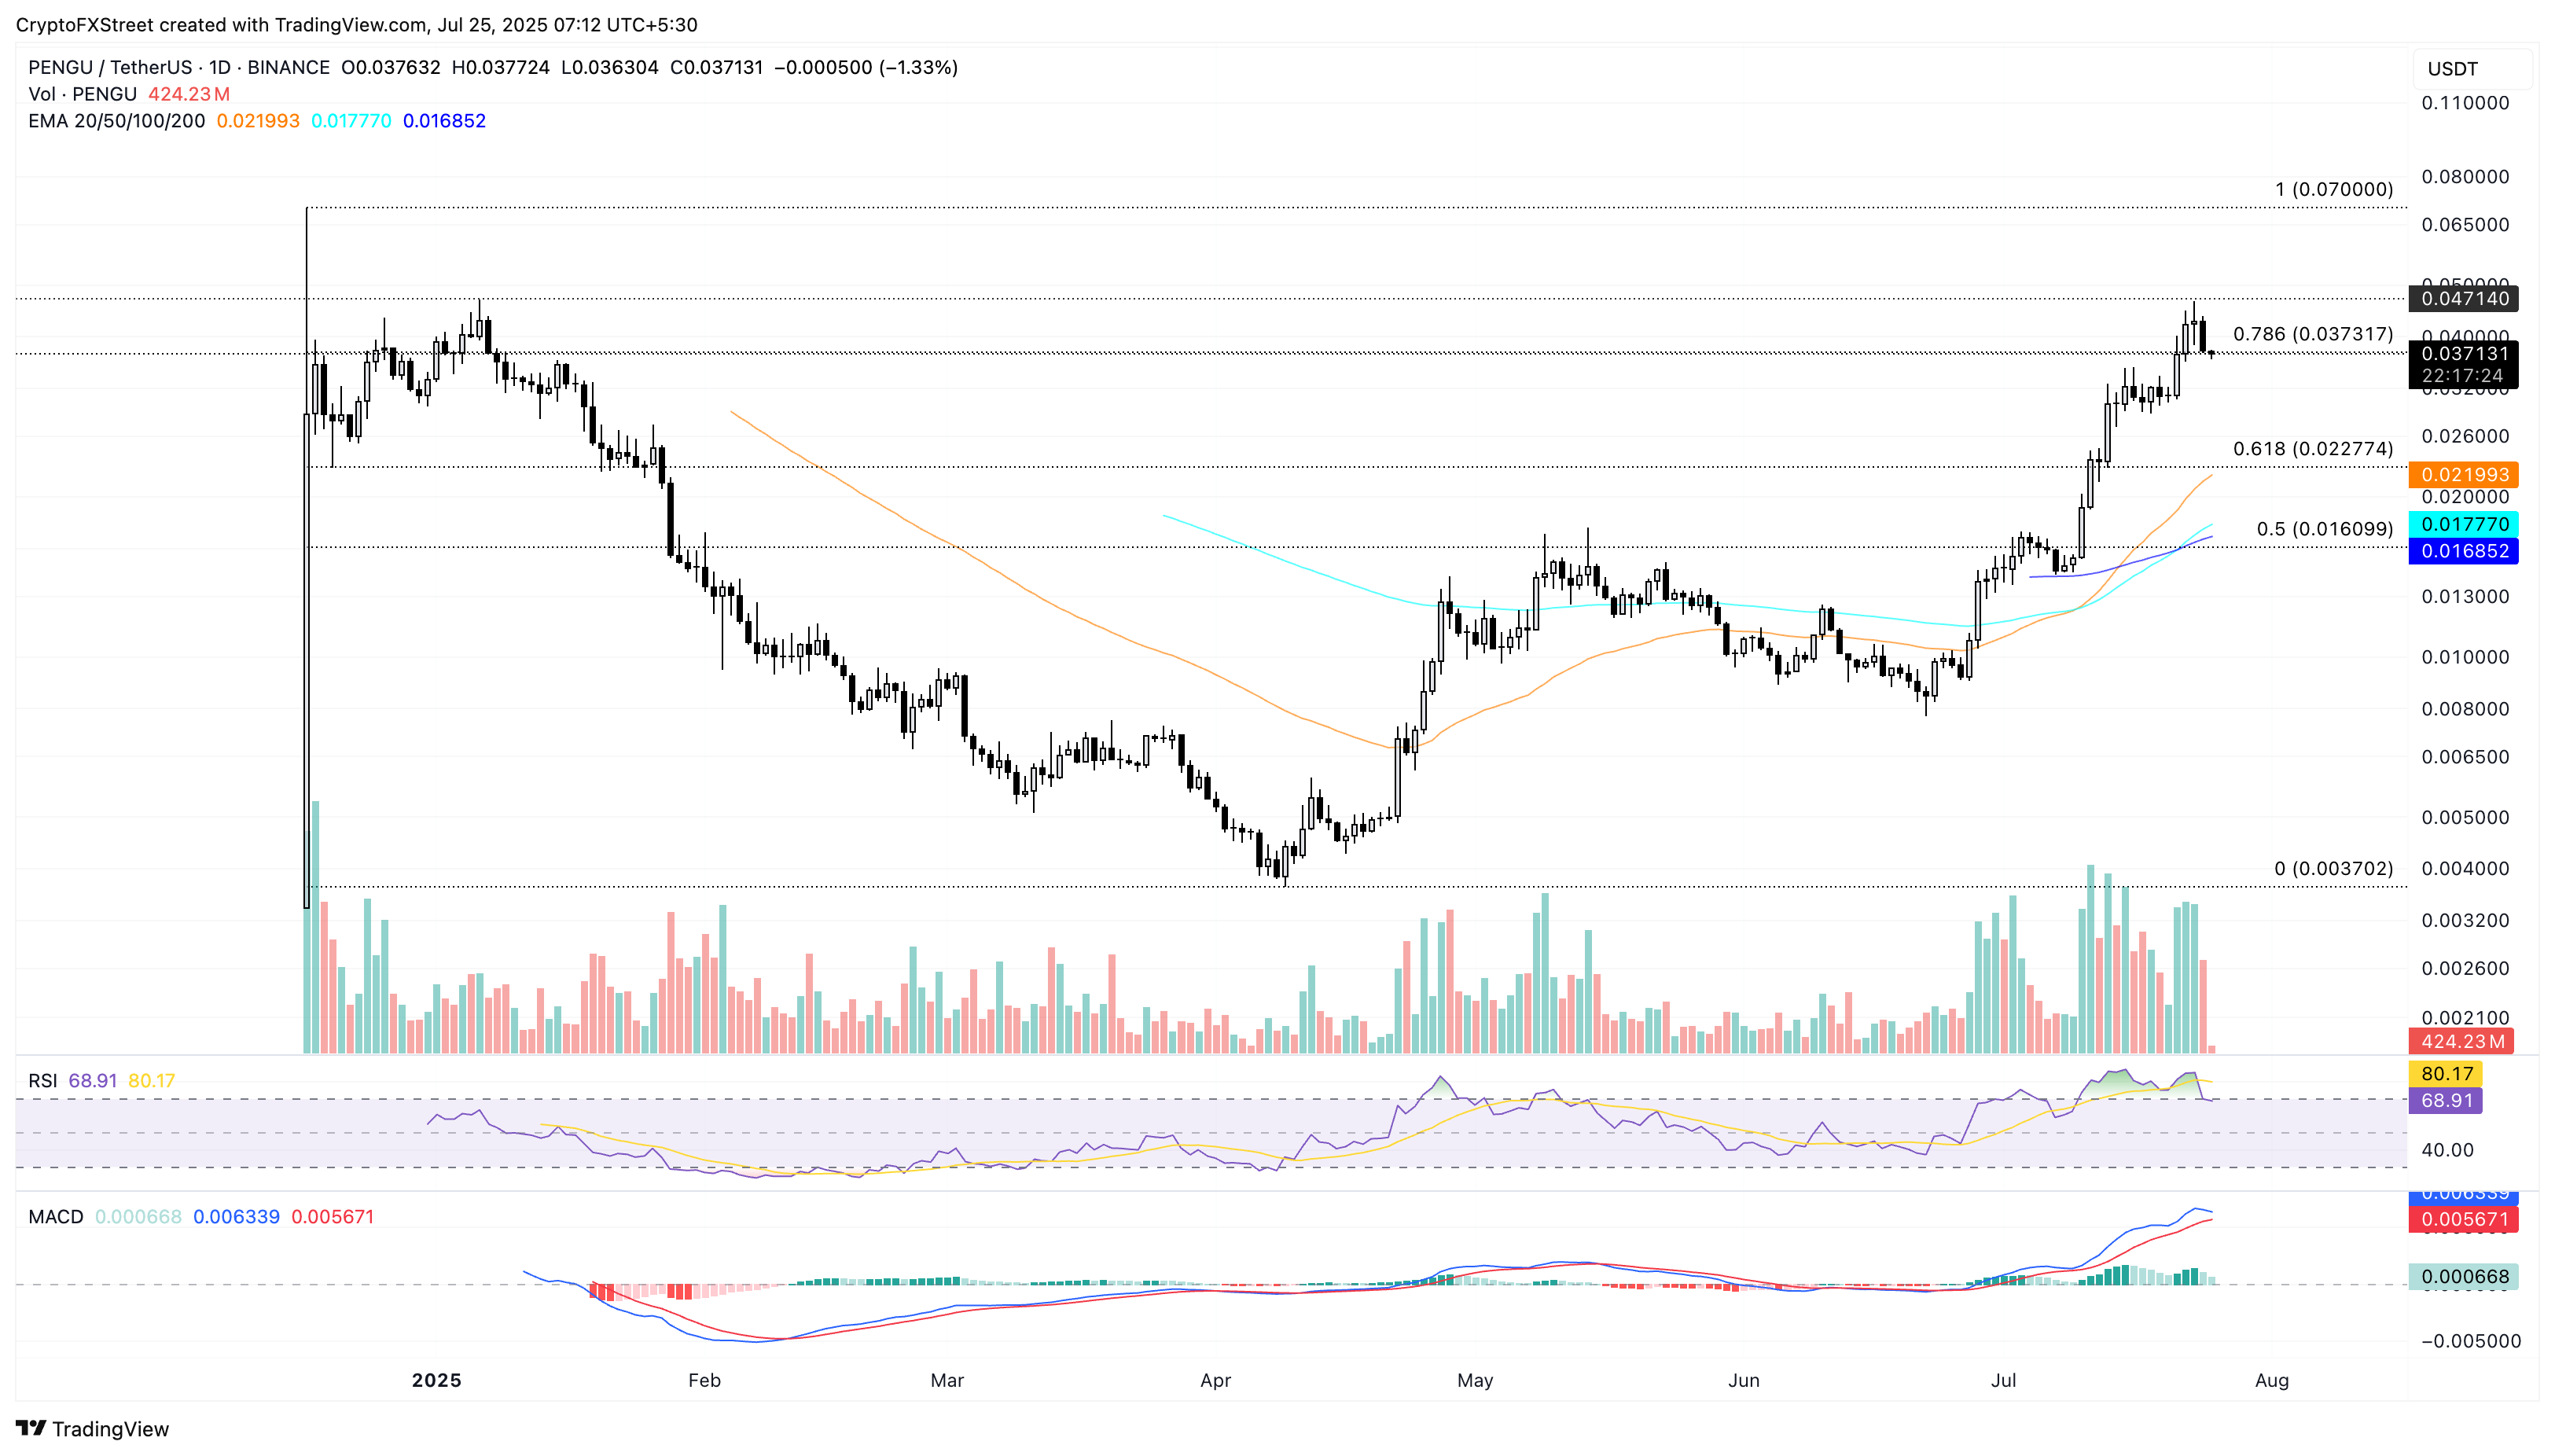
PENGU/USDT daily price chart.
A bounce back from the $0.03731 could test the weekly high of $0.04660.

FXStreet
超过一百万用户依赖 FXStreet 获取实时市场数据、图表工具、专家洞见和外汇新闻。其全面的经济日历和教育网络研讨会帮助交易者保持信息领先、做出审慎决策。FXStreet 拥有约 60 人的团队,分布在巴塞罗那总部及全球各地区。
Read More


