
$1,500: Why Ethereum just crashed 20% despite spot markets barely selling
作者 Michael Ebiekutan
更新: 10 Jun 2026


热门文章

Ethereum (ETH) recently suffered one of its sharpest declines of 2026, dropping more than 20% and briefly testing the $1,500 area. While the sell-off appeared to reflect broader market fears, derivatives and on-chain data suggest a more complex story may be unfolding beneath the surface.
Ethereum (ETH) recently suffered one of its sharpest declines of 2026, dropping more than 20% and briefly testing the $1,500 area. While the sell-off appeared to reflect broader market fears, derivatives and on-chain data suggest a more complex story may be unfolding beneath the surface.
Long liquidations spark ETH's decline amid a cool spot market
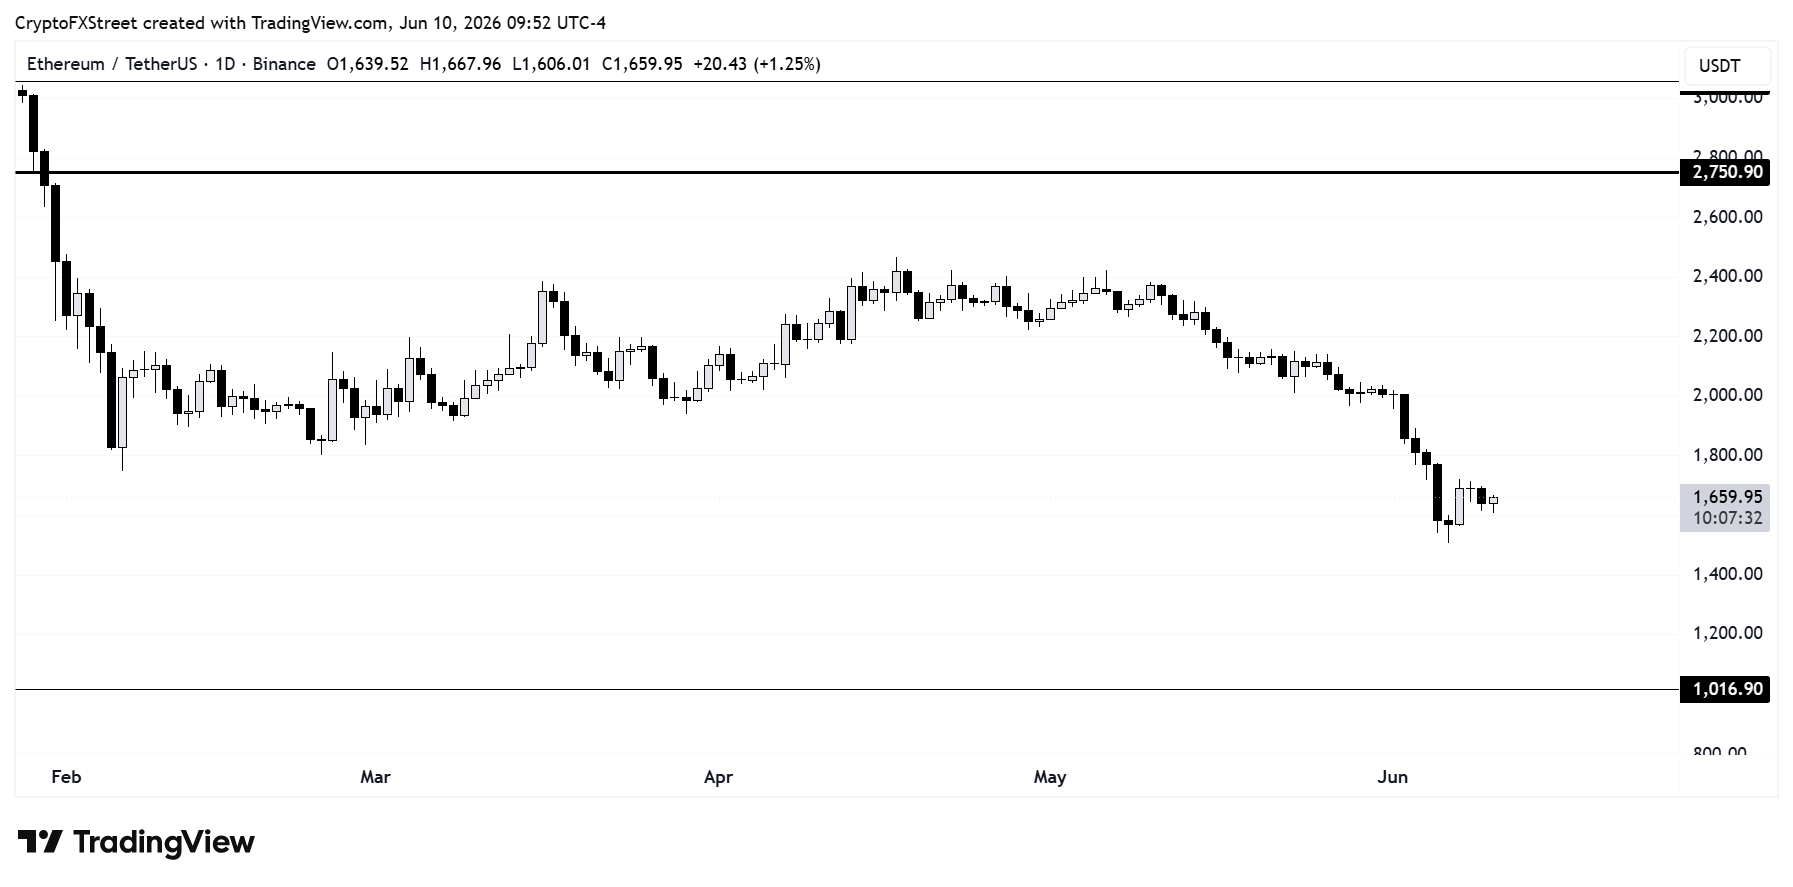
ETH experienced one of its largest declines in 2026 last week, dropping more than 20% from above $2,000 to roughly $1,550, continuing a downtrend dating back to the second week of May.
While the recent sell-off was triggered by renewed Middle East geopolitical tensions and rising rate-hike expectations, the absence of intense selling in spot markets hints that derivatives accelerated the decline.
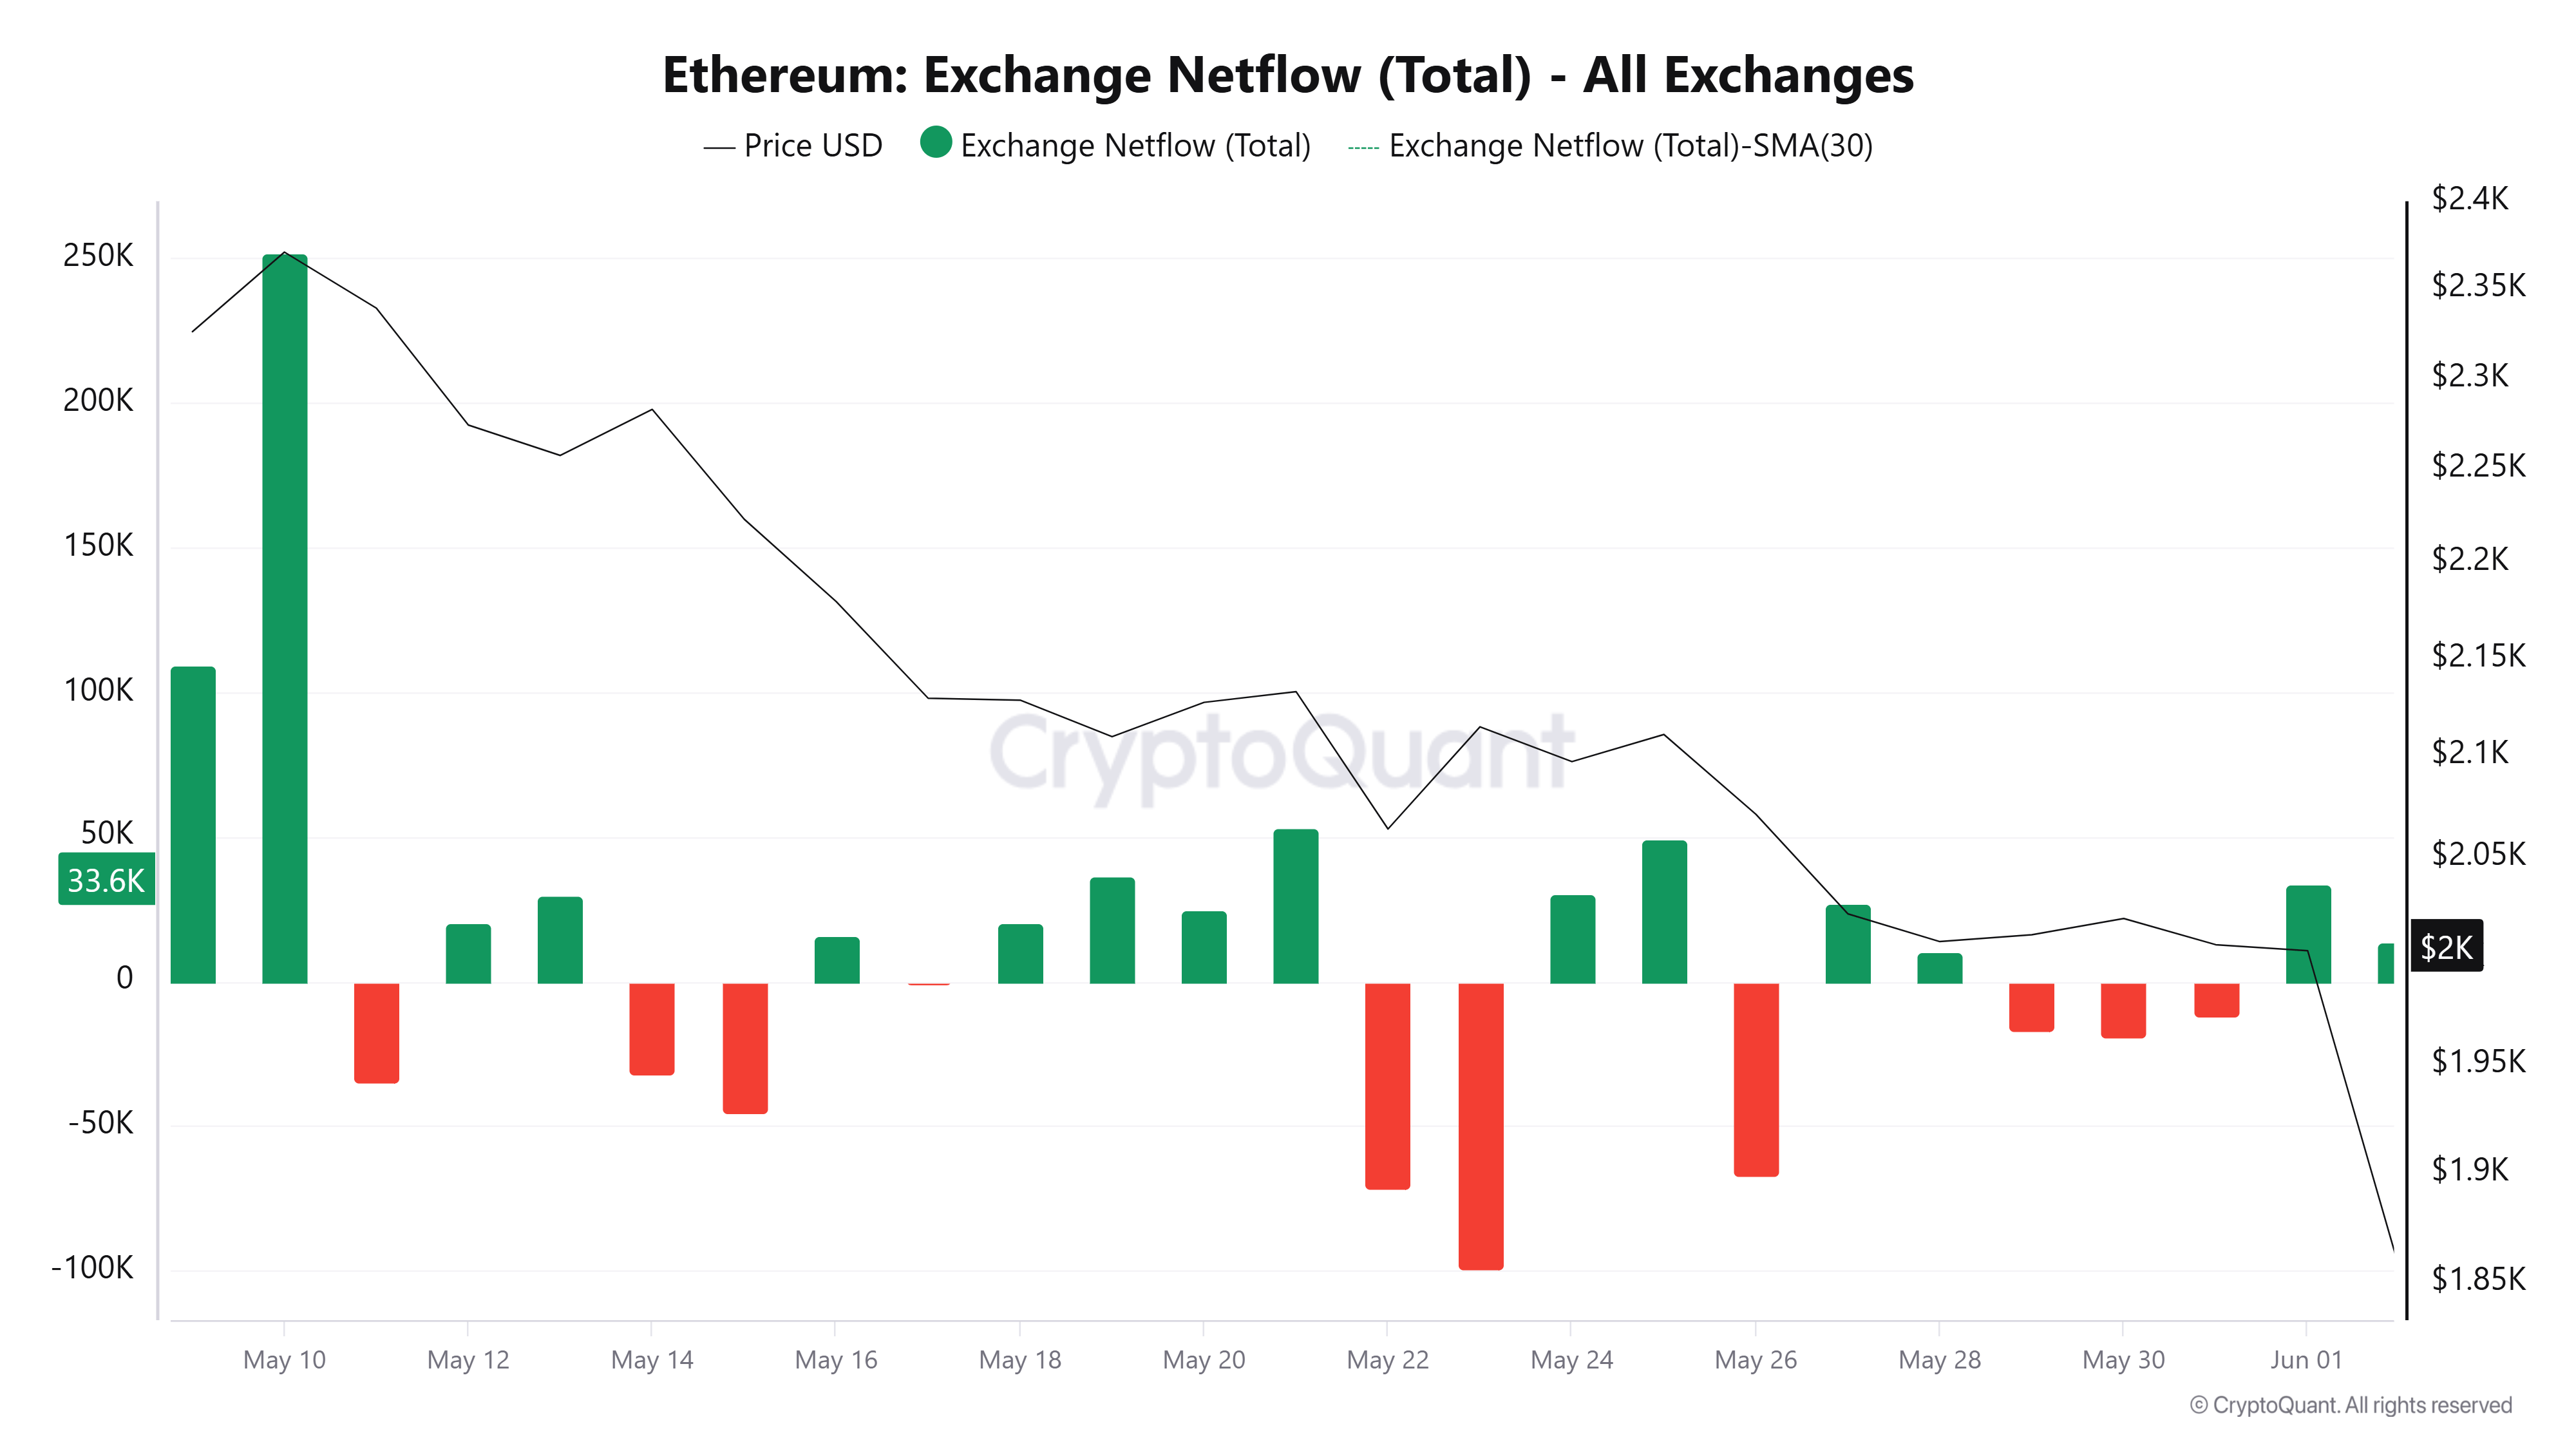
In the past week, selling pressure on spot markets was modest, as evidenced by a fairly flat trend in exchange net flows and minimal changes in the balances of retail and whale wallets.
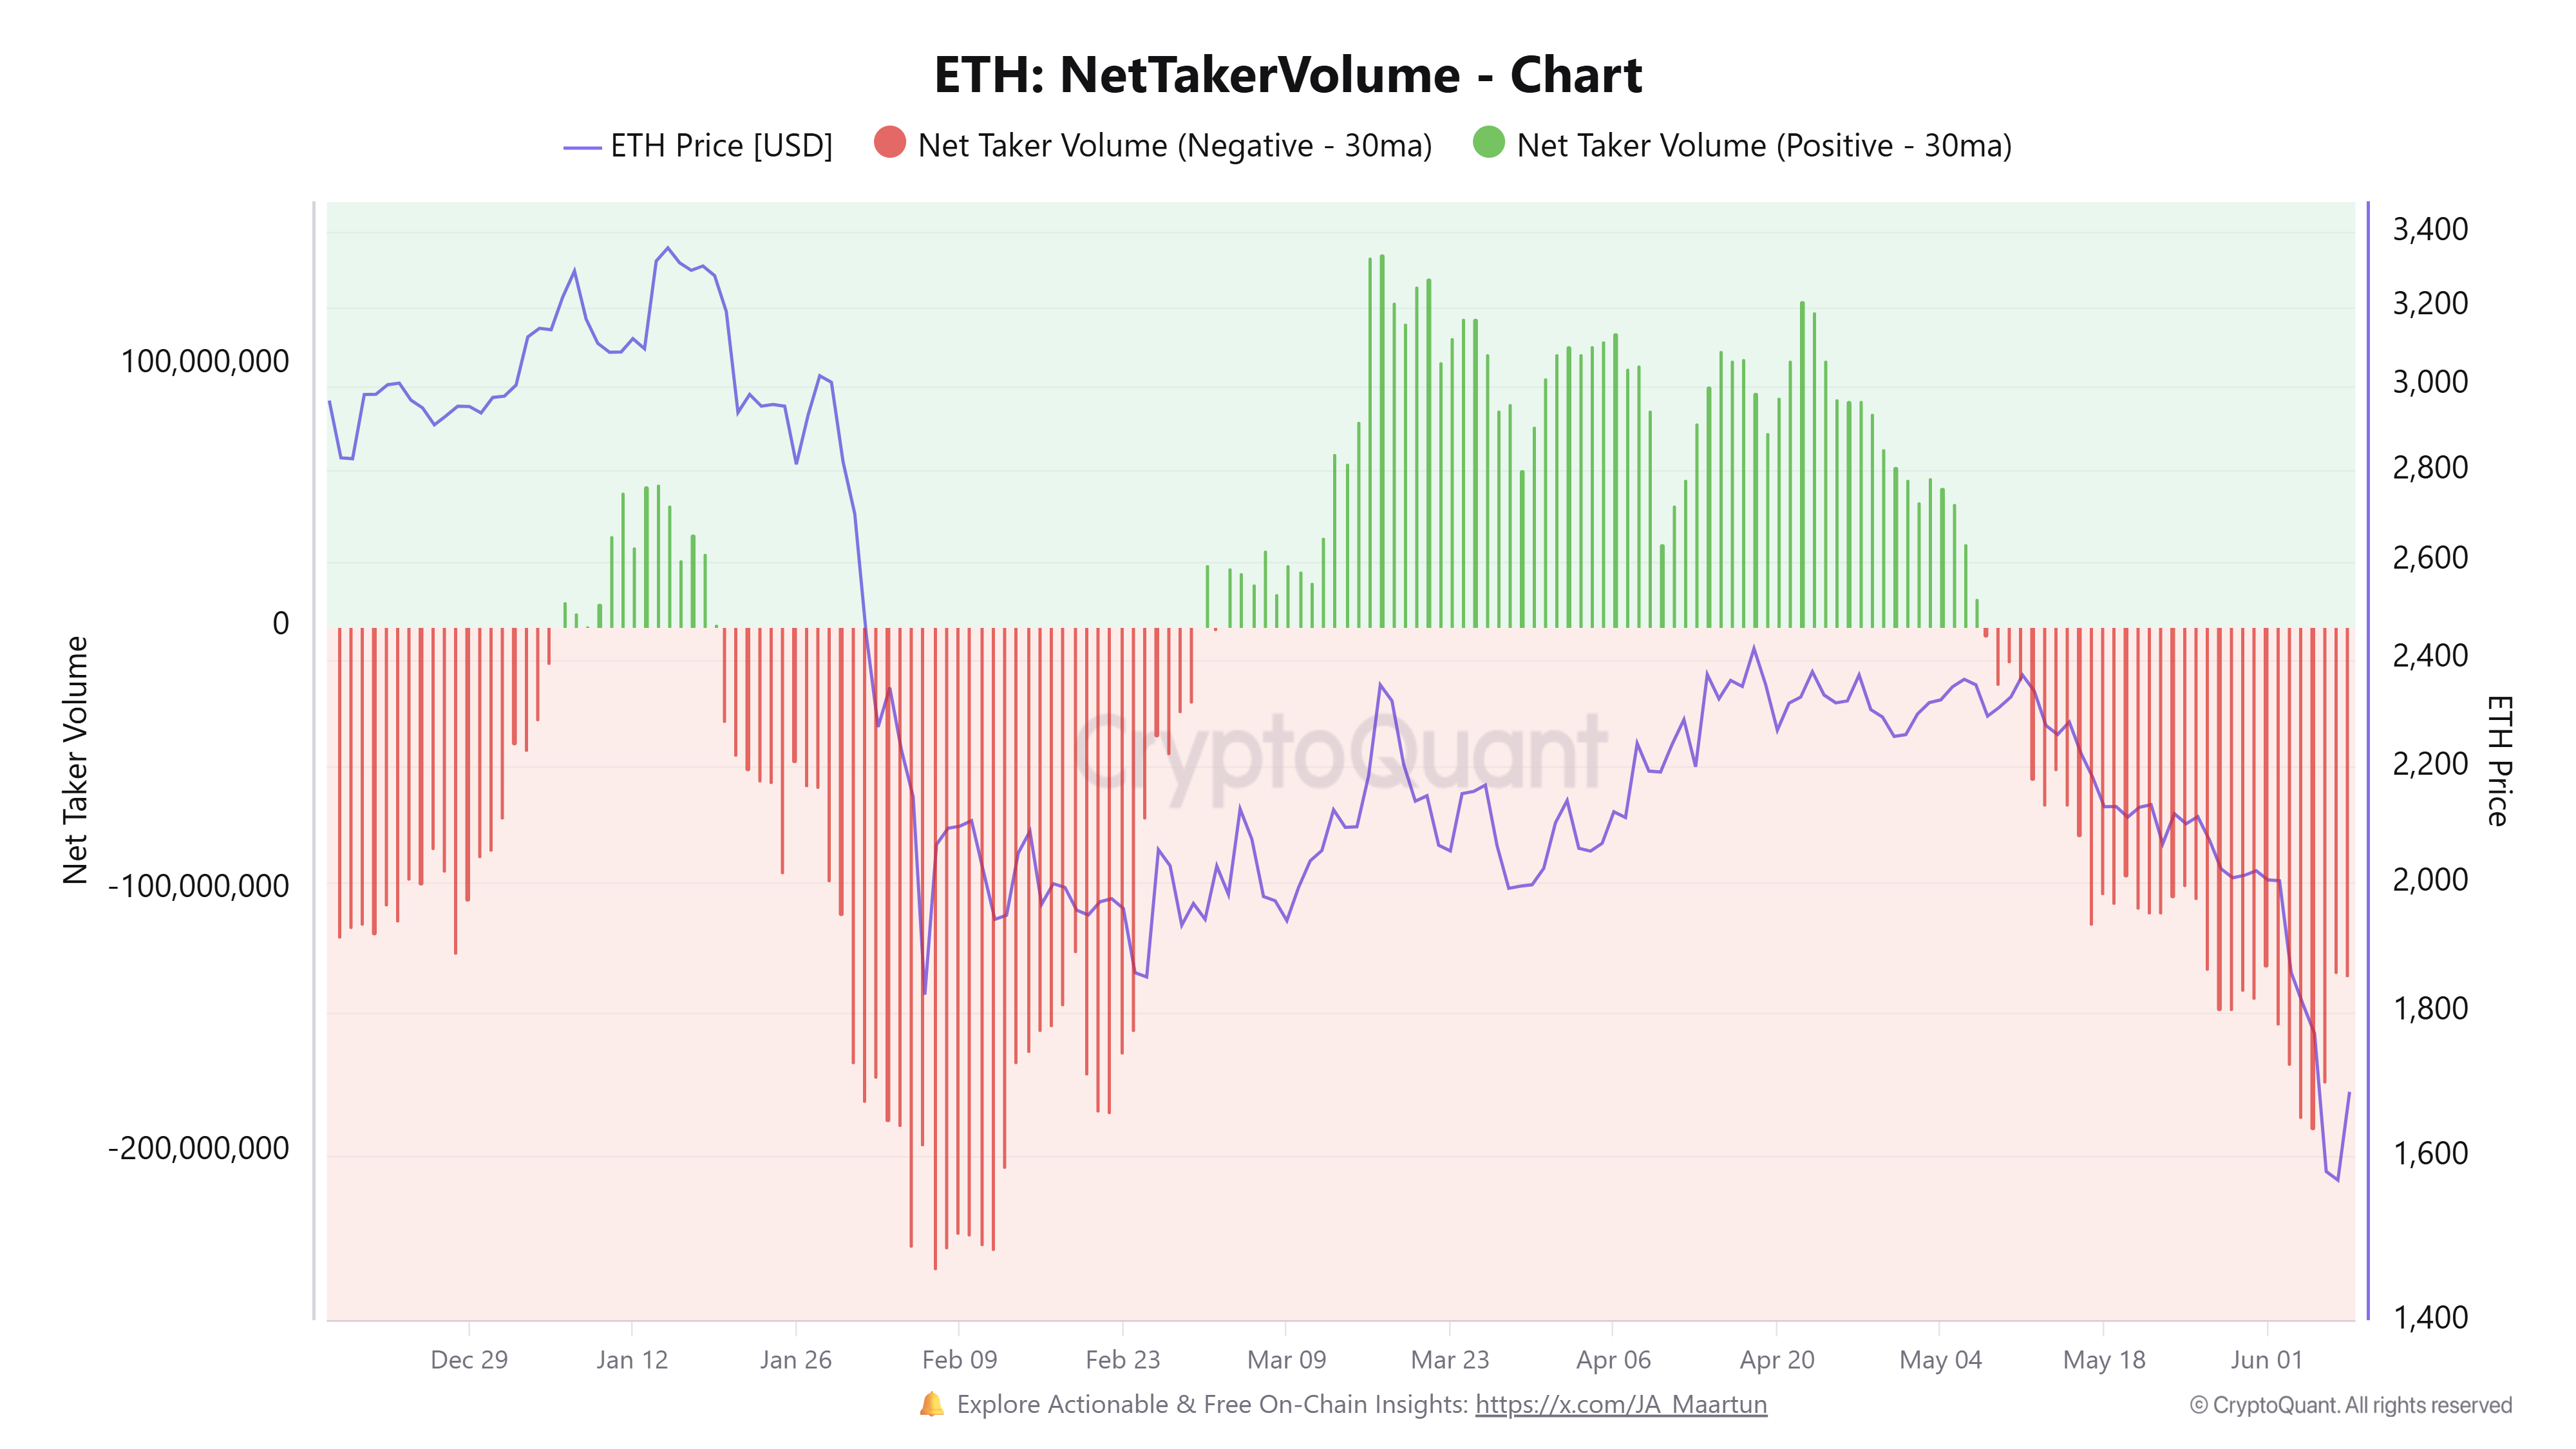
However, derivatives tell a different story. ETH's price has closely tracked the shift toward seller dominance in ETH Net Taker Volume. The metric, which measures the difference in volumes between buyers and sellers purchasing ETH perpetuals using market orders, flipped negative on May 11, with seller dominance expanding sharply last week.
The metric posed a similar move in late January to early February, with ETH prices also crashing alongside it.
Additionally, a wipeout of leveraged long exposure further pressured already-falling prices.
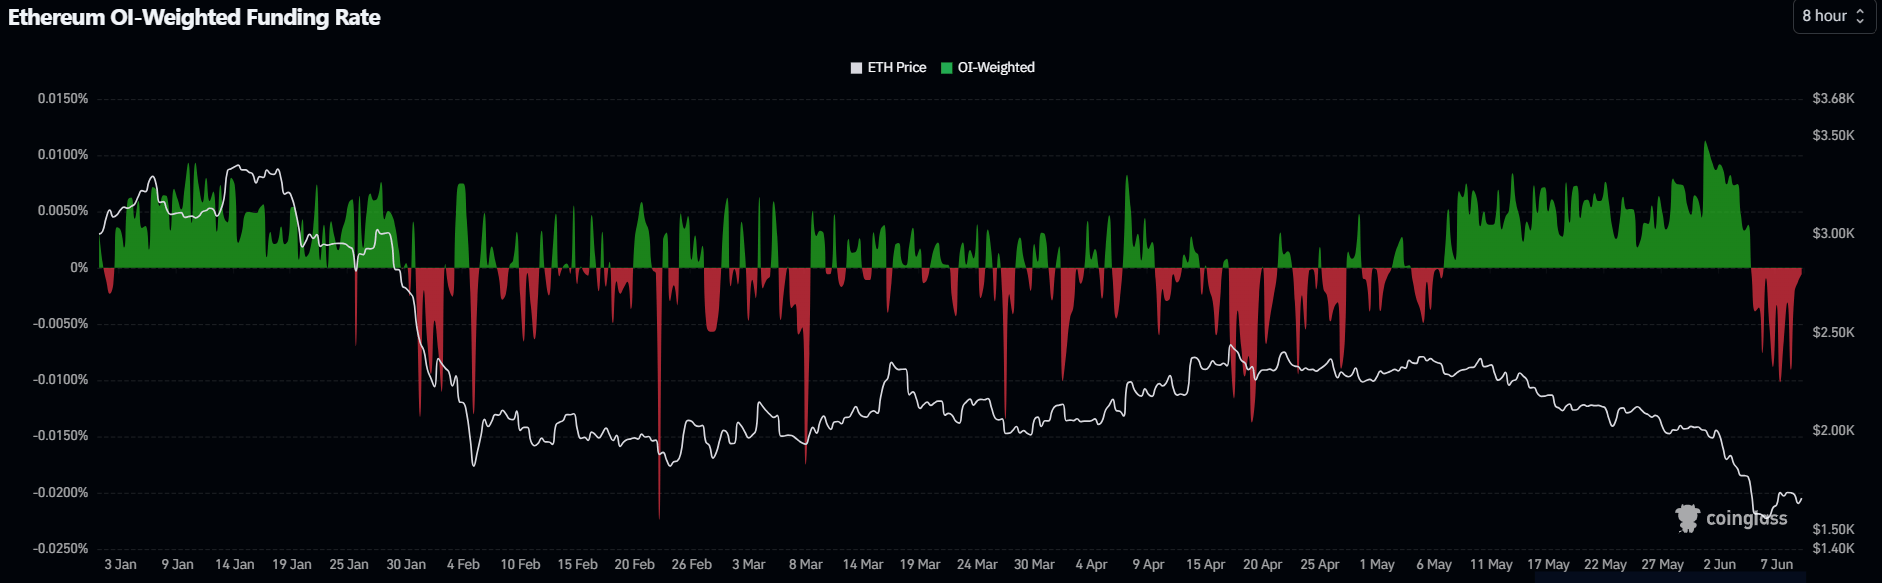
During the early stages of the market decline in mid-May, long traders continued adding leverage, buying the dip and pushing their liquidation price lower. The move is evidenced by Ethereum's open interest soaring to a record high of 15.98 million ETH and rising funding rates despite falling prices during the period.
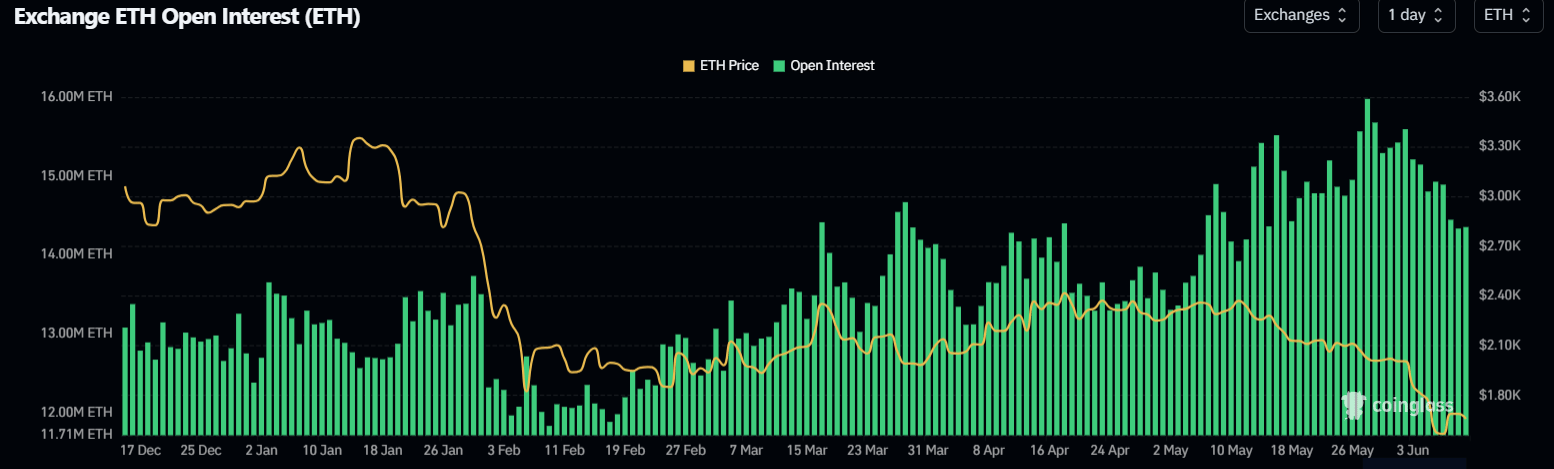
However, with broader market forces pressuring ETH, the top altcoin dipped further toward $1,500, prompting forced long liquidations as traders offloaded collateral in an already weakened market. Following the move, open interest eventually declined, combined with a flip to negative funding rates.
ETH establishes a potential bottom near $1,500
Historically, such resets in open interest and funding rates align with signs of a market bottom, prompting spot buyers to step in after a period on the sidelines.
Institutional investors in the US appear to be taking the cue, as US spot ETH exchange-traded funds (ETFs) posted a net inflow of $82.3 million on Monday, per SoSoValue data. At the same time, the Coinbase Premium Index, a measure of US sentiment, ticked upward after ETH approached the $1,500 level.
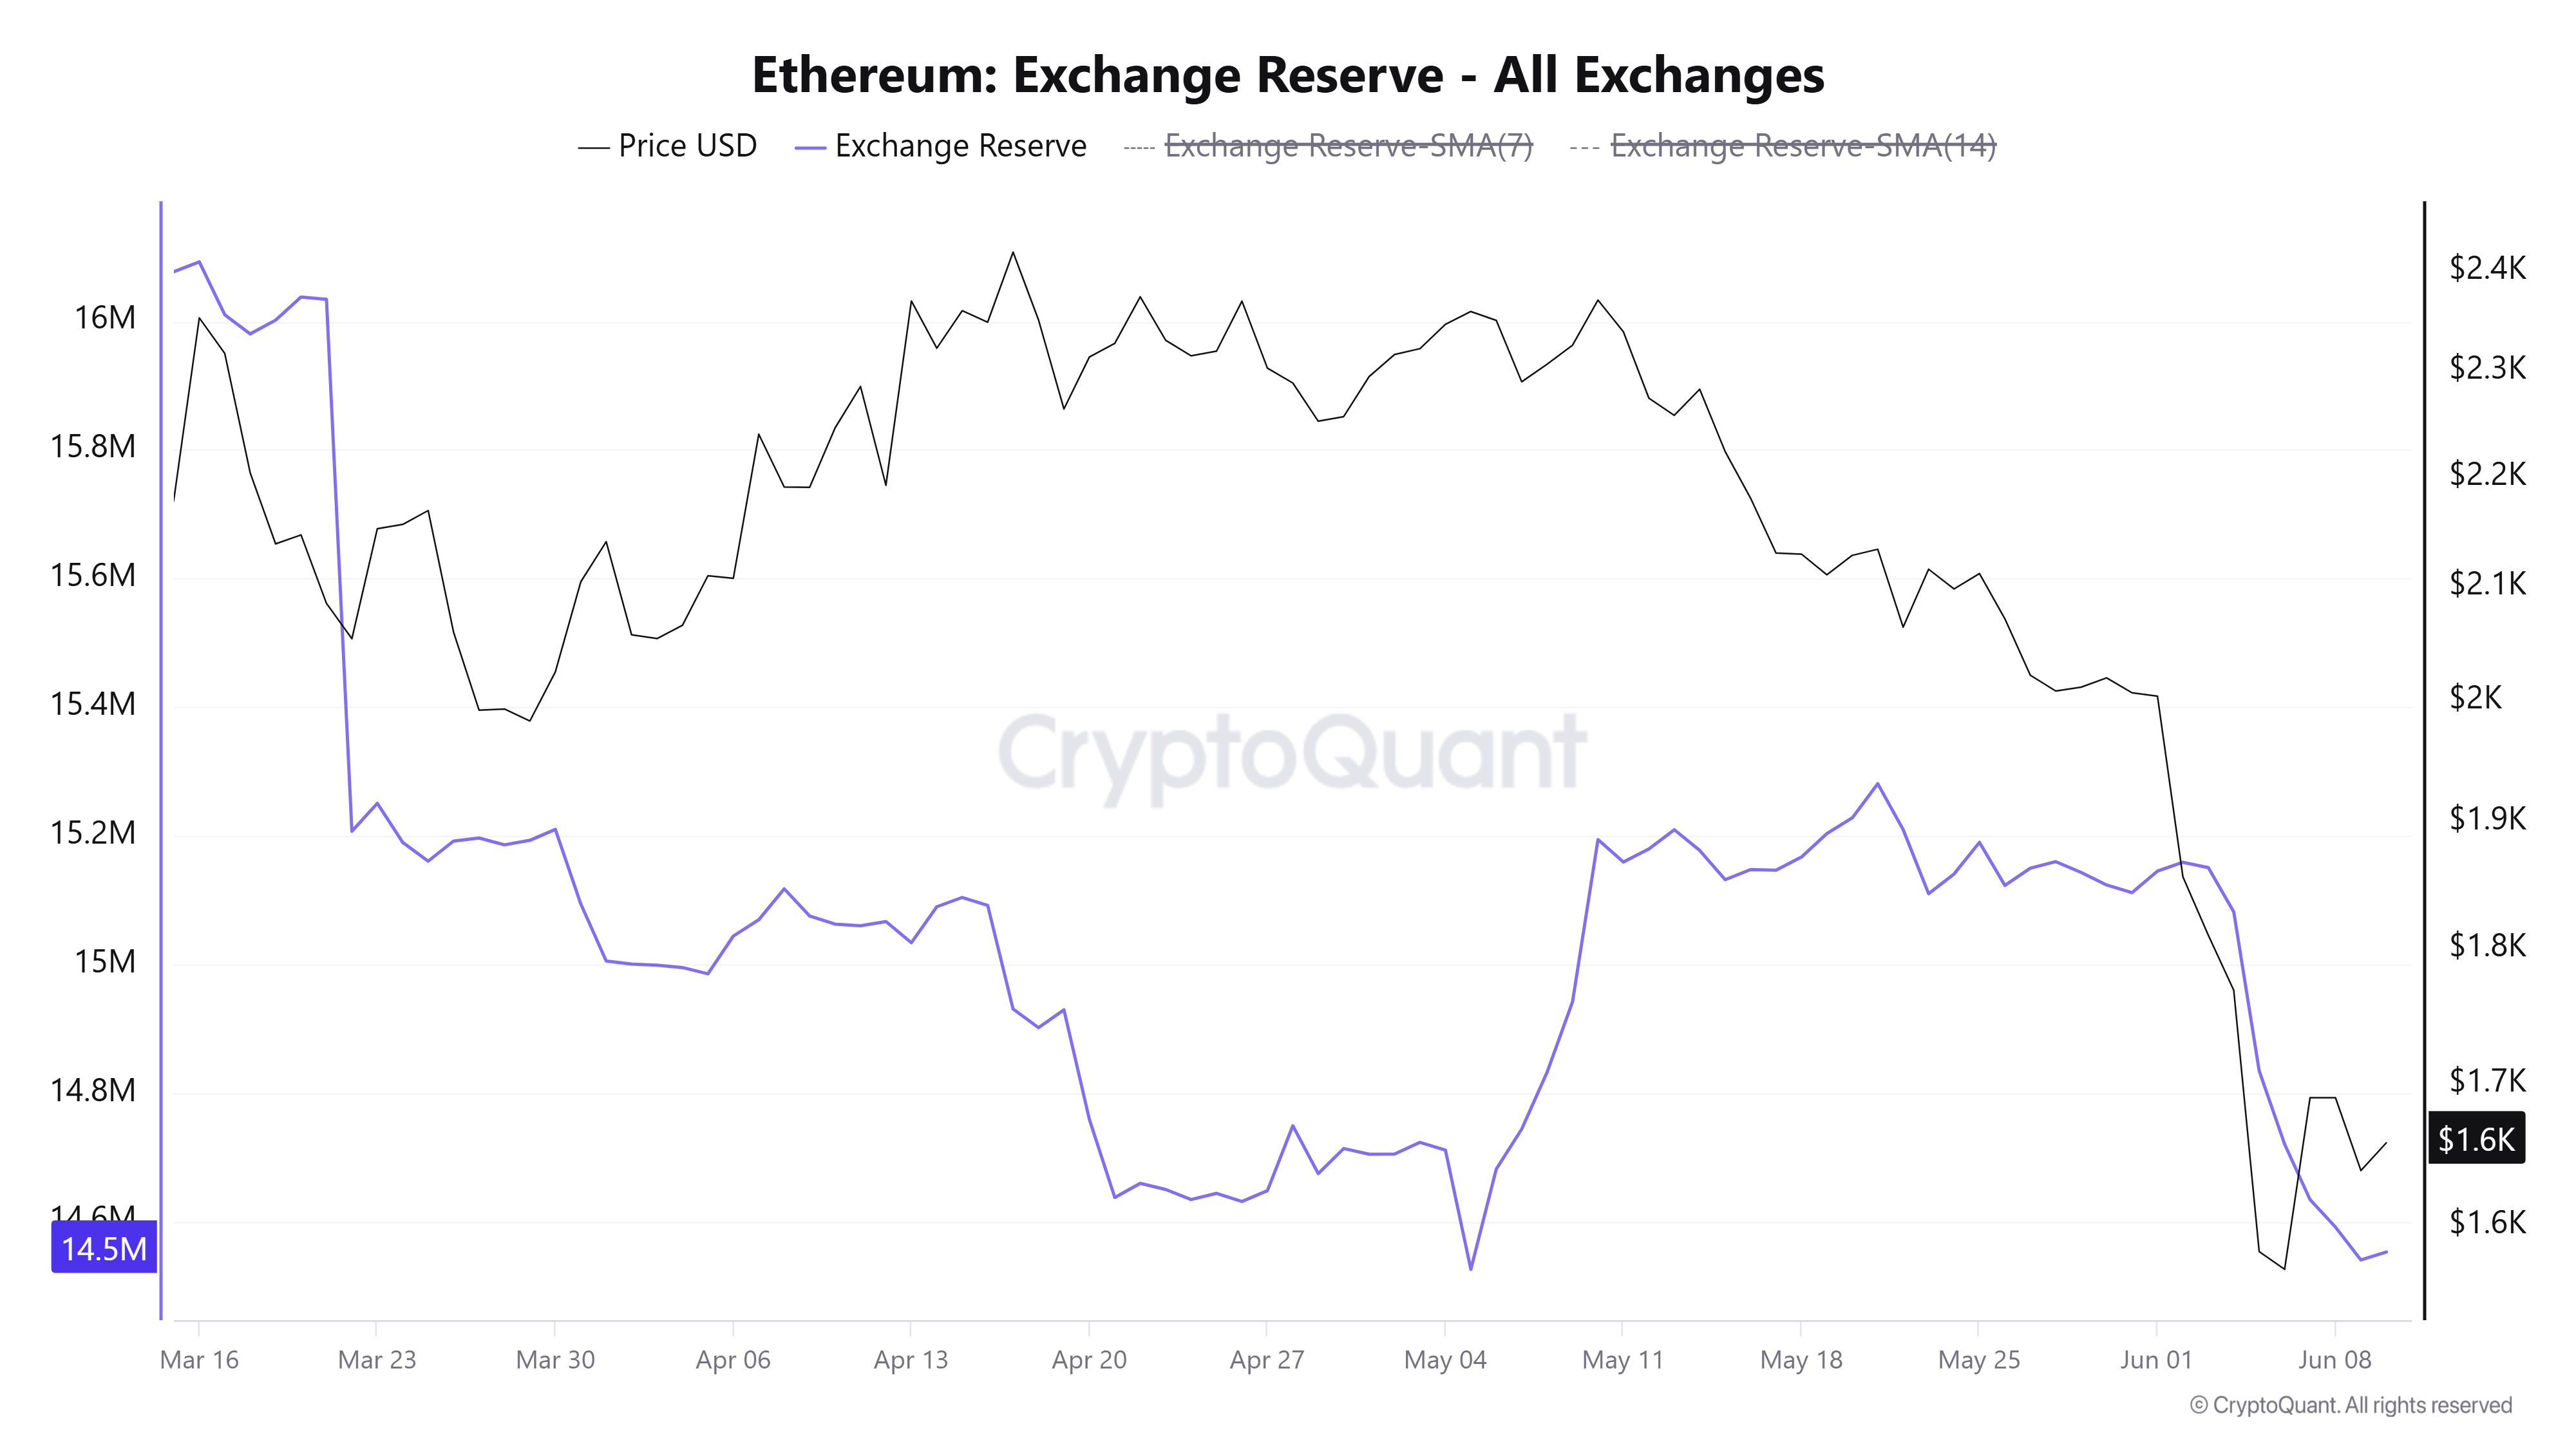
A similar trend is visible in Ethereum exchange reserves, which saw increased withdrawals as ETH approached $1,500. The moves across these metrics indicate that the level triggered dip buying activity among investors, making it a key onchain support level and a potential local bottom.
Ethereum Price Forecast: ETH maintains move above $1,500
On the daily chart, ETH is extending a clear bearish bias as price holds well below the 20-, 50- and 100-day Exponential Moving Averages (EMAs), with the short-term EMA clustered near $1,853 and the longer gauges rising from around $2,027 to $2,176. This configuration suggests rallies remain corrective within a broader downtrend.
Momentum indicators such as the 14-day Relative Strength Index (RSI) slipping into oversold territory near 28 and a depressed Stochastic near 28 hint that downside pressure is strong but could transition into a consolidation or a corrective bounce rather than a sustained recovery.
On the topside, initial resistance emerges at $1,741, followed by a tighter band around $1,806 and $1,909, before a more notable cap near $2,019 and the 50-day EMA around $2,043. Additional barriers are at $2,108 and the 100-day EMA at $2,187, before the $2,211 and $2,389 levels.
On the downside, immediate focus is on the latest pivot around the current price zone, with subsequent support at $1,524 and then $1,405, where buyers would need to show up to prevent the bearish structure from extending lower.
(The technical analysis of this story was written with the help of an AI tool.)

超过一百万用户依赖 FXStreet 获取实时市场数据、图表工具、专家洞见和外汇新闻。其全面的经济日历和教育网络研讨会帮助交易者保持信息领先、做出审慎决策。FXStreet 拥有约 60 人的团队,分布在巴塞罗那总部及全球各地区。
阅读更多


