
AI Crypto Price Predictions: FET, VIRTUAL, and TAO rally takes a breather
作者 Vishal Dixit
更新: 17 Mar 2026


热门文章

Artificial Intelligence (AI) cryptocurrencies, such as Artificial Superintelligence Alliance (FET), Virtuals Protocol (VIRTUAL), and Bittensor (TAO), are taking a breather on Tuesday, after respective rallies last week.
- Artificial Superintelligence Alliance is down 4% on Tuesday, retracing after the 20% rally on Monday.
- Virtuals Protocol hovers above the 100-day EMA on Tuesday after a 6% rise on Monday.
- Bittensor steadies around $280 on Tuesday, holding above the 200-day EMA and securing the 55% gains from last week.
Artificial Intelligence (AI) cryptocurrencies, such as Artificial Superintelligence Alliance (FET), Virtuals Protocol (VIRTUAL), and Bittensor (TAO), are taking a breather on Tuesday, after respective rallies last week.
Headwinds near $0.2500 caps FET’s rebound
Artificial Superintelligence Alliance is down 4% at press time on Tuesday, retracing after a 20% jump on Monday. The near-term bias turns cautiously bullish as FET rebounded from the $0.1400 to Monday's high at $0.2569.
The 78.6% Fibonacci retracement at $0.2622, measured from the $0.13 low to the $0.31 high, serves as the overhead resistance, capping the upside to the 200-day Exponential Moving Average (EMA) at $0.3082.
FET now holds marginally above the 100-day EMA, framing this advance as an early recovery within a broader down phase.
The Moving Average Convergence Divergence (MACD) trades above its signal and the zero line, with a positive, expanding histogram indicating strengthening upside momentum. The Relative Strength Index (RSI) at 72 shows overbought conditions that could slow the ascent without yet breaking the bullish tone.
Initial support emerges at the 100-day EMA at $0.2170, followed by the 50% retracement around $0.2054.
VIRTUAL's rally hits a bump near 100-day EMA
Virtuals Protocol is down 2% at the time of writing on Tuesday, after five consecutive days of recovery. The near-term bias is mildly bullish as price holds above the 50-day EMA near $0.7141, while testing the 100-day EMA at $0.7818, framing an emerging recovery within a broader downbeat backdrop defined by the 200-day average near $0.9455.
If the AI tokens slip below $0.7818, it could retest the 50-day EMA at $0.7141.
The MACD line is above its signal line and has turned positive, with a modestly expanding histogram that suggests improving upside momentum. The RSI at 61 stays above its midline without entering overbought territory, reinforcing a moderate bullish tone rather than a stretched advance.
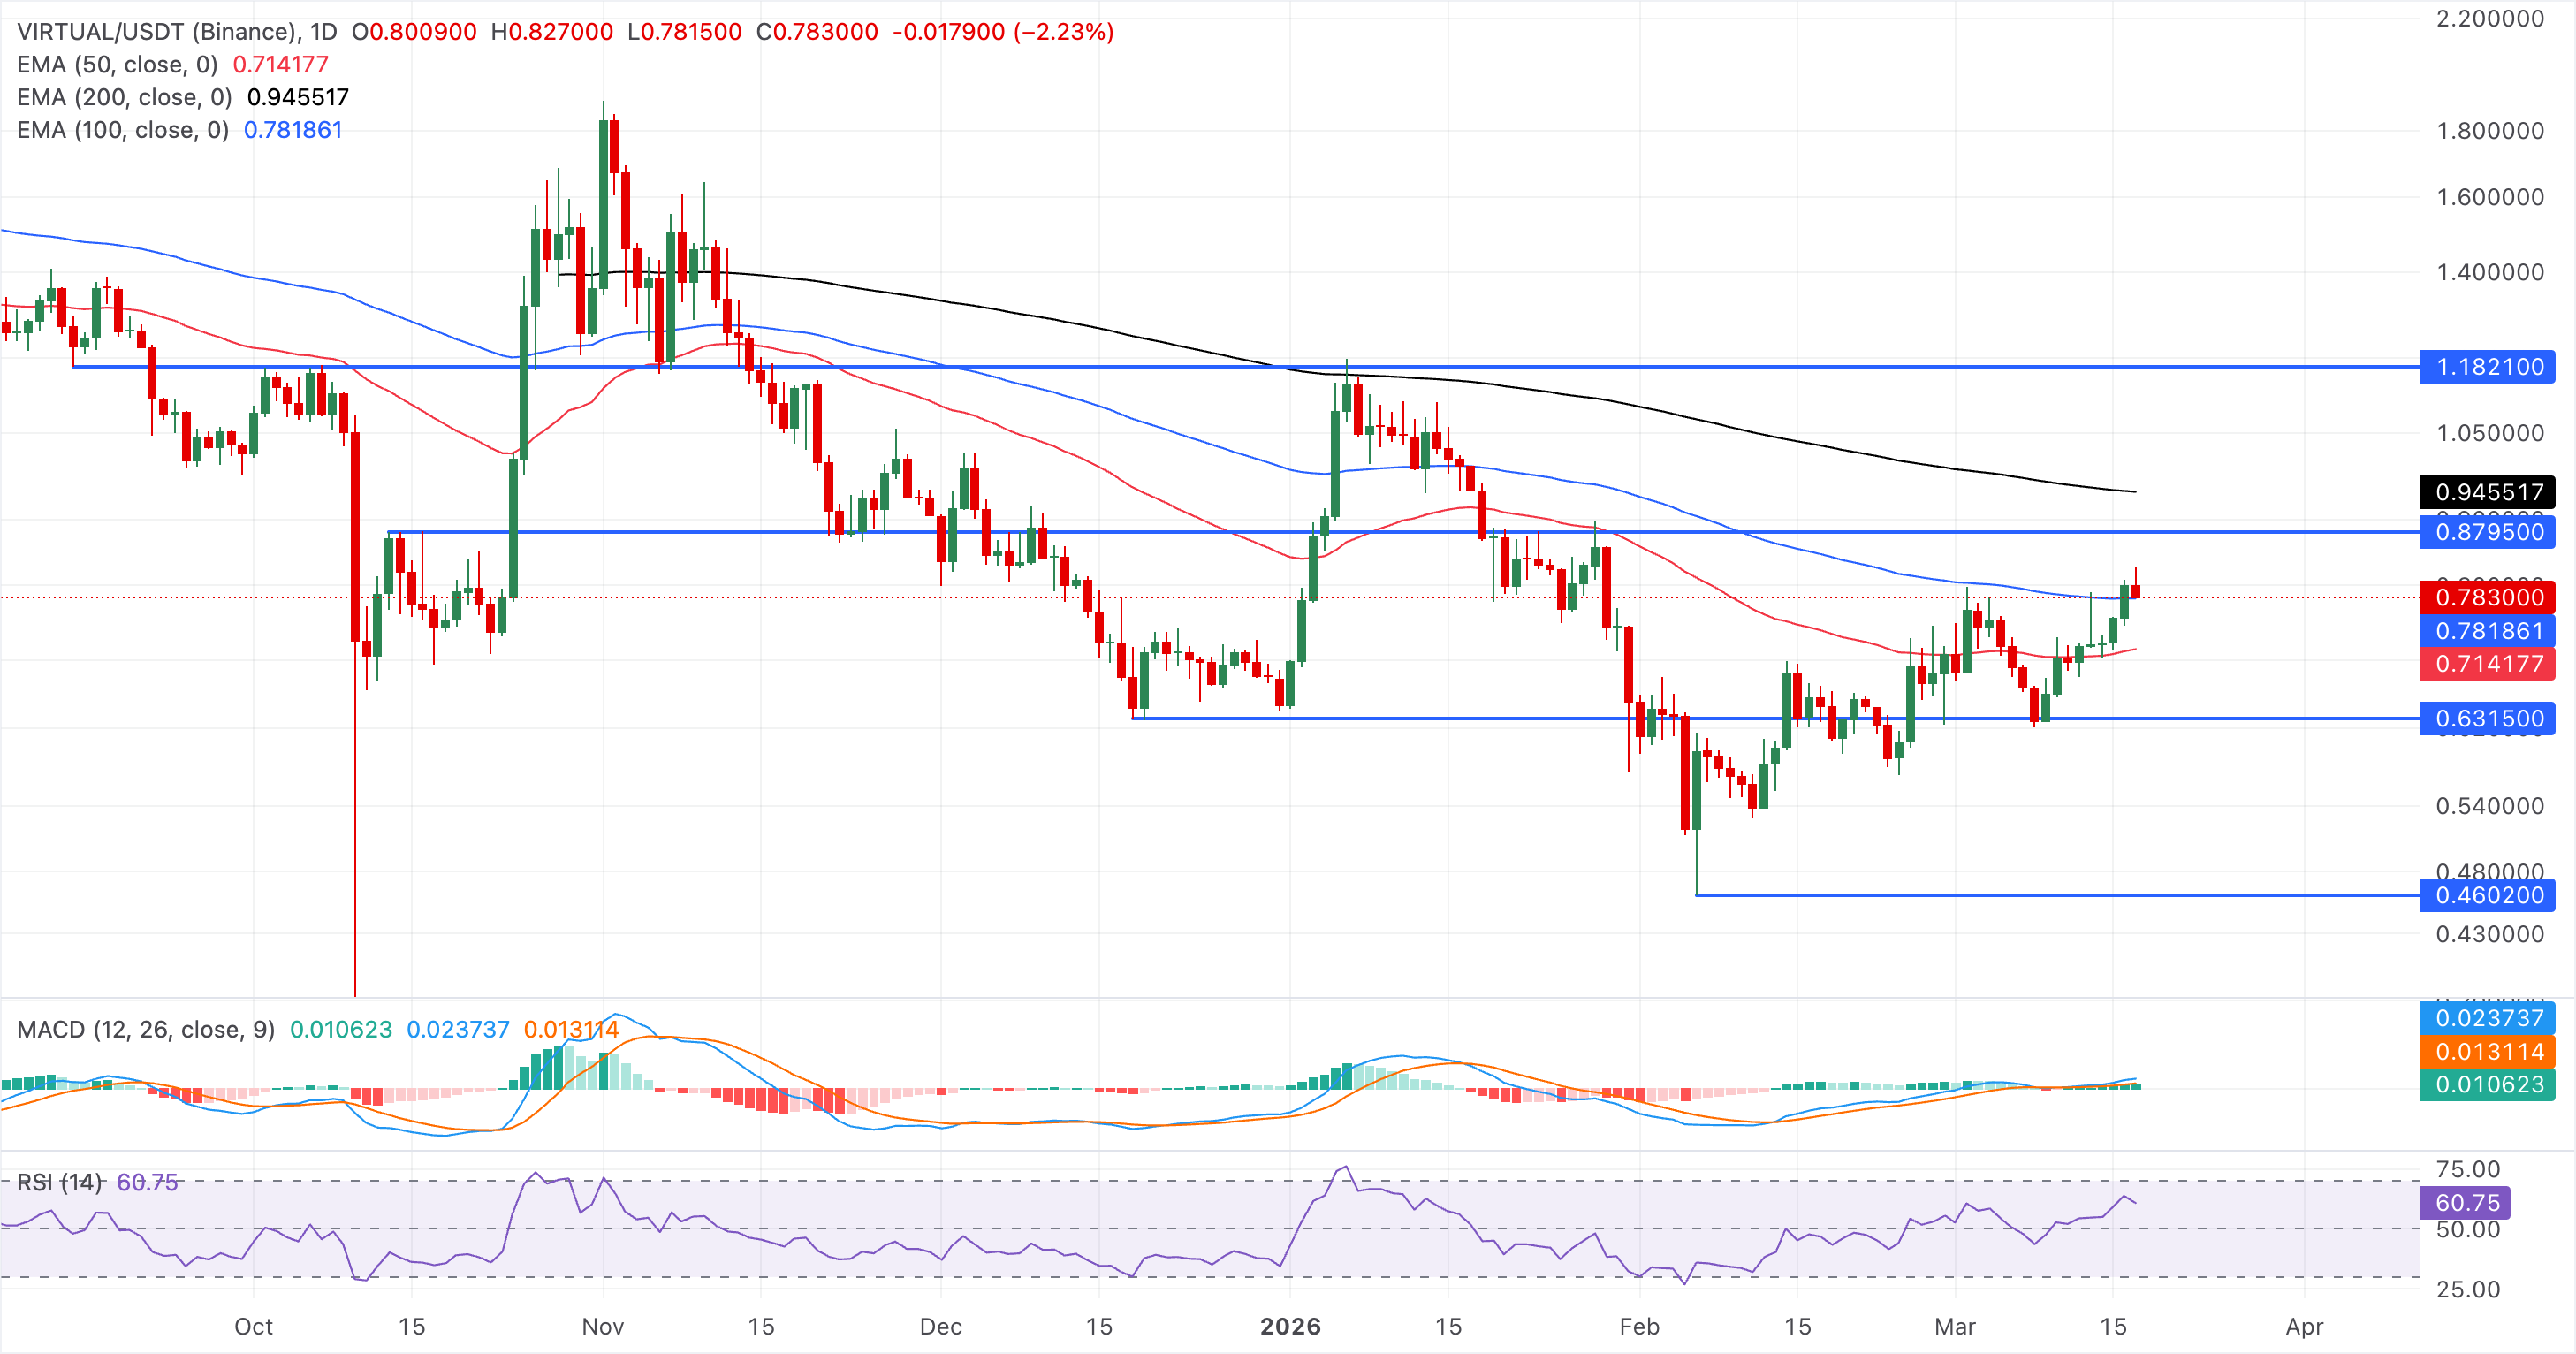
Looking up, the cluster of resistance for VIRTUAL includes the October 13 high at $0.8795 and the 200-day EMA at $0.9455. A close above this average could open the door above the $1.00 psychological level, targeting the September 15 low at $1.1821.
Bittensor rally struggles to surpass $300
Bittensor hovers around $280 at press time on Tuesday, holding steady so far this week after a 55% rally in the previous one. The AI token now trades well above the 50-, 100-, and 200-day EMAs, which have begun to turn higher and are aligning in support of an emerging uptrend.
However, the near-term bias is cautiously bullish for TAO, as the falling channel breakout rally faces headwinds near $300. To extend the rally further, Bittensor must secure a daily close above this level, opening a path to the September 13 high at $369.
Momentum remains strong, with the RSI at 78 easing from overbought but still anchored in the upper 70s, while the MACD stays in positive territory and above its signal line, with expanding positive histograms suggesting persistent upside pressure despite stretched conditions.
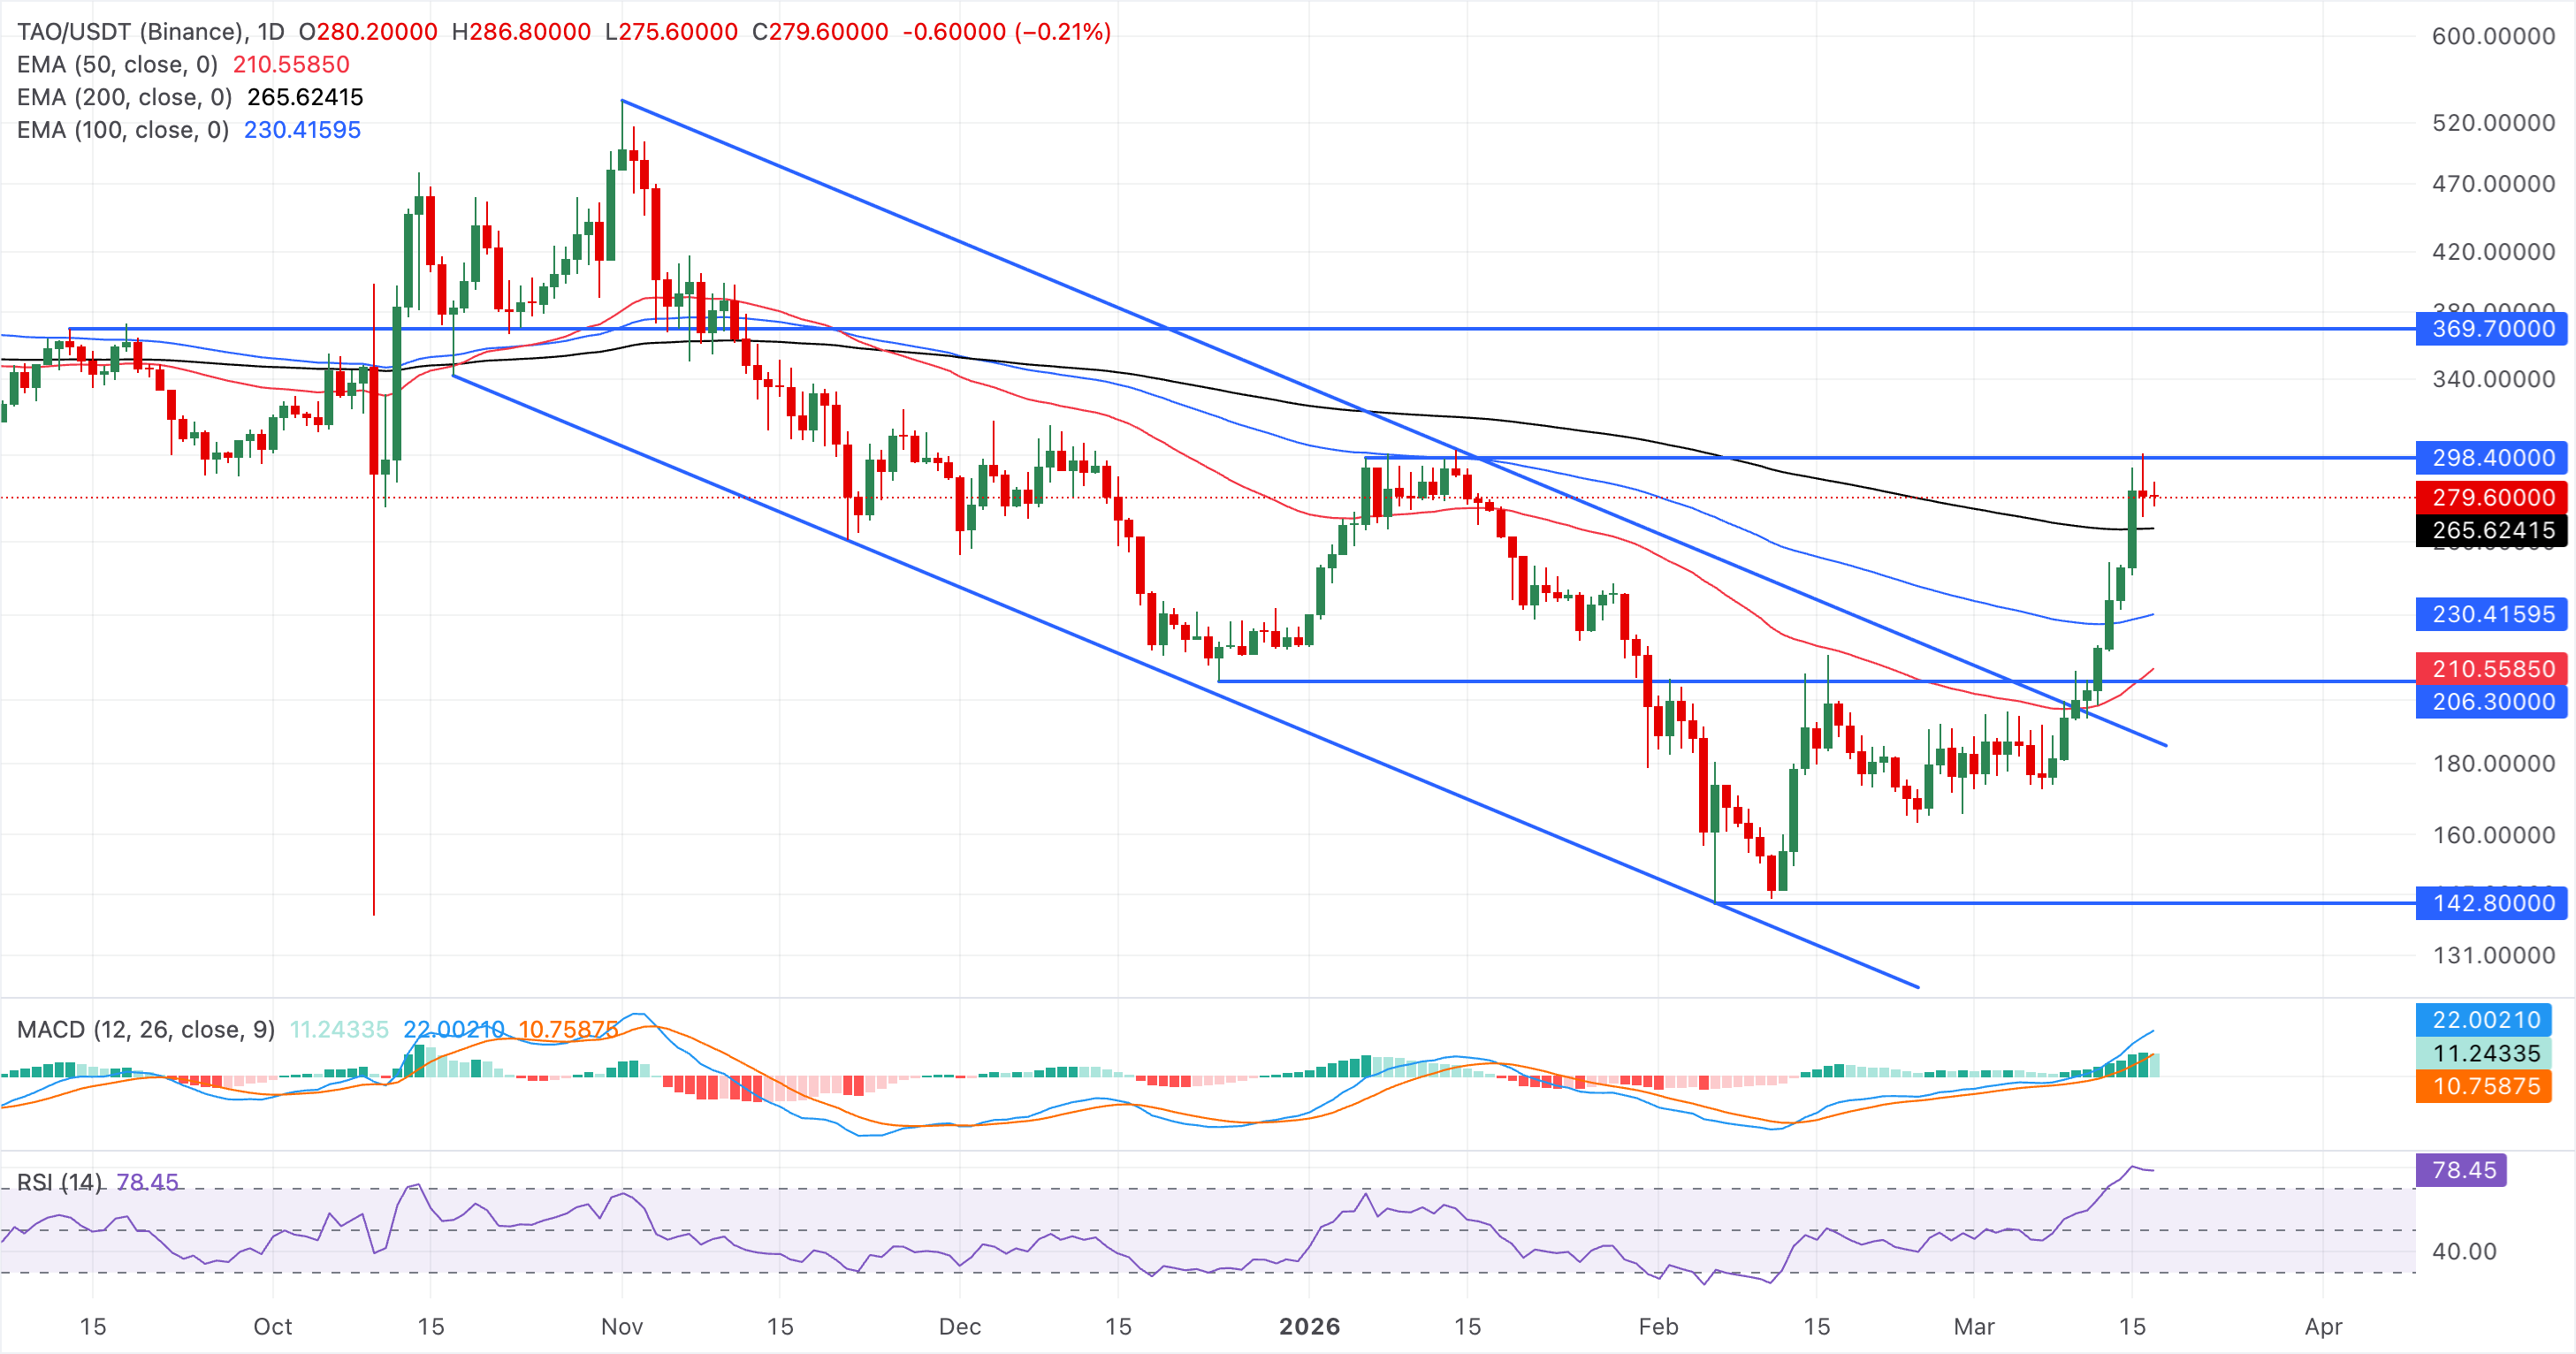
Looking down, the 200-day EMA at $265, followed by the 100-day EMA at $230, serves as crucial support zones.
(The technical analysis of this story was written with the help of an AI tool.)

超过一百万用户依赖 FXStreet 获取实时市场数据、图表工具、专家洞见和外汇新闻。其全面的经济日历和教育网络研讨会帮助交易者保持信息领先、做出审慎决策。FXStreet 拥有约 60 人的团队,分布在巴塞罗那总部及全球各地区。
阅读更多


