

AUD/USD Price Forecast: 20-day EMA continues to be key barrier
- AUD/USD rises to near 0.6945 as the US Dollar faces pressure ahead of the US CPI data.
- The US inflation data will influence market expectations for the Fed’s monetary policy outlook.
- Upbeat China Trade Balance data strengthens the Australian Dollar.
The AUD/USD pair trades 0.35% higher to near 0.6945 during the European trading session on Tuesday. The Aussie pair gains as the US Dollar (USD) underperforms its peers ahead of the United States (US) Consumer Price Index (CPI) data for June, which will be published at 12:30 GMT.
At press time, the US Dollar Index (DXY), which gauges the Greenback’s value against six major currencies, trades 0.1% lower to near 101.16.

US Dollar Price Today
The table below shows the percentage change of US Dollar (USD) against listed major currencies today. US Dollar was the weakest against the New Zealand Dollar.
| USD | EUR | GBP | JPY | CAD | AUD | NZD | CHF | |
|---|---|---|---|---|---|---|---|---|
| USD | -0.11% | -0.19% | -0.13% | -0.32% | -0.31% | -0.84% | -0.29% | |
| EUR | 0.11% | -0.09% | 0.00% | -0.19% | -0.21% | -0.73% | -0.17% | |
| GBP | 0.19% | 0.09% | 0.09% | -0.11% | -0.10% | -0.64% | -0.09% | |
| JPY | 0.13% | 0.00% | -0.09% | -0.18% | -0.20% | -0.73% | -0.18% | |
| CAD | 0.32% | 0.19% | 0.11% | 0.18% | -0.01% | -0.52% | 0.03% | |
| AUD | 0.31% | 0.21% | 0.10% | 0.20% | 0.00% | -0.53% | 0.05% | |
| NZD | 0.84% | 0.73% | 0.64% | 0.73% | 0.52% | 0.53% | 0.56% | |
| CHF | 0.29% | 0.17% | 0.09% | 0.18% | -0.03% | -0.05% | -0.56% |
The heat map shows percentage changes of major currencies against each other. The base currency is picked from the left column, while the quote currency is picked from the top row. For example, if you pick the US Dollar from the left column and move along the horizontal line to the Japanese Yen, the percentage change displayed in the box will represent USD (base)/JPY (quote).
Market participants will pay close attention to the inflation data as the latest comments from Federal Reserve (Fed) officials have signaled that they are more concerned about high inflation than subdued job market conditions.
On Monday, Fed Governor Christopher Waller said that another hot inflation figure would be a “signal”, not a noise, about the need to tighten monetary conditions further.
According to estimates, the US headline CPI growth cooled down to 3.8% Year-on-Year (YoY) in June from 4.2% in May, with core figures rising steadily by 2.9%. On a monthly basis, the headline inflation is seen declining by 0.1%, while core figures are estimated to have remained steady at 0.2%.
Meanwhile, upbeat China’s Trade Balance data has strengthened the Australian Dollar (AUD), which showed that trade surplus widened by USD125.62 billion against +USD121 billion estimates and the previous reading of +USD105.43 billion.
AUD/USD technical analysis
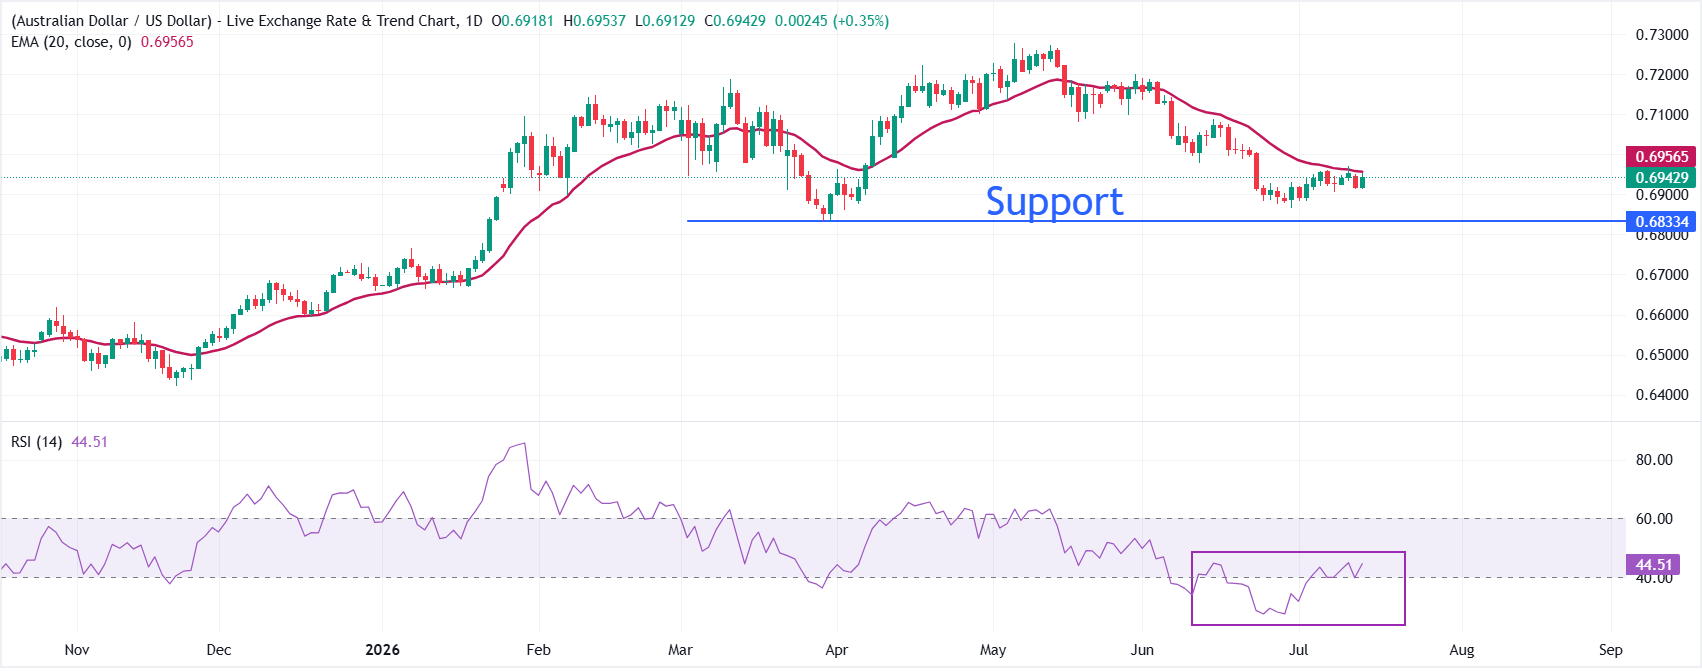
AUD/USD trades higher at around 0.6943 at press time. However, the near-term tone of the pair remains bearish as spot remains below the 20-day Exponential Moving Average (EMA), which is at 0.6957. The pair’s inability to recover this short-term EMA hints at persistent overhead supply, while the Relative Strength Index (14) around 44 keeps momentum mildly negative without reaching oversold territory, suggesting sellers retain control but lack strong conviction.
On the topside, immediate resistance is located at the 20-day EMA at 0.6957, and a daily close above this barrier would be needed to ease the current downside bias. The pair could extend the recovery towards the June 23 high at 0.7006 if the pair breaks above the EMA. Looking down, the pair could slide towards the January 7 high of 0.6766 if it drops below the March low of 0.6904.
(The technical analysis of this story was written with the help of an AI tool. Know more.)
Economic Indicator
Trade Balance USD
The Trade Balance released by the General Administration of Customs of the People’s Republic of China is a balance between exports and imports of total goods and services. A positive value shows trade surplus, while a negative value shows trade deficit. It is an event that generates some volatility for the CNY. As the Chinese economy has influence on the global economy, this economic indicator would have an impact on the Forex market. In general, a high reading is seen as positive (or bullish) CNY, while a low reading is seen as negative (or bearish) for the CNY.
Read more.Last release: Tue Jul 14, 2026 02:30
Frequency: Monthly
Actual: $125.62B
Consensus: $121B
Previous: $105.43B
Source: National Bureau of Statistics of China














