
Avalanche Price Forecast: AVAX capped below technical barrier as record ETF inflows fail to lift sentiment
作者 Manish Chhetri
更新: 28 Apr 2026


热门文章

Avalanche (AVAX) extends its correction, trading below $9.30 on Tuesday after running into resistance near a key technical barrier that continues to cap upside momentum.
- Avalanche price faces resistance around the 50-day EMA at $9.40, keeping a capped tone in the near term.
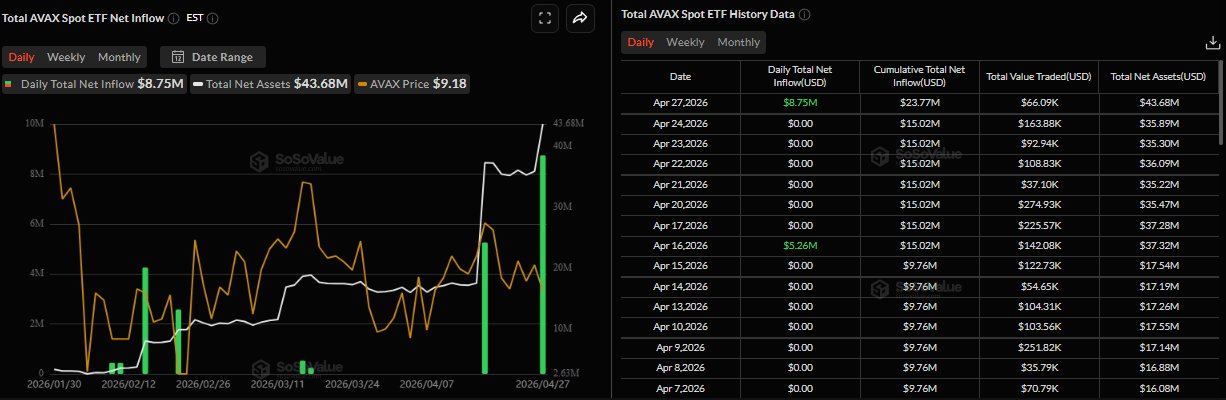
- Spot-listed AVAX ETFs recorded the highest single-day inflow of $8.75 million on Monday.
- Mixed sentiment among traders in the derivatives market, alongside weakening momentum, continues to limit upside potential.
Avalanche (AVAX) extends its correction, trading below $9.30 on Tuesday after running into resistance near a key technical barrier that continues to cap upside momentum. Institutional demand in Spot-listed AVAX Exchange Traded Funds (ETFs) failed to support the price action despite recording the highest single-day inflow of $8.75 million on Monday. Mixed sentiment in the derivatives market and weakening technical indicators suggest traders remain cautious in the near-term.
Highest single-day inflow
SoSoValue data shows that AVAX’s spot ETFs recorded an inflow of $8.75 million on Monday, the highest single-day inflow since its launch, following days of silence. Despite this positive inflow, AVAX price remains under pressure as broader market sentiment stays cautious amid US-Iran uncertainty.
Mixed signals from derivatives caps recovery
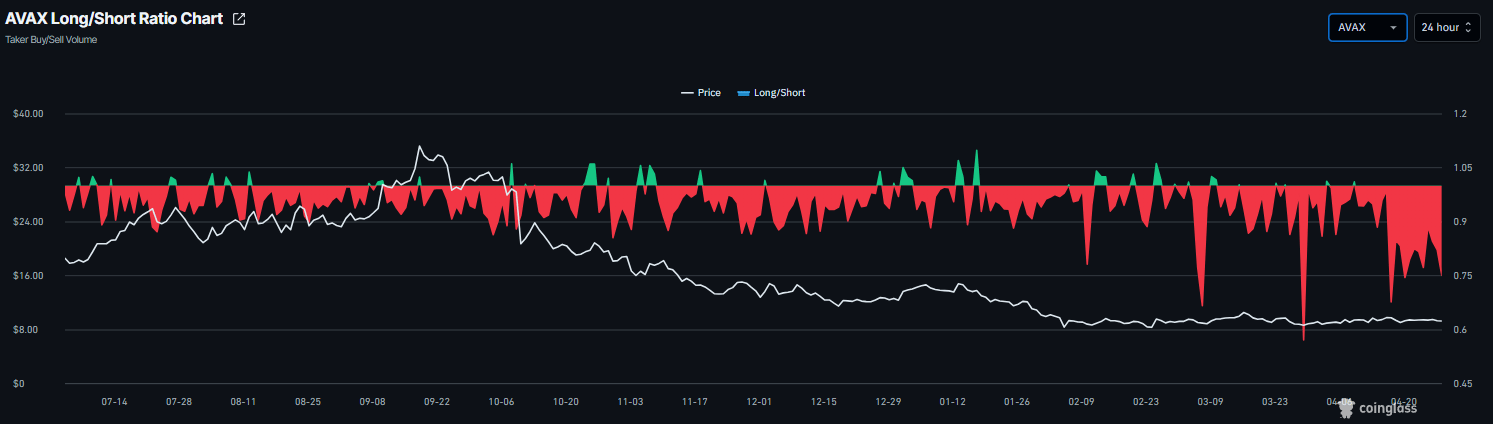
On the derivatives side, Avalanche’s data show mixed sentiment. CoinGlass’ long-to-short ratio for AVAX reads 0.74 on Tuesday, nearing its lowest level over a month, and has remained mostly below one since early April. This ratio, being below one, reflects bearish sentiment in the market, as more traders are betting on the asset’s price to fall.
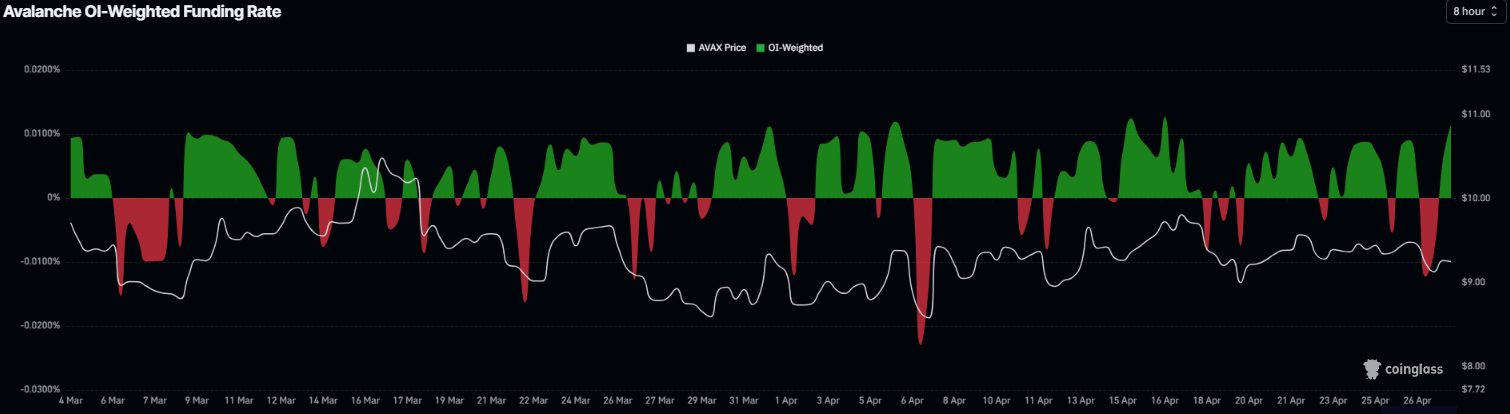
Meanwhile, the funding rates support improving sentiment. CoinGlass’ OI-Weighted Funding Rate data for AVAX flipped positive on Monday, reading 0.0115% on Tuesday. This positive rate indicates that longs are paying shorts and projecting a bullish sentiment. This combination suggests indecision among AVAX investors and a lack of clear directional bias, which limits the chances of a sustained recovery.
Avalanche Price Forecast: AVAX faces resistance as recovery momentum weakens
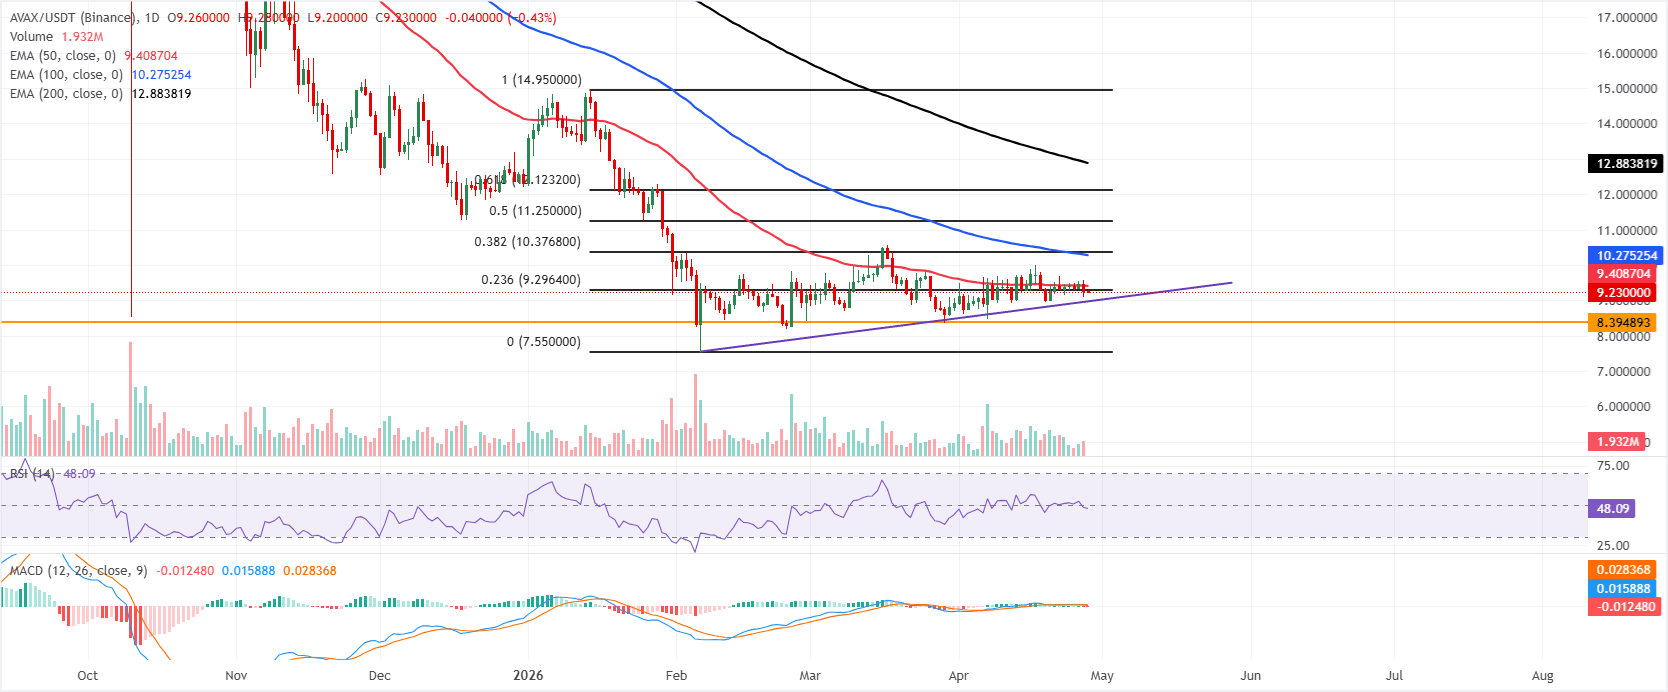
Avalanche price trades at $9.23 on Tuesday, keeping a capped tone as it sits beneath the 50-day Exponential Moving Average (EMA) at $9.40 and well below the 100-day and 200-day EMAs near $10.27 and $12.88, respectively.
The 23.6% Fibonacci retracement at $9.29 (drawn from the January high to the February low) aligns roughly with the nearby ascending trendline structure, while the Relative Strength Index (RSI) on the daily chart holds around 48 and the Moving Average Convergence Divergence (MACD) histogram has slipped marginally into negative territory, hinting at fading bullish momentum within a broader bearish context.
On the topside, immediate resistance emerges at the 23.6% Fibonacci retracement at $9.29, followed by the 50-day EMA near $9.40, with further barriers at the 100-day EMA and the 38.2% Fibonacci retracement clustered just above $10.00.
On the downside, initial demand is seen at the rising trendline area around $8.97, with stronger horizontal support only appearing near $8.39, where buyers would need to step in to prevent a deeper extension of the prevailing bearish phase.
(The technical analysis of this story was written with the help of an AI tool.)

超过一百万用户依赖 FXStreet 获取实时市场数据、图表工具、专家洞见和外汇新闻。其全面的经济日历和教育网络研讨会帮助交易者保持信息领先、做出审慎决策。FXStreet 拥有约 60 人的团队,分布在巴塞罗那总部及全球各地区。
阅读更多


