
Avalanche Price Forecast: AVAX extends recovery as indicators show early bullish strength
作者 Manish Chhetri
更新: 25 Jun 2026


热门文章

Avalanche (AVAX) trades above $6.50 at the time of writing on Thursday, extending its recovery and gaining nearly 7% so far this week. The rebound is supported by improving conditions in the derivatives market despite muted institutional demand.
- Avalanche trades above $6.50 on Thursday, recovering nearly 7% so far this week.
- Improving derivatives metrics support the ongoing rebound despite subdued ETF activity.
- The technical outlook suggests further upside as momentum indicators show fading bearish strength.
Avalanche (AVAX) trades above $6.50 at the time of writing on Thursday, extending its recovery and gaining nearly 7% so far this week. The rebound is supported by improving conditions in the derivatives market despite muted institutional demand. On the technical side, improving momentum indicators suggest a potential continuation of AVAX's recovery.
Derivatives data show improving sentiment
Derivatives data for AVAX shows improving sentiment. CoinGlass funding rate for AVAX turned positive on Wednesday, reading 0.0015% on Thursday, indicating that longs are paying shorts and suggesting bullish sentiment.
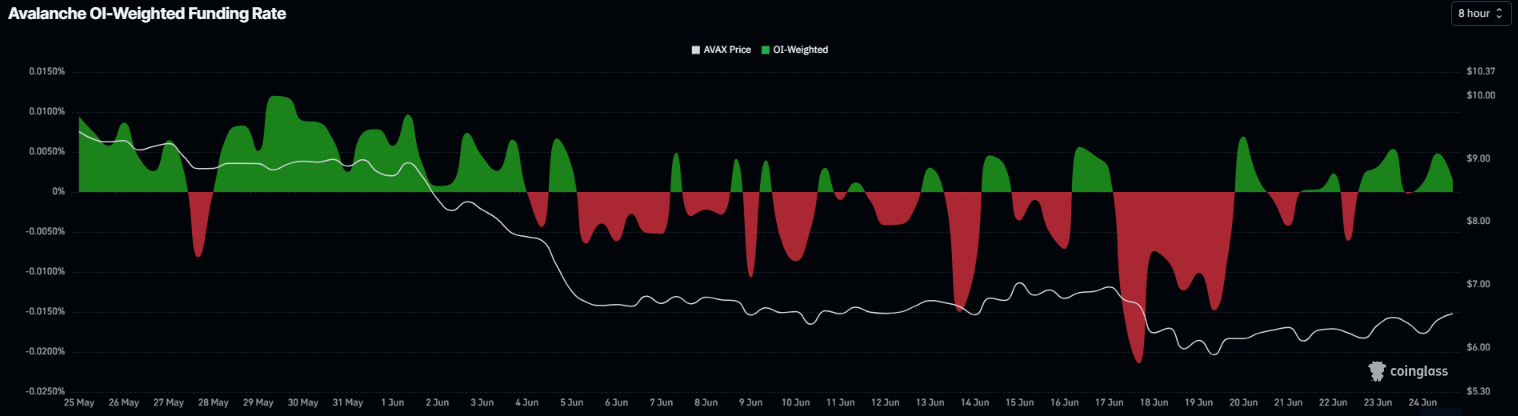
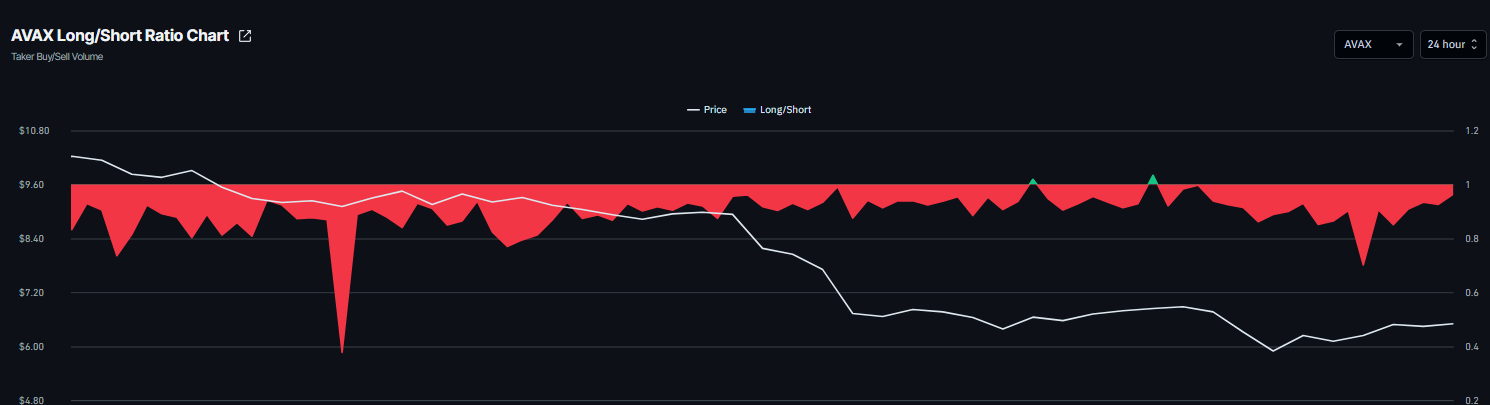
In addition, the long-to-short ratio improved to 0.97 on Thursday from 0.77 on Monday, indicating that bearish positioning has started to ease. However, the ratio remains below the bullish threshold of 1; the improvement suggests fading bearish sentiment and weakening downside pressure.
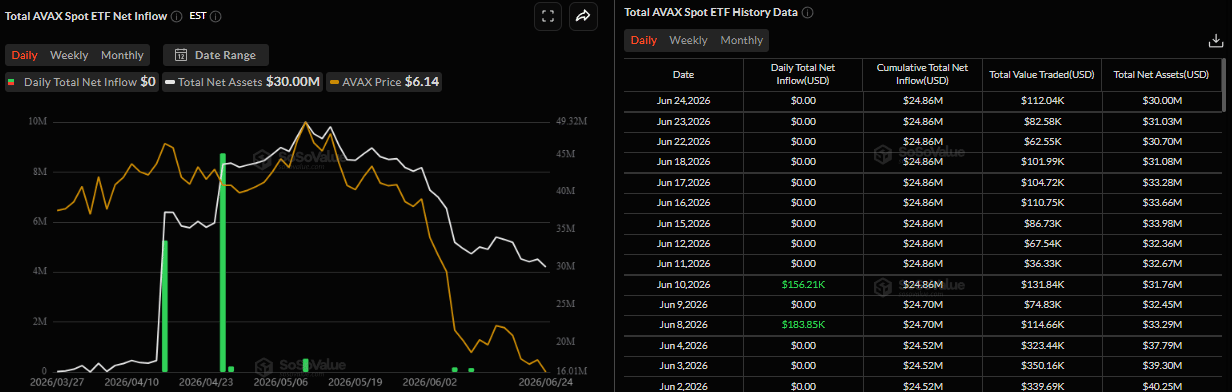
Despite improving sentiment, institutional demand remains subdued. SoSoValue data shows that AVAX’s spot Exchange-Traded Funds (ETFs) have remained largely silent since June 11, indicating a lack of meaningful institutional demand. The muted ETF demand suggests that the current recovery is mostly being driven by the derivatives traders.
Some signs of optimism
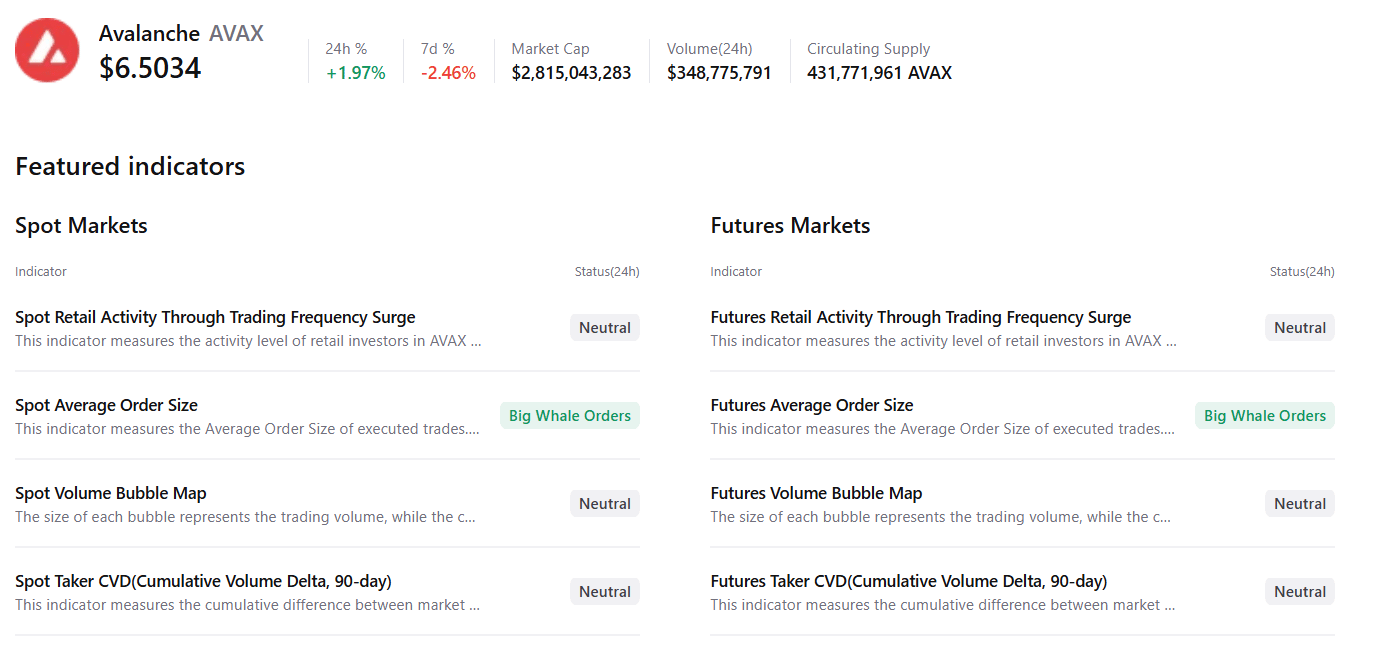
CryptoQuant’s summary data shows mild bullish sentiment. AVAX’s spot and futures markets show large whales' orders with neutral conditions in other metrics, supporting a potential recovery.
Avalanche Price Forecast: Momentum indicators show fading bearish strength
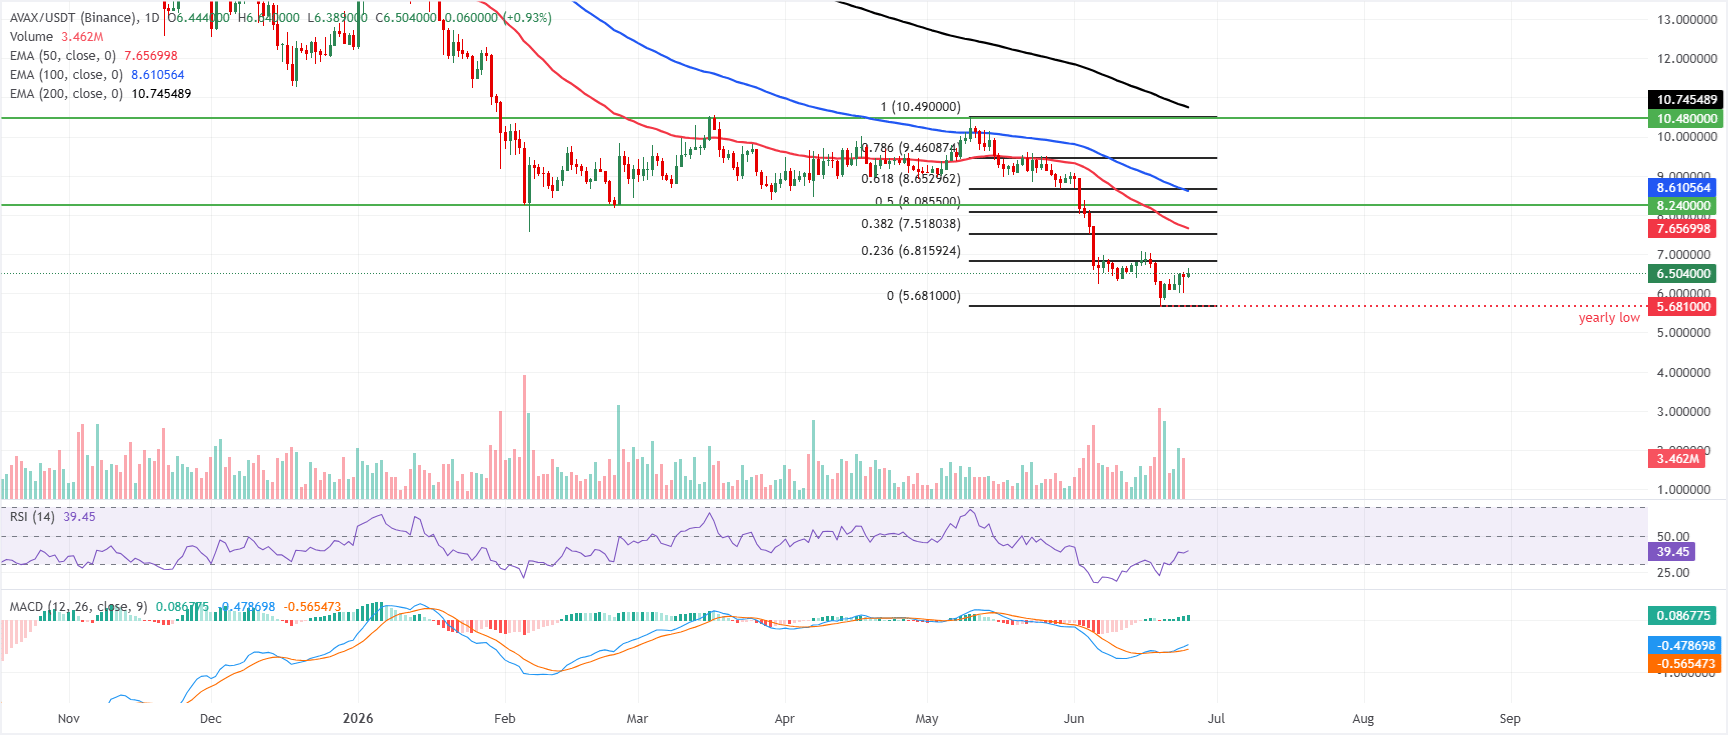
Avalanche price trades at $6.54 on Thursday, extending its recovery nearly 7% so far this week. However, AVAX maintains a bearish bias as price remains well below the 50-day, 100-day, and 200-day Exponential Moving Averages (EMAs) at $7.65, $8.61, and $10.74, respectively.
The Moving Average Convergence Divergence (MACD) has crossed into positive territory, and its histogram is expanding, hinting at improving short-term momentum. However, this has yet to challenge the dominant overhead structure, and the Relative Strength Index (RSI) at about 40 still reflects only a modest recovery from oversold conditions.
On the topside, initial resistance is aligned at the 23.6% Fibonacci retracement of the latest swing at $6.82, with the 38.2% Fibonacci retracement level at $7.52 and the 50-day EMA at $7.65 forming the next cap. Above that, the 50% retracement at $8.09, the horizontal barrier at $8.24, and the 100-day EMA clustered with the 61.8% retracement around $8.61–$8.65 create a dense supply zone ahead of $9.46 and the broader ceiling near $10.48–$10.75.
On the downside, the only nearby structural support emerges at the yearly low at $5.68, where buyers would be expected to defend the current bearish leg if selling pressure resumes.
(The technical analysis of this story was written with the help of an AI tool.)

超过一百万用户依赖 FXStreet 获取实时市场数据、图表工具、专家洞见和外汇新闻。其全面的经济日历和教育网络研讨会帮助交易者保持信息领先、做出审慎决策。FXStreet 拥有约 60 人的团队,分布在巴塞罗那总部及全球各地区。
阅读更多


