
Bitcoin Price Forecast: BTC cautiously recovers as new Trump deadline on Iran looms
作者 Manish Chhetri
更新: 6 Apr 2026


热门文章

Bitcoin (BTC) extends its gains, trading above $69,000 at the time of writing on Monday, after staging a rebound last week. Market sentiment turns slightly risk-on as news emerged that Washington and Tehran are reportedly discussing a deal to end hostilities by Monday.
- Bitcoin price extends its recovery above $69,000 on Monday, following a rebound of over 4.5% the previous week.
- Market sentiment stays fragile as US President Donald Trump threatens to destroy Iran’s civilian infrastructure if the Strait of Hormuz is not open by Tuesday.
- Washington and Tehran are reportedly discussing a deal that would involve plans to end hostilities by Monday.
Bitcoin (BTC) extends its gains, trading above $69,000 at the time of writing on Monday, after staging a rebound last week. Market sentiment turns slightly risk-on as news emerged that Washington and Tehran are reportedly discussing a deal to end hostilities by Monday.
A possible deal boosts risk sentiment
Bitcoin started the week on a positive but cautious note, as news on Monday confirmed that Iran has received the US ceasefire proposal through Pakistan and that it is being reviewed, according to a Senior Iranian official, Reuters reports. However, Tehran has clarified that it will not accept any proposal under pressure or under a deadline.
These recent developments boosted mild risk sentiment, with US equities and Bitcoin extending their recovery from the previous week.
Traders should still be cautious, as earlier, US President Donald Trump extended the “48-hour deadline” to 82 hours for Iran. Trump threatened to destroy Iran’s civilian infrastructure, including power plants and bridges, if the Strait of Hormuz is not open by Tuesday at 08:00 PM Eastern time.
Still, short-term sentiment appears constructive, supported by ongoing discussions around a potential deal to end hostilities. However, any negative developments between the US and Iran could dampen risk appetite and weigh on Bitcoin’s price, as geopolitical uncertainty continues to drive broader market direction.
Muted institutional demand
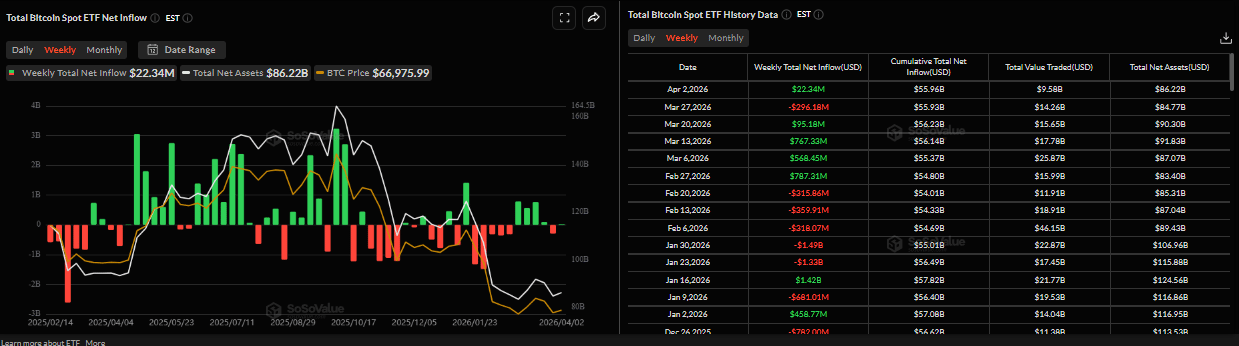
Institutional demand for Bitcoin remained muted last week. SoSoValue data show that Bitcoin spot Exchange Traded Funds (ETFs) recorded a mild inflow of $22.34 million last week. This highlights indecisiveness among institutional investors, who are unwilling to increase exposure to BTC amid prevailing market uncertainty.
Some signs of concern
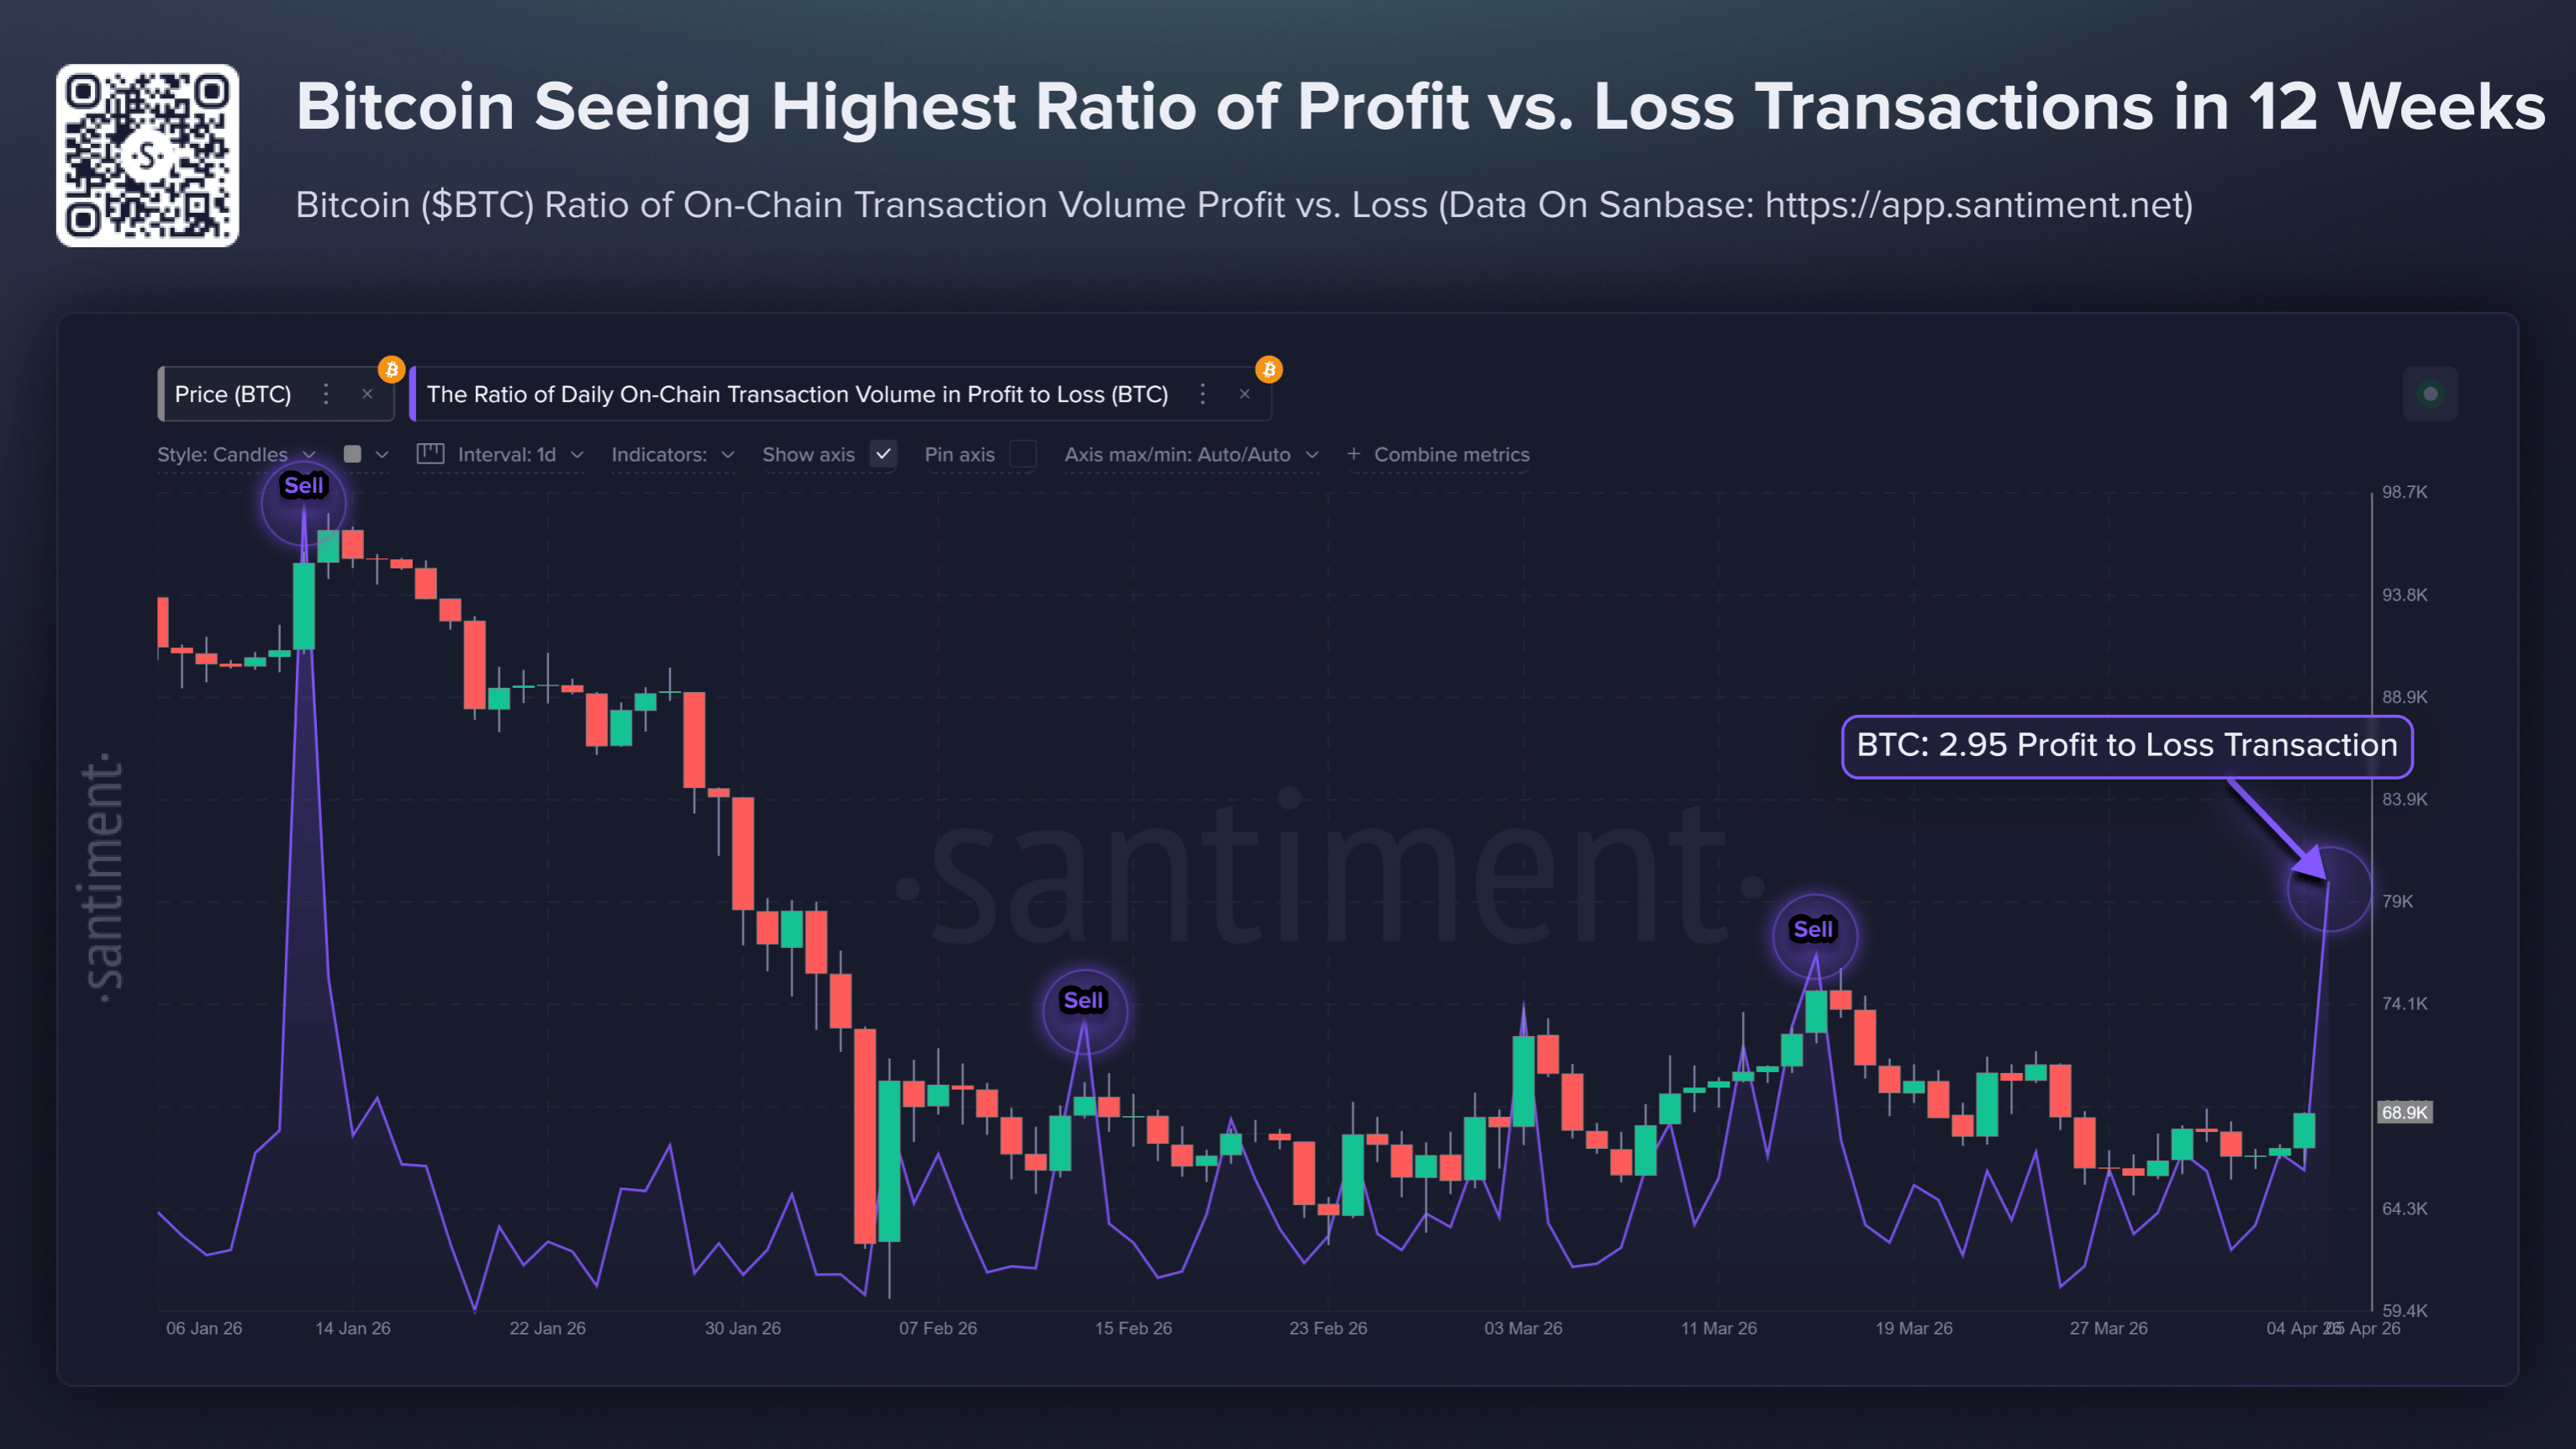
Santiment data shows that Bitcoin has recorded the highest ratio of profit-to-loss transactions in 12 weeks, as shown in the chart below. The ratio read 2.95 transactions on Sunday, with coins in profit (at the time of being obtained and then moved) for every 1.00 transaction with coins at a loss. Historically, this has been a short-term price top signal, as seen on March 16 and February 14. Generally, high profit leads to a decline in an asset’s price, while a loss transaction outpacing profit transactions can be a reliable buy signal.
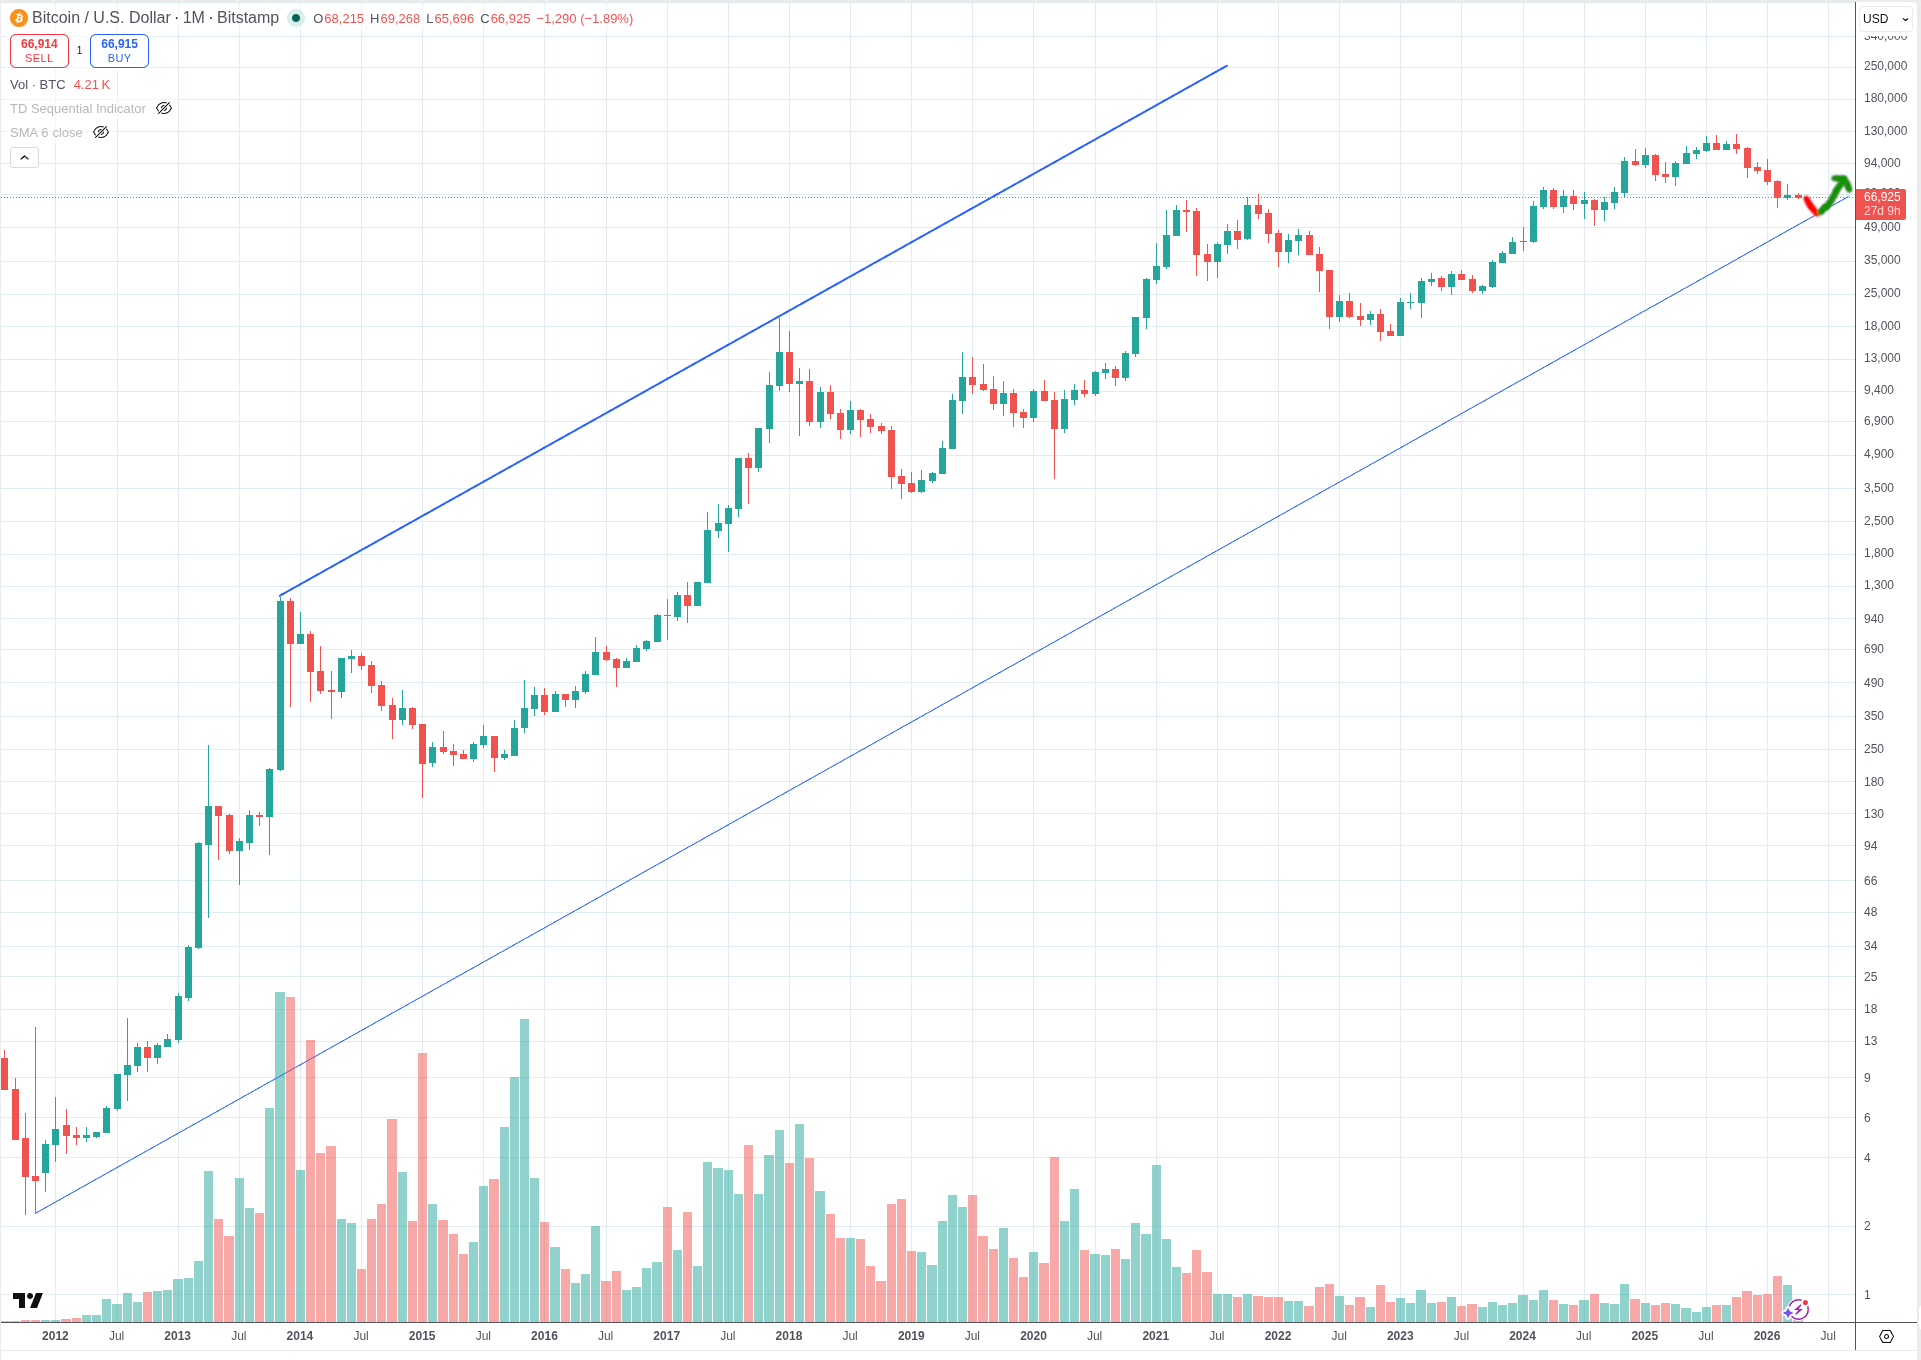
Kamal Mokeddem, General Managing Partner at Finality, shared a chart and told FXStreet, in an exclusive interview,“As equity markets sell off, I’m making a specific, time-stamped call: BTC has one more move down to around $50,000 in May, coinciding with a peak in VIX, and the long term parallel channel formed by the 2013 and 2017 peaks on the top and the 2011 low and soon to be formed 2026 low, after which crypto, which I see as leading risk markets, should bottom out. I also see the S&P correcting to 5,500 within six months, either coinciding with the S&P low or leading it by up to a few months.”
Bitcoin Price Forecast: BTC breaking above the midpoint of the channel
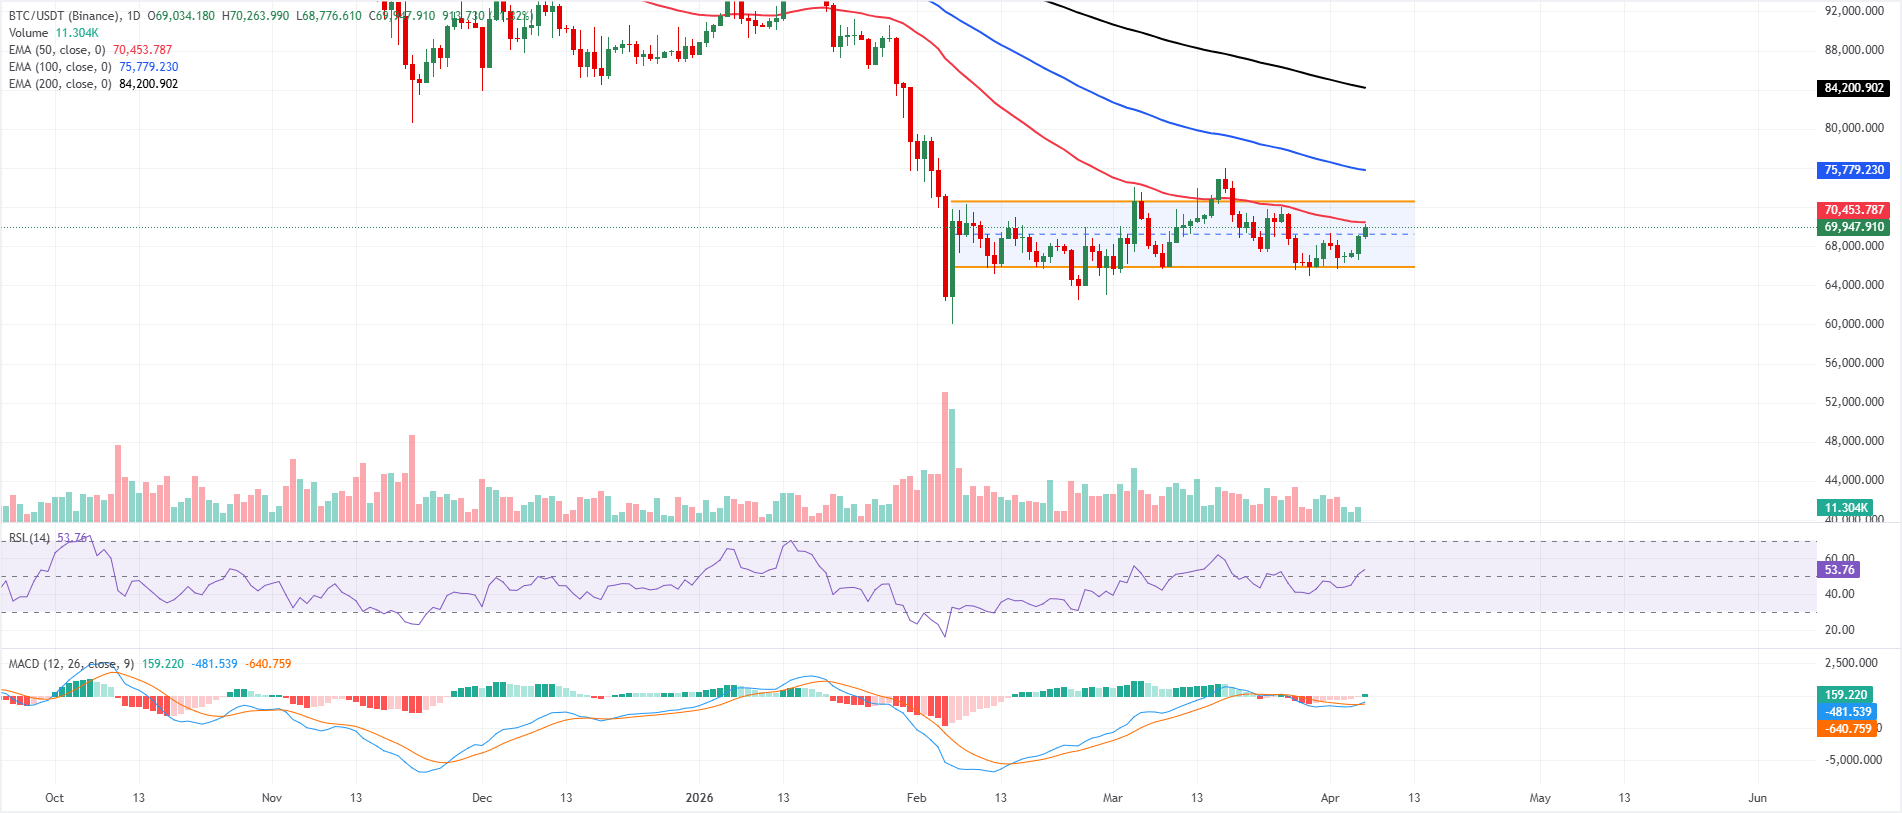
Bitcoin price is trading above $69,900 on Monday, breaking above the midpoint of the consolidation channel near $69,300. BTC rebounds from the lower boundary of a parallel channel spanning roughly $65,900- $72,600, suggesting mildly bullish conditions. However, the Crypto King holds below the clustered 50-day, 100-day and 200-day Exponential Moving Averages, which continue to cap the broader trend context despite the latest bounce.
The Relative Strength Index (RSI) on the daily chart at 53 edges back above the midline, signaling recovering momentum but not yet a decisive shift in trend. The Moving Average Convergence Divergence (MACD) indicator on the same chart has crossed above its signal line, turning higher toward the zero line, with a positive histogram that hints at fading bearish pressure within the channel.
Initial resistance lines up near $70,500, at the 50-day EMA at $70,453, and the channel top near $72,600. A daily close above that upper boundary would weaken the current bearish configuration and open the way toward the 100-day EMA near $75,800.
On the downside, immediate support lies around $68,800, ahead of the recent low and channel floor near $66,000, which remains the key bearish continuation level. A break back below $66,000 would reinstate stronger selling pressure and expose the next support band closer to $64,000.
(The technical analysis of this story was written with the help of an AI tool.)
Bitcoin, altcoins, stablecoins FAQs
Bitcoin is the largest cryptocurrency by market capitalization, a virtual currency designed to serve as money. This form of payment cannot be controlled by any one person, group, or entity, which eliminates the need for third-party participation during financial transactions.
Altcoins are any cryptocurrency apart from Bitcoin, but some also regard Ethereum as a non-altcoin because it is from these two cryptocurrencies that forking happens. If this is true, then Litecoin is the first altcoin, forked from the Bitcoin protocol and, therefore, an “improved” version of it.
Stablecoins are cryptocurrencies designed to have a stable price, with their value backed by a reserve of the asset it represents. To achieve this, the value of any one stablecoin is pegged to a commodity or financial instrument, such as the US Dollar (USD), with its supply regulated by an algorithm or demand. The main goal of stablecoins is to provide an on/off-ramp for investors willing to trade and invest in cryptocurrencies. Stablecoins also allow investors to store value since cryptocurrencies, in general, are subject to volatility.
Bitcoin dominance is the ratio of Bitcoin's market capitalization to the total market capitalization of all cryptocurrencies combined. It provides a clear picture of Bitcoin’s interest among investors. A high BTC dominance typically happens before and during a bull run, in which investors resort to investing in relatively stable and high market capitalization cryptocurrency like Bitcoin. A drop in BTC dominance usually means that investors are moving their capital and/or profits to altcoins in a quest for higher returns, which usually triggers an explosion of altcoin rallies.

超过一百万用户依赖 FXStreet 获取实时市场数据、图表工具、专家洞见和外汇新闻。其全面的经济日历和教育网络研讨会帮助交易者保持信息领先、做出审慎决策。FXStreet 拥有约 60 人的团队,分布在巴塞罗那总部及全球各地区。
阅读更多


