
Bitcoin Price Forecast: BTC slips below $67,000 as risk-aversion grows amid escalating US-Iran war
作者 Manish Chhetri
发布日期: 3 Mar 2026 | 修改日期: 3 Mar 2026


热门文章

Bitcoin (BTC) is trading below $67,000 at the time of writing on Tuesday, losing most of the gains from the slight rebound seen the previous day.
- Bitcoin price slides 3% on Tuesday, nearly erasing the previous day's rebound.
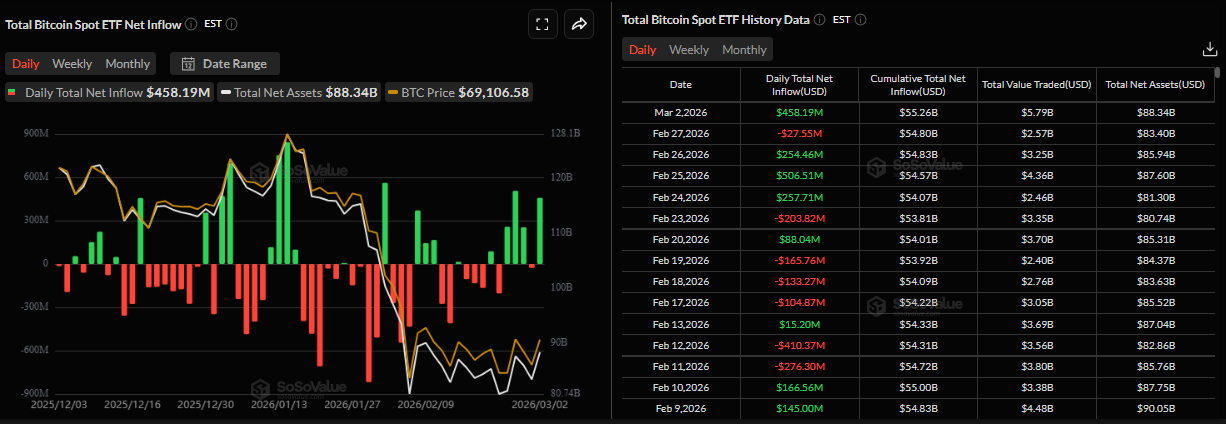
- US-listed spot ETFs recorded an inflow of more than $450 million while Strategy added 3,015 BTC on Monday.
- Traders should be cautious as a prolonged US-Iran war could further dampen risk sentiment.
Bitcoin (BTC) is trading below $67,000 at the time of writing on Tuesday, losing most of the gains from the slight rebound seen the previous day. Institutional and corporate demand show mild signs of strength, as spot Exchange Traded Funds (ETFs) recorded inflows of over $450 million, while Strategy (MSTR) added 3,015 BTC to its reserve on Monday. Still, traders should keep a watchful eye on the war between the US and Iran, which could further dampen risk appetite and weigh on the Crypto King.
US-Iran war continues to weigh on risk sentiment
The broader risk-off sentiment remains well alive by the ongoing US-Iran war, which continues to weigh on risky assets such as BTC..
US Secretary of State Marco Rubio stated that the US is preparing for a major escalation in attacks on Iran over the next 24 hours. This comes after US President Donald Trump said that a big wave is yet to come, underscoring the risk of a prolonged war. Moreover, the State Department urged US citizens to depart immediately from countries in the Middle East due to serious safety risks.
Institutional demand supports BTC
Institutional demand for Bitcoin started the week on a positive note. The SoSoValue data shows that spot Bitcoin ETFs recorded inflows of $458.19 million on Monday, following a positive weekly inflow last week. If these inflows continue and intensify, BTC could see a recovery in the upcoming days.
On the corporate front, Michael Saylor announced on X on Monday that Strategy had purchased another 3,015 BTC, following its purchase of 592 BTC the previous week. Monday’s purchase brings the firm’s total holdings to 720,737 BTC, highlighting its continued aggressive accumulation strategy. Strategy’s average purchase price of all its holdings stands at $75,985, above current market prices.
No signs of panic among BTC traders
Blockware Intelligence’s report on Tuesday noted that, as conflict between the US and Iran escalated, BTC sold off as expected. However, the sell-off was relatively weak ($65K to $63K) over the weekend, followed by a swift rebound on Monday.
“People still holding BTC after a 50% drop from the high are conviced long-term holders (...) Since supply is beginning to constrict, while it may take a little while before these results in higher prices, it’s a sign of market recovery,” says Blockware Intelligence’s analyst.
In addition, as explained in the previous Bitcoin Forecast report, options data show that, despite rising geopolitical tensions, some traders used Saturday’s volatility to position for a potential rebound in March after five consecutive months of price declines.
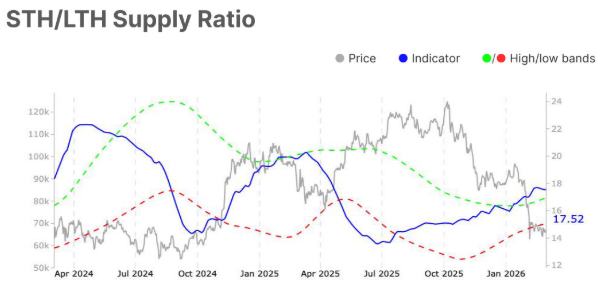
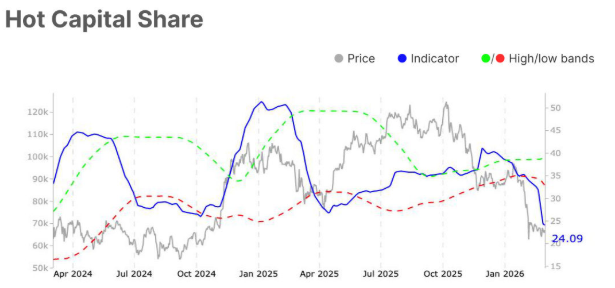
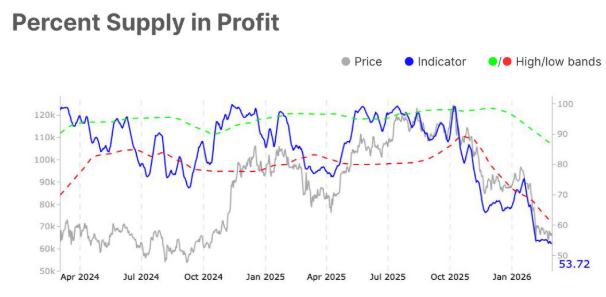
Looking at the Glassnode chart below, positioning metrics reinforce a balanced yet cautious structure. The short-term-to-long-term holders supply ratio remains slightly elevated at 17.52 on Monday. At the same time, the hot capital share falls to 24.09, and the percent supply in profit remains near the lower end of its historical range at 53.72. Collectively, these metrics point to a market transitioning from distribution pressure toward stabilisation, but without clear confirmation of sustained bullish expansion.
“Overall, the backdrop reflects early-stage recovery dynamics within a still fragile environment. Momentum and activity are improving, yet conviction remains muted across derivatives, options, and capital flow metrics,” concludes a Glassnode analyst.
Bitcoin Price Forecast: BTC shows mild bearish signs
The near-term bias for Bitcoin is mildly bearish as price holds inside a parallel channel, oscillating closer to the mid-to-lower half of the structure. BTC trades just below the 50-period Exponential Moving Average (EMA) on the 4-hour chart and near the 100-period EMA, signaling a loss of upside momentum rather than a clear trend reversal.
The Relative Strength Index (RSI) on the 4-hour chart slipped back toward the mid-40s after failing to extend its recent push above 60, indicating fading bullish pressure. The Moving Average Convergence Divergence (MACD) line has rolled over from recent positive readings and contracts toward the signal line, reinforcing a softer tone after the recent rebound.
Initial resistance is near the 50-period EMA at around $66,900, with stronger resistance at the channel top at around $72,000. A sustained break above that upper boundary would neutralize the bearish channel and open the way toward fresh highs.
On the downside, immediate support emerges near the channel base at $65,100, ahead of the more distant horizontal support at $60,000. A drop through $65,100 would expose the lower part of the broader range and increase the risk of a deeper slide toward the $60,000 area.
(The technical analysis of this story was written with the help of an AI tool.)
Bitcoin, altcoins, stablecoins FAQs
Bitcoin is the largest cryptocurrency by market capitalization, a virtual currency designed to serve as money. This form of payment cannot be controlled by any one person, group, or entity, which eliminates the need for third-party participation during financial transactions.
Altcoins are any cryptocurrency apart from Bitcoin, but some also regard Ethereum as a non-altcoin because it is from these two cryptocurrencies that forking happens. If this is true, then Litecoin is the first altcoin, forked from the Bitcoin protocol and, therefore, an “improved” version of it.
Stablecoins are cryptocurrencies designed to have a stable price, with their value backed by a reserve of the asset it represents. To achieve this, the value of any one stablecoin is pegged to a commodity or financial instrument, such as the US Dollar (USD), with its supply regulated by an algorithm or demand. The main goal of stablecoins is to provide an on/off-ramp for investors willing to trade and invest in cryptocurrencies. Stablecoins also allow investors to store value since cryptocurrencies, in general, are subject to volatility.
Bitcoin dominance is the ratio of Bitcoin's market capitalization to the total market capitalization of all cryptocurrencies combined. It provides a clear picture of Bitcoin’s interest among investors. A high BTC dominance typically happens before and during a bull run, in which investors resort to investing in relatively stable and high market capitalization cryptocurrency like Bitcoin. A drop in BTC dominance usually means that investors are moving their capital and/or profits to altcoins in a quest for higher returns, which usually triggers an explosion of altcoin rallies.

超过一百万用户依赖 FXStreet 获取实时市场数据、图表工具、专家洞见和外汇新闻。其全面的经济日历和教育网络研讨会帮助交易者保持信息领先、做出审慎决策。FXStreet 拥有约 60 人的团队,分布在巴塞罗那总部及全球各地区。
阅读更多


