
Bitcoin Price Forecast: BTC takes a breather above $65,000 amid swelling institutional pressure
- Bitcoin hovers above $67,000 as of Wednesday, taking a breather after over 6% loss the previous day.
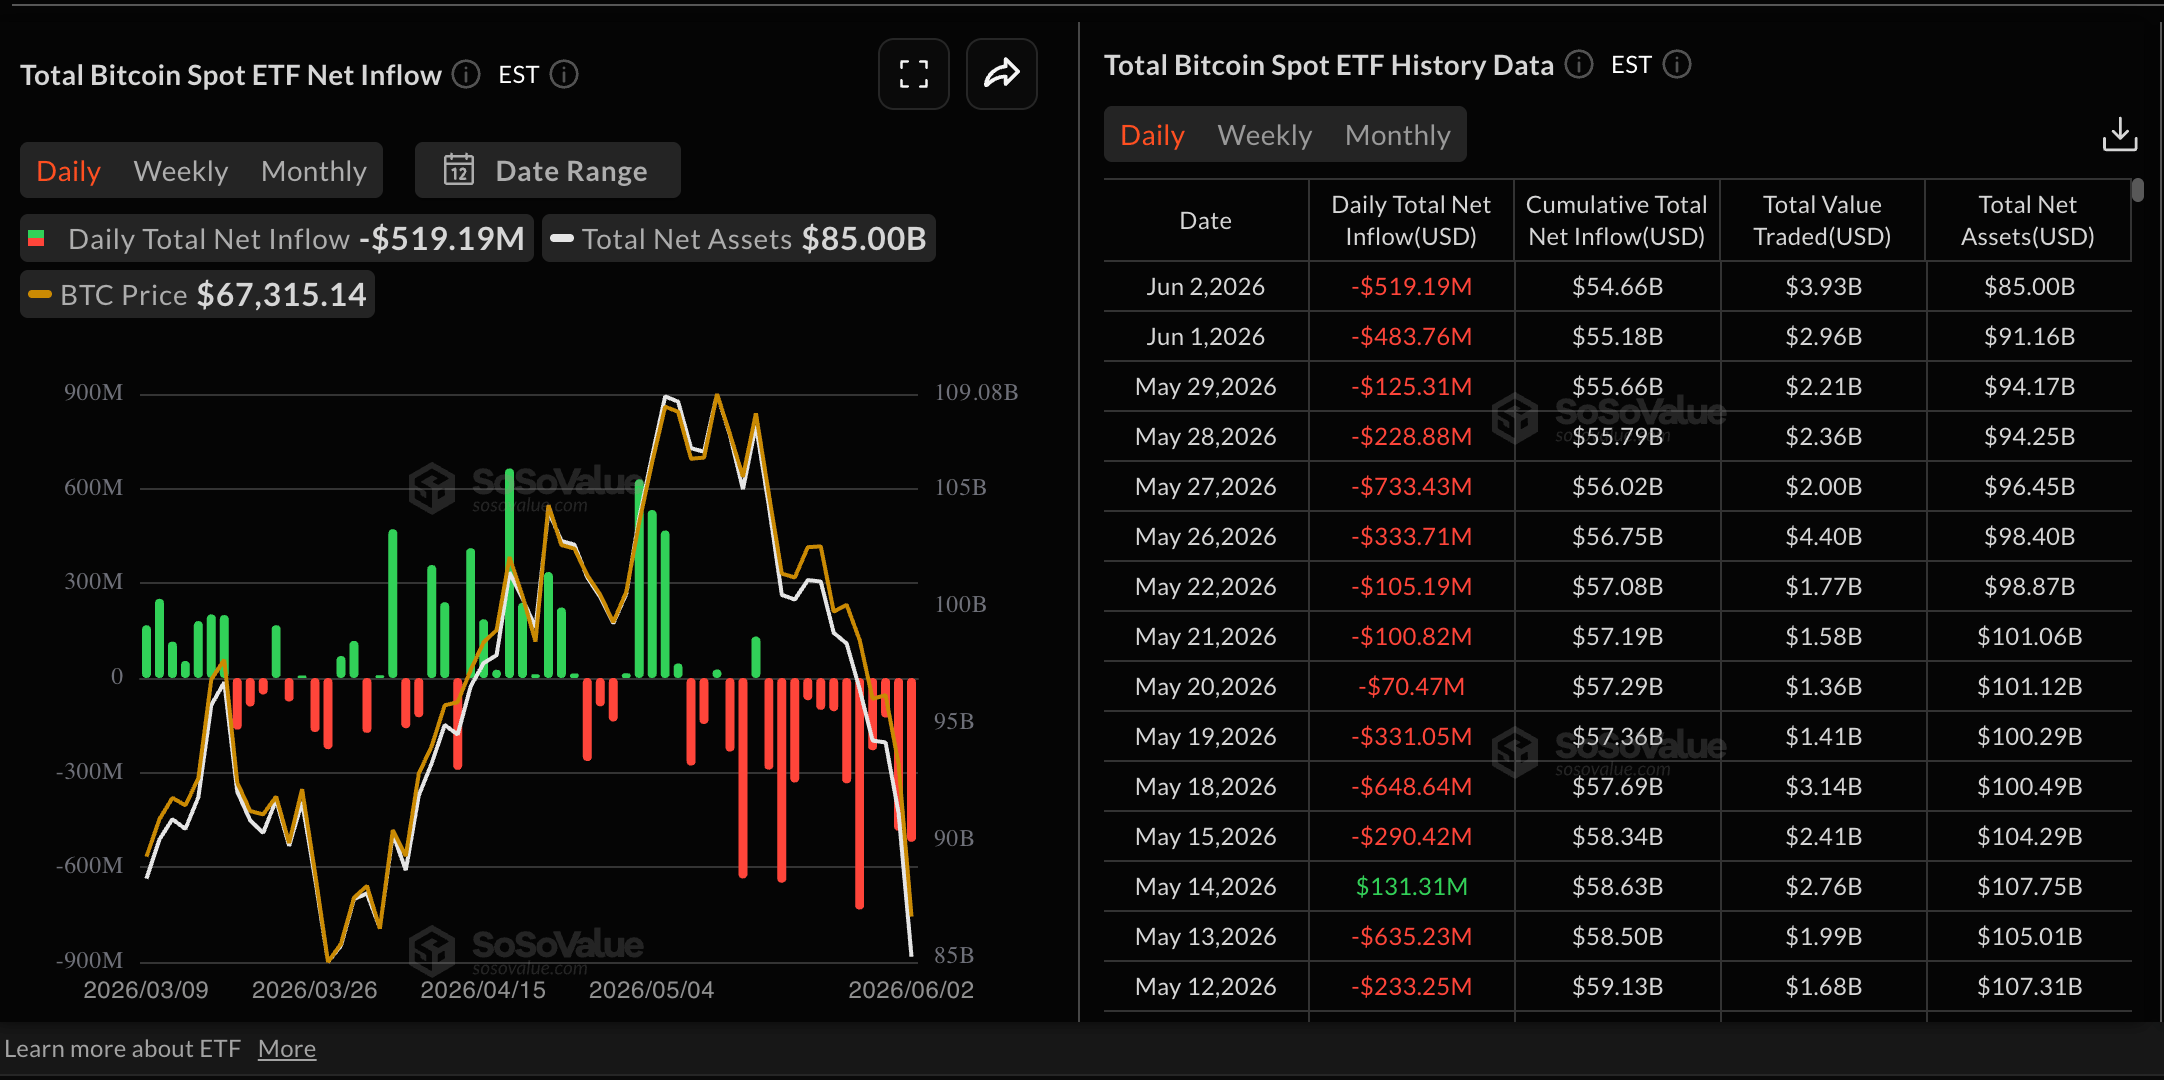
- Whales are reducing their BTC holdings, likely influenced by the 12-day streak of ETF outflows.
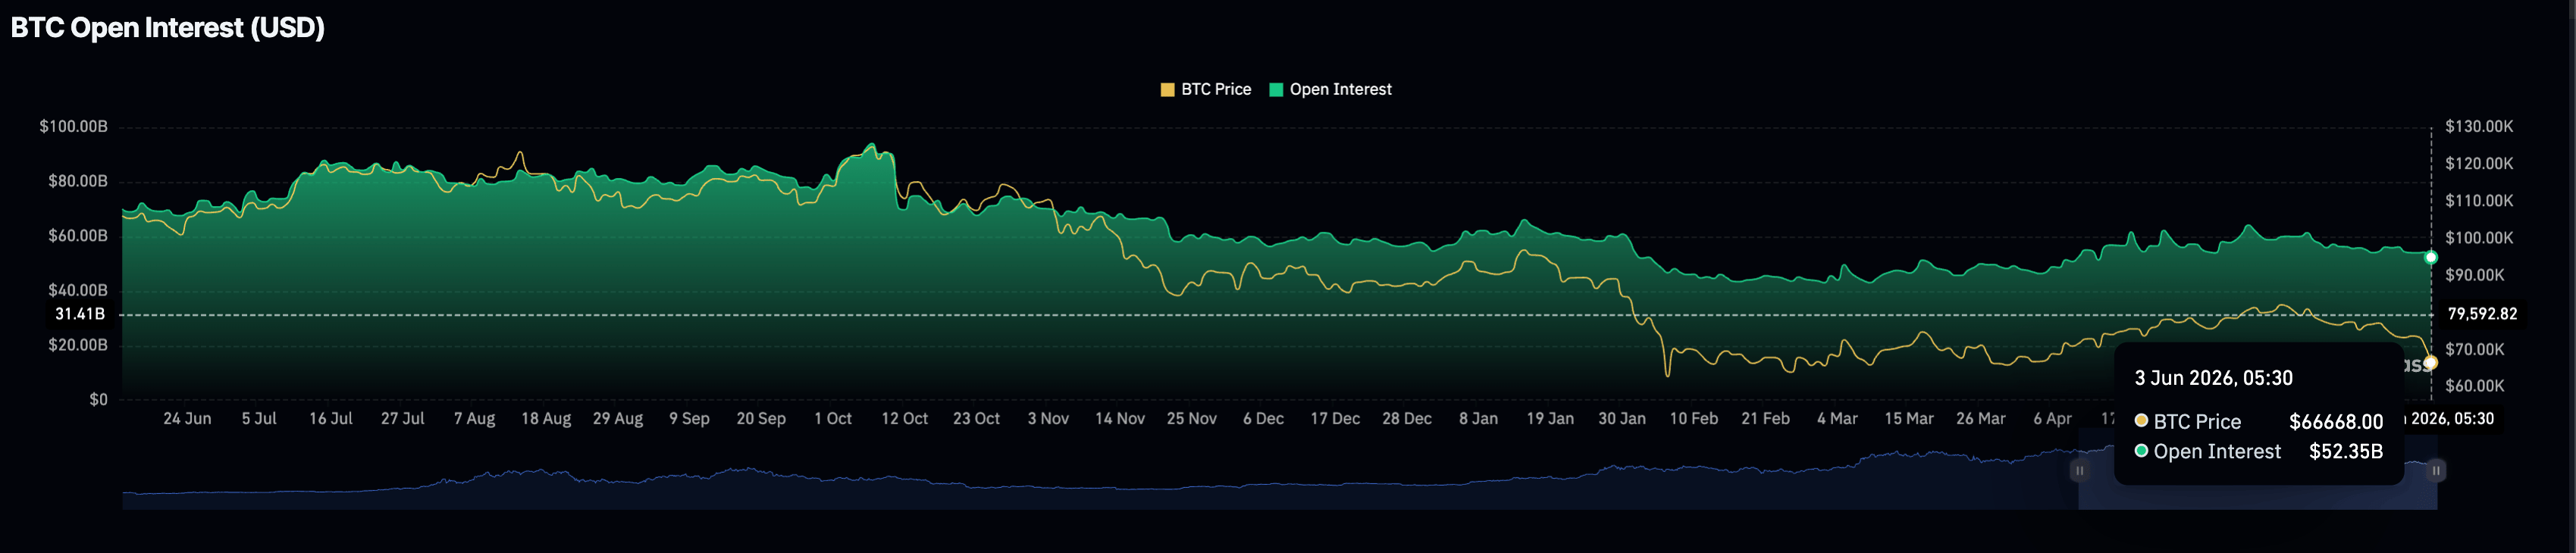
- Declining trend in Bitcoin futures Open Interest suggests waning retail demand.
Bitcoin (BTC) price hovers above $67,000 at press time on Wednesday, signaling a mild recovery after reaching a two-month low of $65,426 earlier on the day. Investor confidence is declining as large-wallet investors, commonly referred to as whales, reduce their Bitcoin holdings, while BTC futures Open Interest dips. Bitcoin should hold above $65,000 to avoid a steeper correction toward $60,000.

Bitcoin whales join the selling side amid declining retail and institutional demand
Bitcoin has dropped below $70,000, posting roughly a 20% loss over the last four weeks. The ongoing streak of $3.97 billion in ETF outflows over the last 12 consecutive days, as previously reported by FXStreet, is mounting pressure on the BTC price and, in turn, the large-wallet investors.
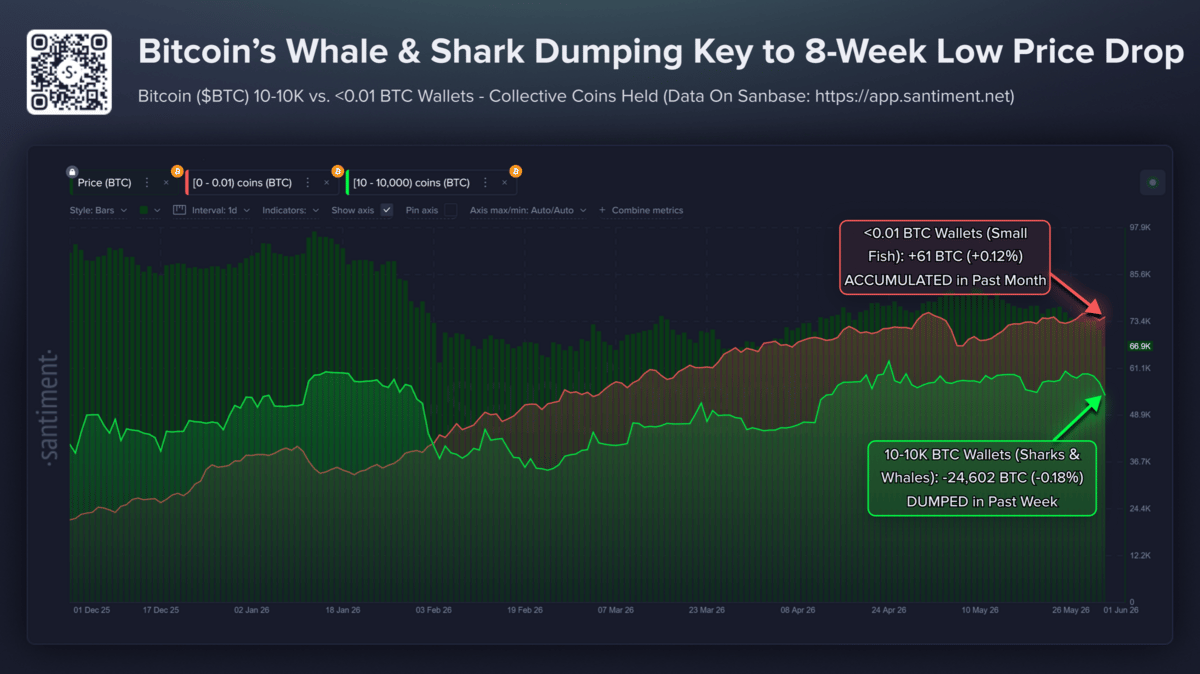
On-chain data show that Bitcoin whales and sharks, entities that hold 10 to 10,000 BTC, have offloaded 24,602 BTC, reducing their holdings by 0.18% over the last week. A reversal or slowdown in whale-linked selling activity could signal a bottom formation.
Typically, an offloading move by whales is absorbed by minority holders. However, for Bitcoin, wallets with less than 0.1 BTC have acquired only 61 coins, growing their holding by 0.12% over the same period.
On the derivatives side, the BTC Open Interest (OI) is down to $52.35 billion from $54.24 billion on Tuesday, reflecting a steady decline in positional buildup and weakening retail confidence, while price hangs in balance above $65,000.
Technical outlook: Bitcoin attempts to take support on thin ice
Bitcoin holds above $67,000 at press time on Wednesday, maintaining a bearish near-term tone, consistent with roughly a 10% loss so far this week. BTC holds well below the 50-, 100-, and 200-day Exponential Moving Averages (EMAs) at $75,333, $76,121, and $80,706, respectively, suggesting the market is still trapped in a corrective phase.
That said, the Relative Strength Index (RSI) at 23 on the daily chart hovers in oversold territory, yet the Moving Average Convergence Divergence (MACD) remains deep in negative territory, hinting that bearish momentum is dominant and not yet decisively reversing.
Looking down, the next significant support is seen around the horizontal level of $65,000, marked by the March 29 low, where buyers would likely attempt to arrest deeper losses. Still, a potential break below this zone would open the path toward the $60,000 mark last seen on February 6.
On the topside, initial resistance emerges at the fractured rising support trendline, with the break level near $71,511 now serving as a key cap.
(The technical analysis of this story was written with the help of an AI tool.)


