
Bittensor Price Forecast: TAO extends recovery despite retail demand slump
作者 John Isige
发布日期: 4 Mar 2026 | 修改日期: 4 Mar 2026


热门文章

Bittensor (TAO), a leading Artificial Intelligence (AI) token, is aging up above $190 at the time of writing on Wednesday. Steady price increases characterise the broader crypto market, with Bitcoin (BTC) holding above $71,000 and Ethereum (ETH) above $2,000.
- Bittensor rises by over 4% on Wednesday and holds above the 200 EMA on the 4-hour chart.
- TAO upholds a short-term bullish outlook supported by uptrending momentum indicators.
- Low retail demand, with futures Open Interest falling to $132 million, could limit Bittensor’s rebound.
Bittensor (TAO), a leading Artificial Intelligence (AI) token, is aging up above $190 at the time of writing on Wednesday. Steady price increases characterise the broader crypto market, with Bitcoin (BTC) holding above $71,000 and Ethereum (ETH) above $2,000.
Bittensor trades up amid low retail interest
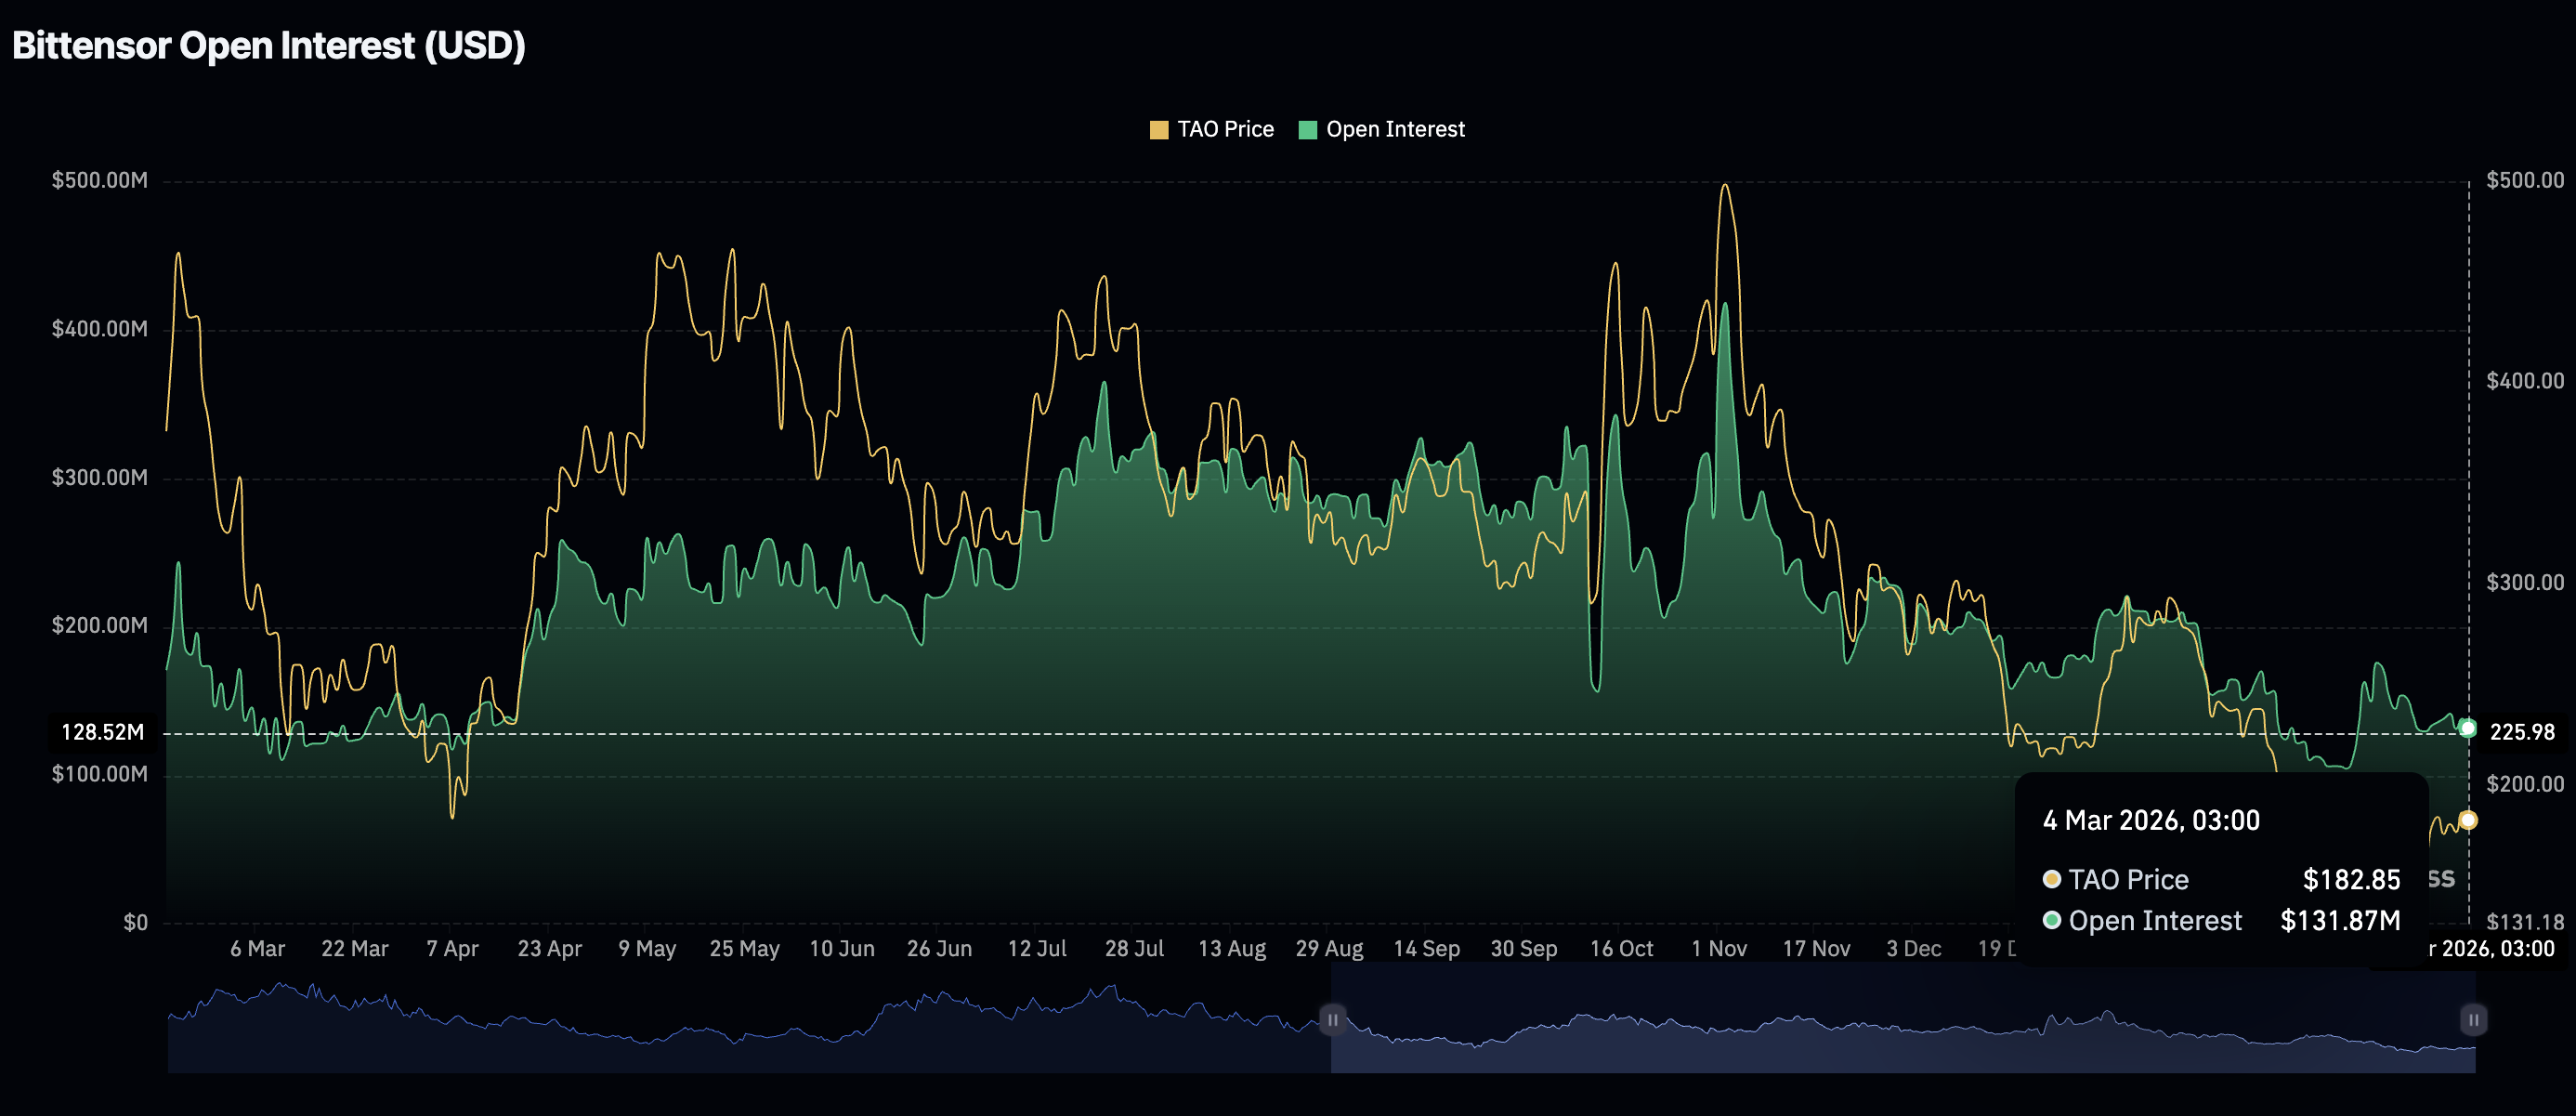
The Bittensor derivatives market has extended the downtrend, as futures Open Interest (OI) falls to $132 million on Wednesday, from $138 million the previous day. Attempts to steady the trend upward stalled, with OI peaking at $176 million in February.
Looking back, CoinGlass data show that OI hit a record $418 million in November, coinciding with TAO surging to $539. If retail remains on the sidelines, signaling that traders lack confidence in the AI token, the ongoing recovery may run out of steam, triggering a correction.
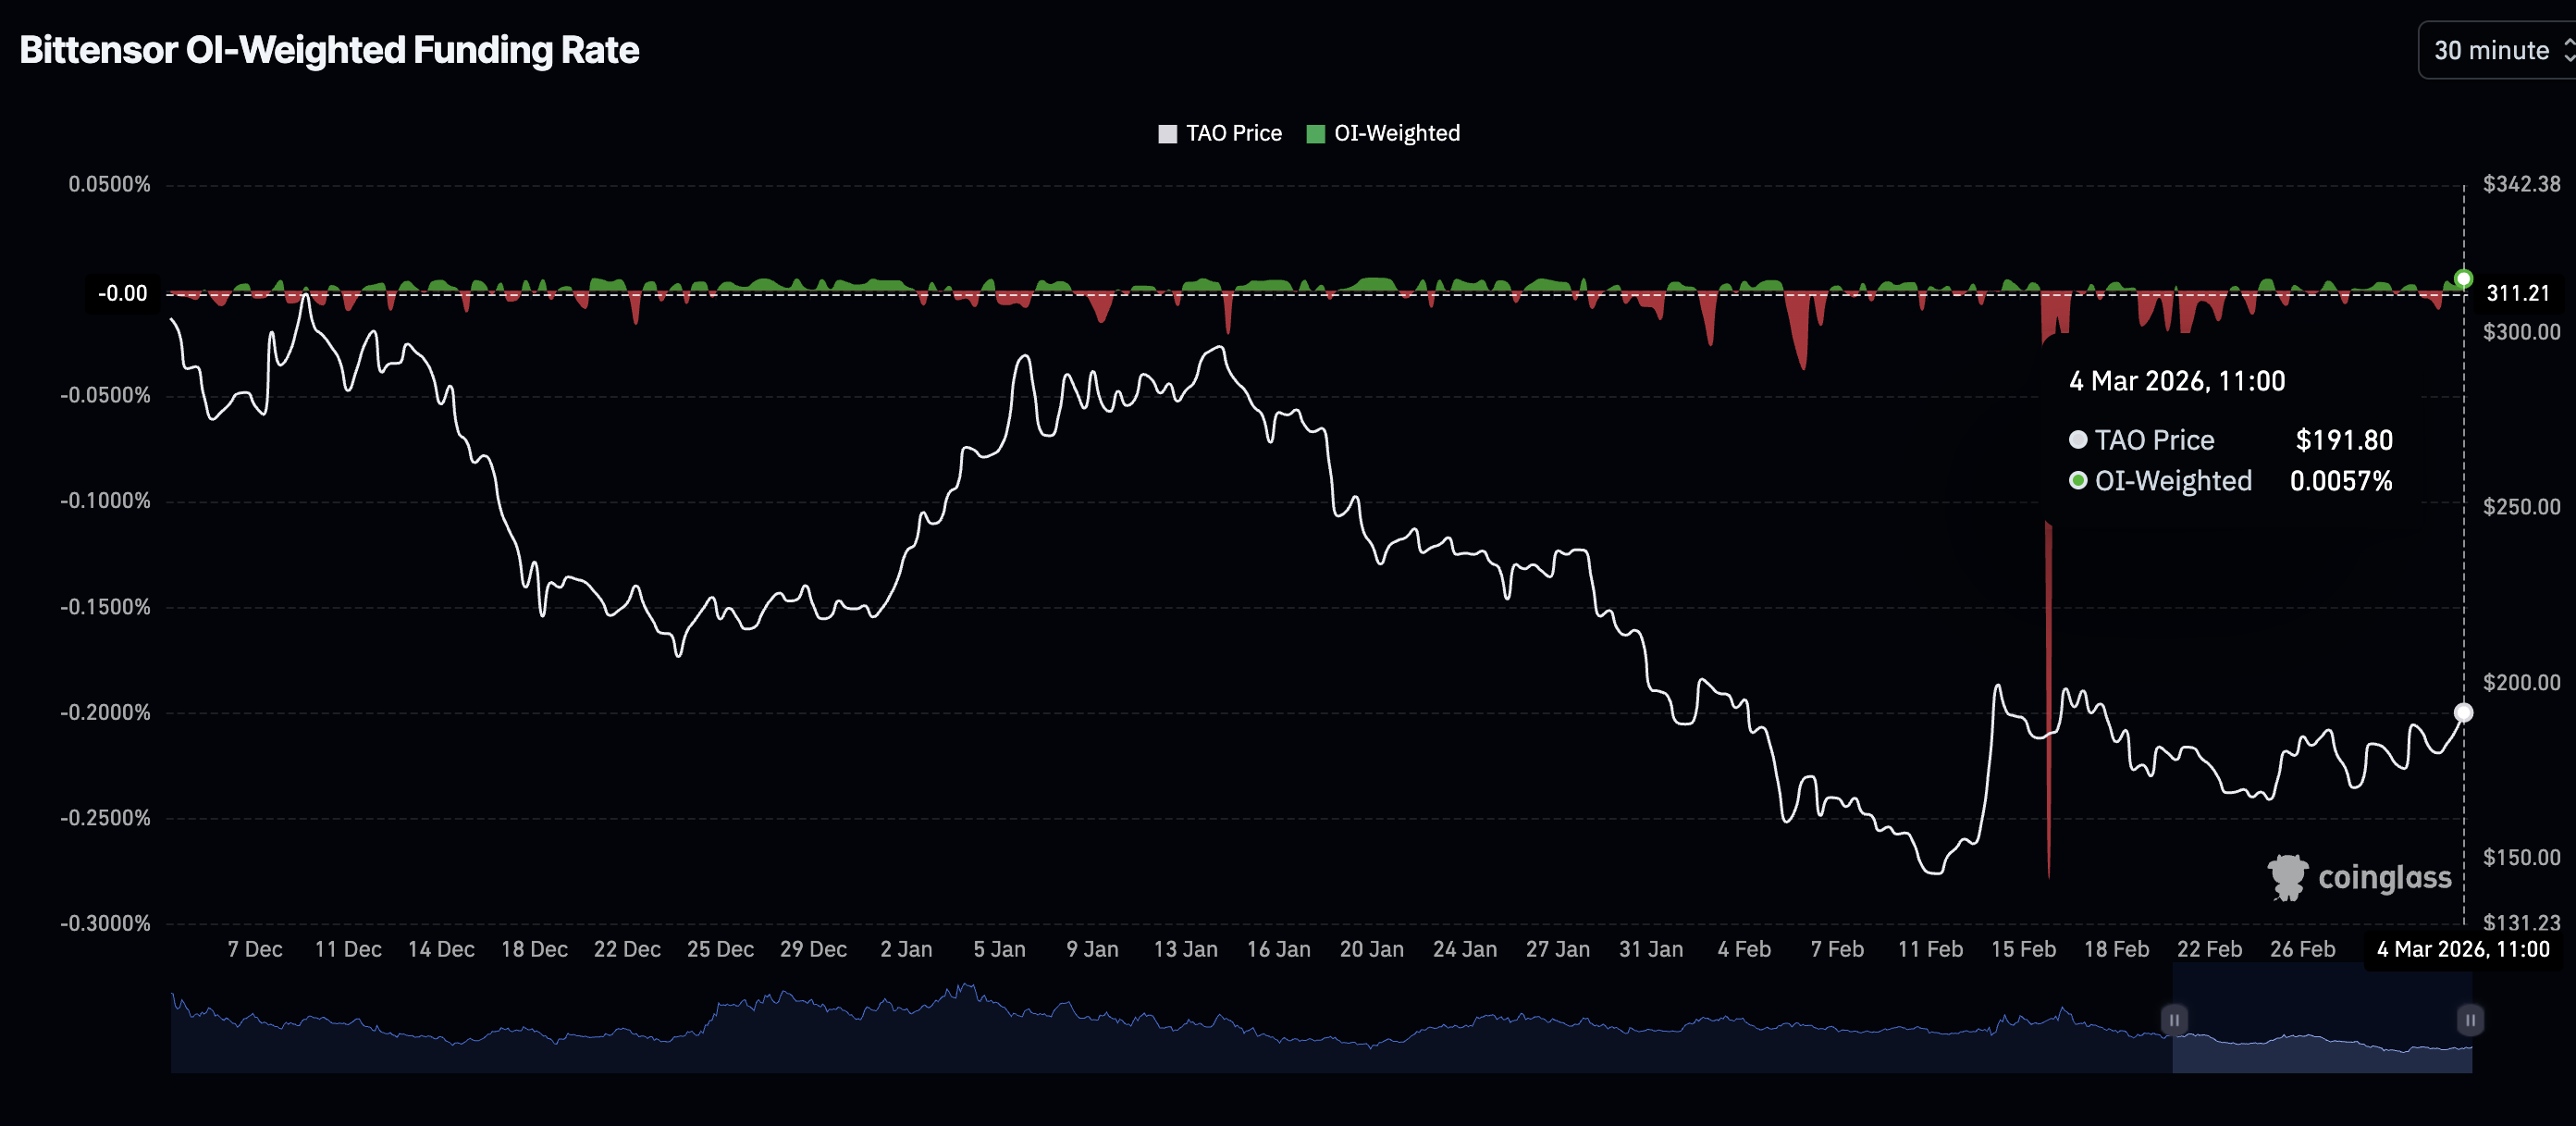
Despite the slump in futures OI, traders appear to be increasing their exposure to TAO derivatives, as evidenced by the weighted funding rate, which holds at 0.0057% on Wednesday, from 0.0048% the previous day. A steady increase in this metric would support a sustained price recovery, as more traders gain confidence in Bittensor’s short-term outlook.
Technical outlook: Bittensor tests short-term recovery strength
Bittensor is drifting higher above the 50, 100, and 200 Exponential Moving Average (EMAs) cluster between $181 and $189 on the 4-hour chart. The 200 EMA serves as immediate support as the bulls eye an extension of the recovery toward the psychological $200 threshold.
The 50 EMA appears to be crossing above the 100 EMA, which would confirm a short-term Golden Cross pattern, signaling a bullish shift.
Meanwhile, the Moving Average Convergence Divergence (MACD) remains above its signal line on the same chart, with green histogram bars expanding and supporting the bullish thesis.
An extended increase in the Relative Strength Index (RSI) from 63 toward overbought territory would reinforce the bullish tone.
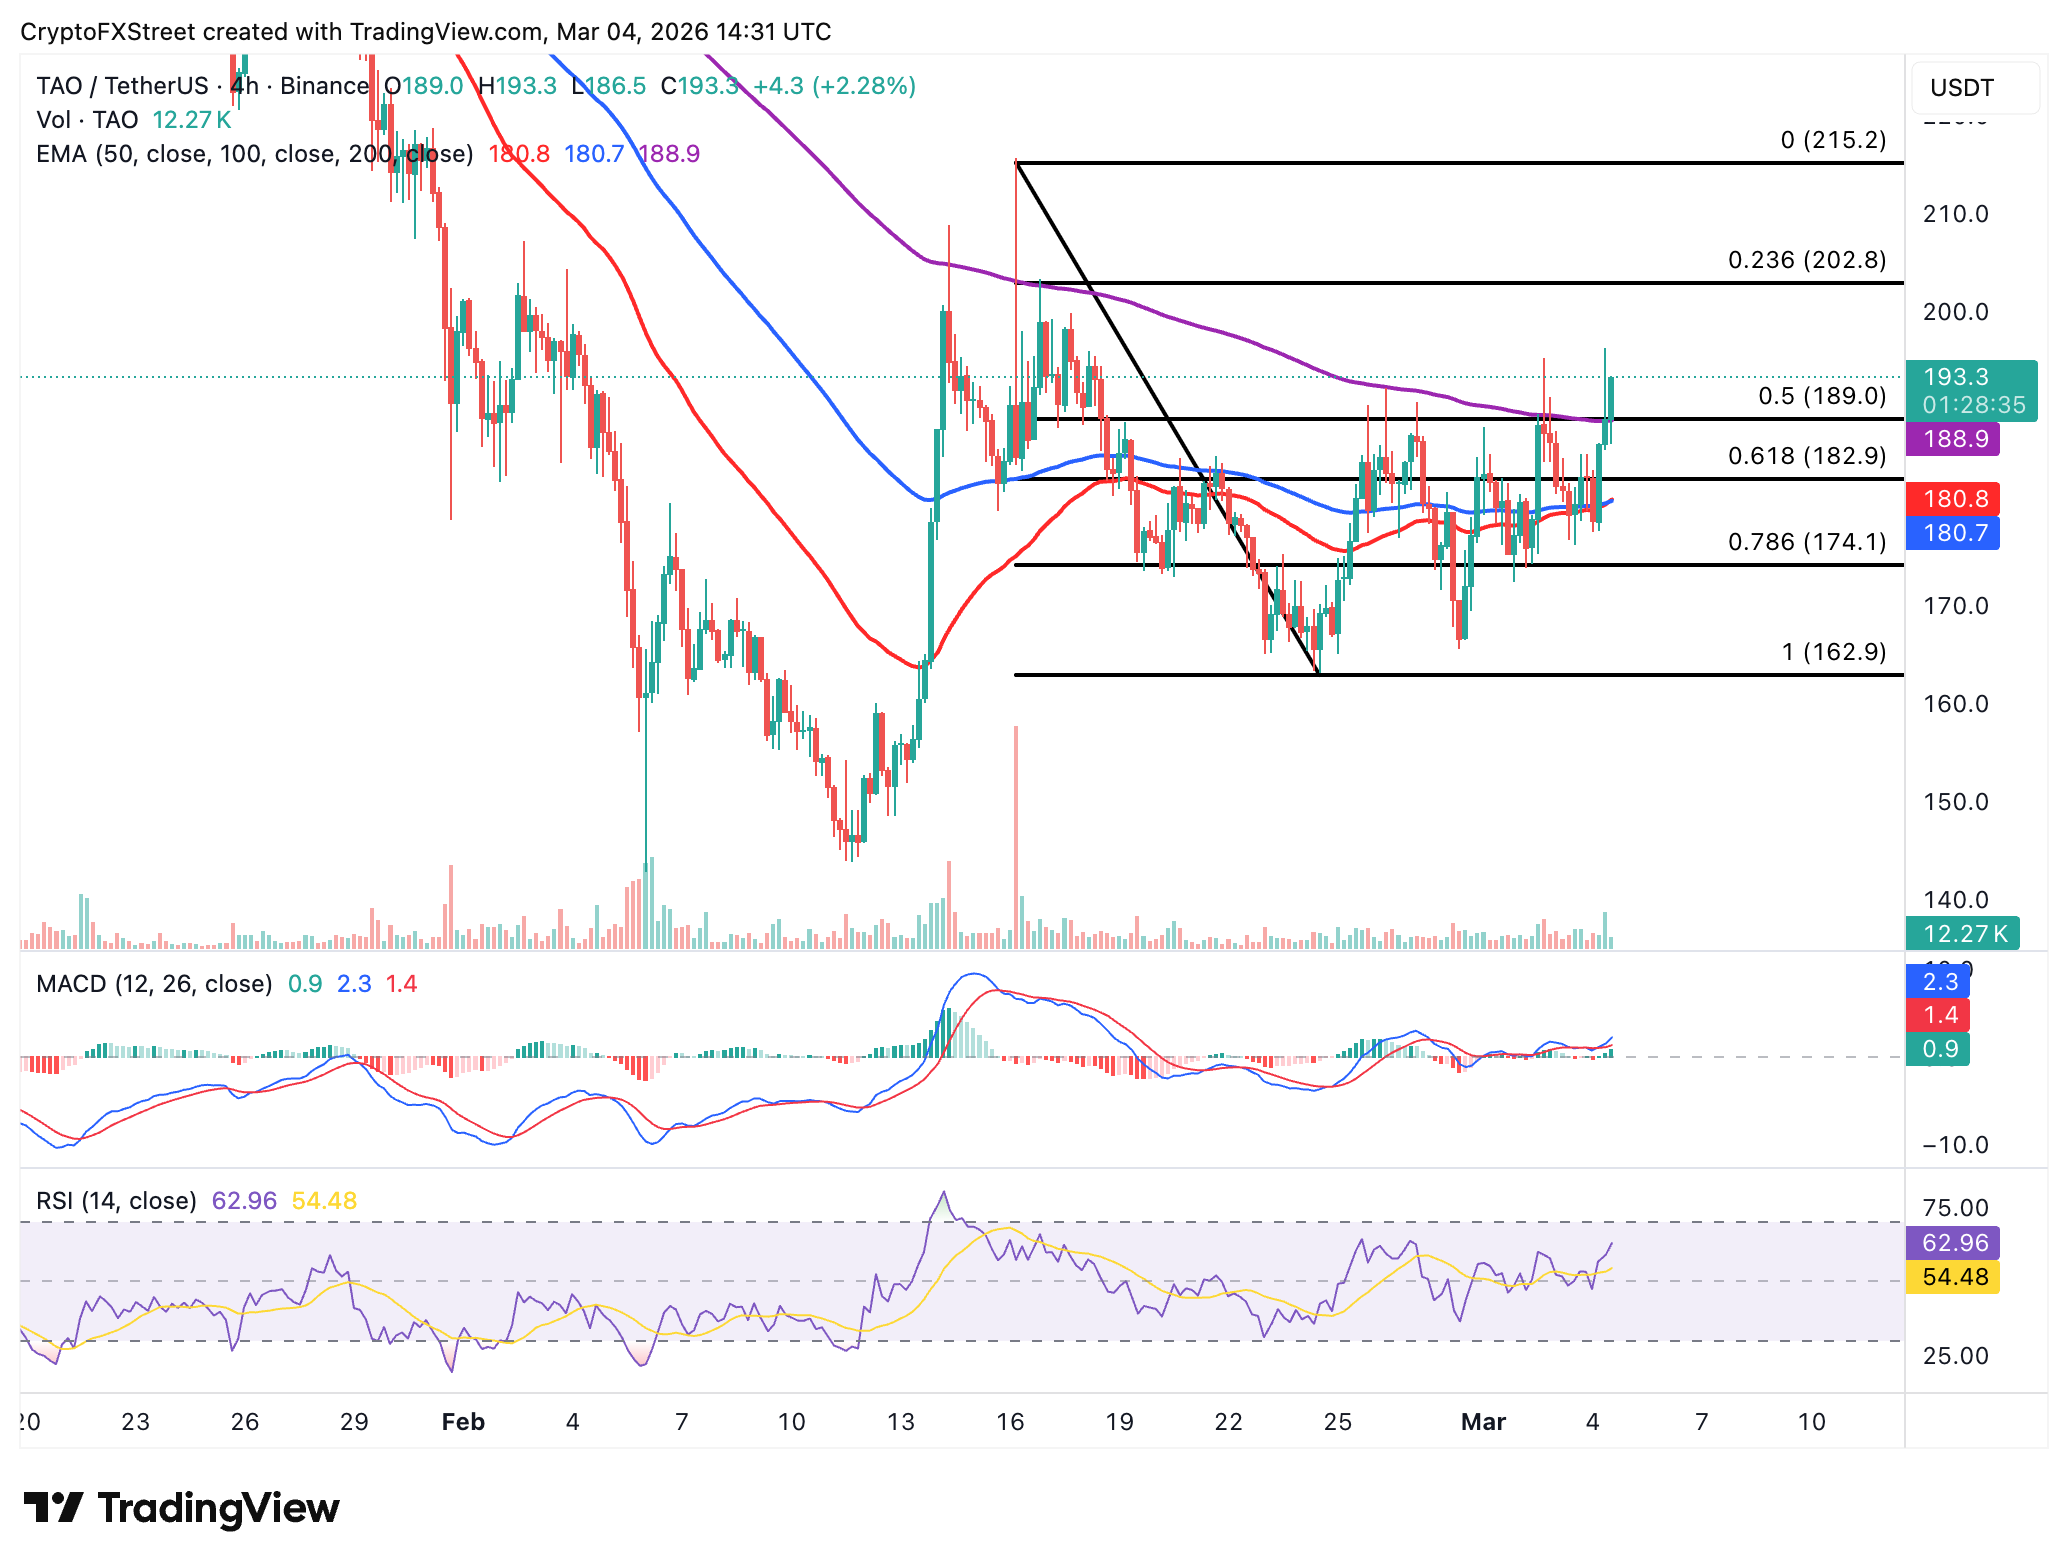
Immediate support is highlighted by a confluence formed by the 200-day EMA and 50% Fibonacci level around $189. A daily close below this short-term demand zone would expose Bittensor to the 61.8% Fibonacci level, followed by the confluence of the 50 and 100 EMAs at $181.
Cryptocurrency metrics FAQs
The developer or creator of each cryptocurrency decides on the total number of tokens that can be minted or issued. Only a certain number of these assets can be minted by mining, staking or other mechanisms. This is defined by the algorithm of the underlying blockchain technology. On the other hand, circulating supply can also be decreased via actions such as burning tokens, or mistakenly sending assets to addresses of other incompatible blockchains.
Market capitalization is the result of multiplying the circulating supply of a certain asset by the asset’s current market value.
Trading volume refers to the total number of tokens for a specific asset that has been transacted or exchanged between buyers and sellers within set trading hours, for example, 24 hours. It is used to gauge market sentiment, this metric combines all volumes on centralized exchanges and decentralized exchanges. Increasing trading volume often denotes the demand for a certain asset as more people are buying and selling the cryptocurrency.
Funding rates are a concept designed to encourage traders to take positions and ensure perpetual contract prices match spot markets. It defines a mechanism by exchanges to ensure that future prices and index prices periodic payments regularly converge. When the funding rate is positive, the price of the perpetual contract is higher than the mark price. This means traders who are bullish and have opened long positions pay traders who are in short positions. On the other hand, a negative funding rate means perpetual prices are below the mark price, and hence traders with short positions pay traders who have opened long positions.

超过一百万用户依赖 FXStreet 获取实时市场数据、图表工具、专家洞见和外汇新闻。其全面的经济日历和教育网络研讨会帮助交易者保持信息领先、做出审慎决策。FXStreet 拥有约 60 人的团队,分布在巴塞罗那总部及全球各地区。
阅读更多


