
Bittensor Price Forecast: TAO eyes second leg higher as bullish momentum builds
作者 Manish Chhetri
更新: 8 Apr 2026


热门文章

Bittensor (TAO) continues to climb, trading above $335 on Wednesday after surging over 8% so far this week.
- Bittensor price extends its gains on Wednesday, up over 8% so far this week.
- Derivatives data point to a bullish outlook, with positive funding rates and increasing Open Interest indicating rising investor confidence.
- The technical outlook suggests TAO could be gearing up for a second leg higher, targeting levels above $400.
Bittensor (TAO) continues to climb, trading above $335 on Wednesday after surging over 8% so far this week. Improving sentiment across the derivatives market supports a bullish outlook for TAO, while technical analysis suggests a continuation of the bullish trend, aiming for levels above $400 in the upcoming days.
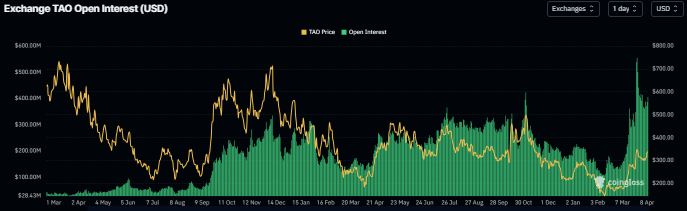
Derivatives data shows a bullish bias
CoinGlass’s data shows that the futures’ OI at exchanges in Bittensor reached a record high of $554.98 million on March 26 and, despite a slight pullback, remains on an upward trajectory, standing at $407.58 million as of Wednesday. An increasing OI indicates new or additional money entering the market and new buying, which could fuel a second leg higher in the TAO price.
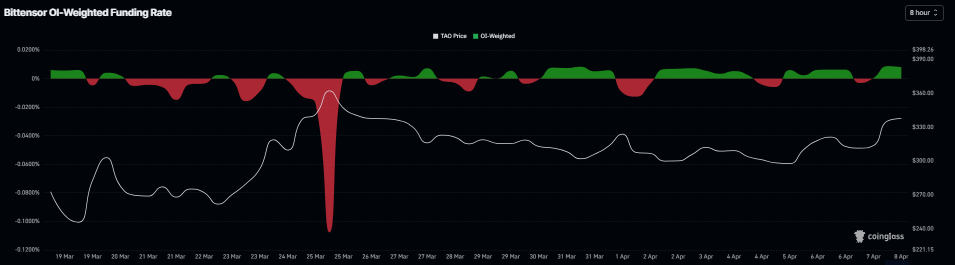
In addition, TAO’s funding rate flipped positive on Tuesday and stands at 0.008% on Wednesday, indicating that longs are paying shorts. Historically, as shown in the chart below, when funding rates have flipped from negative to positive and risen, the TAO price has surged.
Apart from bullish derivatives metrics, market sentiment also supports a risk-on stance amid easing geopolitical tensions between the US and Iran following the announcement of a two-week ceasefire, which could further fuel TAO’s upward momentum.
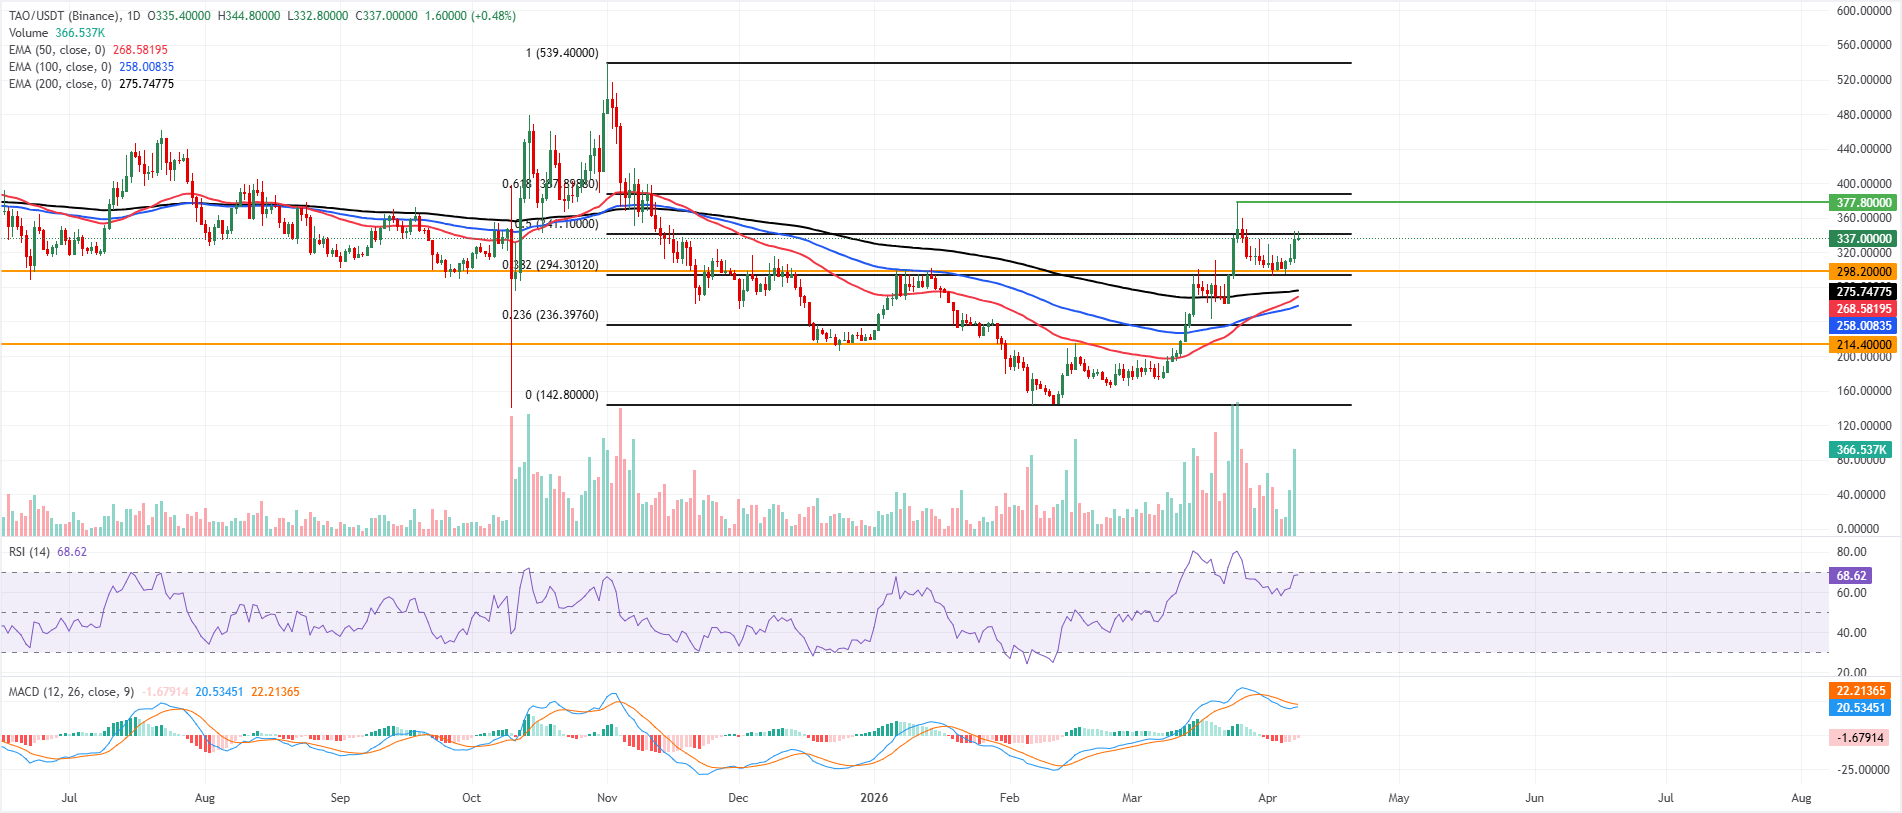
Bittensor Price Forecast: TAO bulls aim for levels above $400
Bittensor price trades above $335 on Wednesday, up over 8% so far this week. The near-term bias turns cautiously bullish as price holds well above the 50-day, 100-day and 200-day Exponential Moving Averages near $258-$275, keeping the broader uptrend intact despite the recent pullback from the $377 area.
The Relative Strength Index (RSI) on the daily chart at 68 stays in positive territory without showing outright overbought stress, while the Moving Average Convergence Divergence (MACD) line climbs toward the signal line above zero, and the contracting negative histogram suggests fading bearish pressure after the correction.
Immediate cushion emerges at horizontal support at $298, which roughly aligns with the 38.2% Fibonacci retracement at $294, measured from the $142 low to the $539 high.
On the upside, initial resistance stands near $341, the 50.0% retracement, followed by the $388 area at the 61.8% retracement, where any rejection would cap the nascent recovery. A daily close above $341 would open the way for a second leg toward the key psychological level at $400.
(The technical analysis of this story was written with the help of an AI tool.)

超过一百万用户依赖 FXStreet 获取实时市场数据、图表工具、专家洞见和外汇新闻。其全面的经济日历和教育网络研讨会帮助交易者保持信息领先、做出审慎决策。FXStreet 拥有约 60 人的团队,分布在巴塞罗那总部及全球各地区。
阅读更多


