
British Pound holds firm as political stability offsets UK growth miss
作者 Christian Borjon Valencia
更新: 30 Jun 2026


热门文章

The Pound Sterling advances 0.11% on Tuesday, even though UK data showed the economy is slowing, while the latest US jobs report showed that the number of vacancies rose in May, according to the US Bureau of Labour Statistics. The GBP/USD trades at 1.3270.
- UK GDP misses yearly forecasts, but services cushion slowdown.
- JOLTS vacancies rise, yet hiring weakness clouds labor outlook.
- Bailey and Hammack keep inflation and rate risks alive.
The Pound Sterling advances 0.11% on Tuesday, even though UK data showed the economy is slowing, while the latest US jobs report showed that the number of vacancies rose in May, according to the US Bureau of Labour Statistics. The GBP/USD trades at 1.3270.
GBP/USD gains as politics calm despite weaker UK growth signals
The Office for National Statistics revealed that Gross Domestic Product (GDP) for Q1 2026 expanded by 0.6% QoQ as expected, boosted by services, specifically computer programming, commented Liz McKewon, the director of economic statistics at the ONS. However, on a yearly basis, the economy grew by 0.9% but, below estimates and the prior reading of 1.1%.
Meanwhile, investors continued to digest Andy Burnham's speech, in which he pledged for a radical political change, devolving more power to regions and promoting cooperation over division. Also, he adhered to the fiscal rules developed by the current Chancellor Rachell Reeves.
Cable showed no meaningful reaction to the data, but as of late, GBP/USD cleared June’s 29 peak following the release of US data.
The US Job Openings and Labour Turnover Survey (JOLTS) jumped unexpectedly in May, an indication that vacancies are rising, but hiring remains weak, according to the Bureau of Labour Statistics (BLS). Job openings rose by 7.594 million, exceeding forecasts of 7.3 million and above the downwardly revised 7.585 million in April.
Other data revealed that US Consumer Confidence improved in June as the truce deal between the US and Iran drove gasoline prices lower.
Danna Peterson, the Chief Economist at the Conference Board, said that “Consumer appraisals of current business conditions were slightly more positive compared to last month.” However, she added that perceptions about the labour market had weakened.
Recently, the Bank of England Governor Andrew Bailey commented that UK inflation could still rise to 3.2% this year, and that it’s important that energy prices are now much higher than before the Iran war.
Meanwhile, Cleveland Fed Beth Hammack was hawkish, commenting that inflation is too high and that the Fed “may need to consider rate hikes.” Hammack added that if consumer data holds up, this means that policy nis not that restrictive.
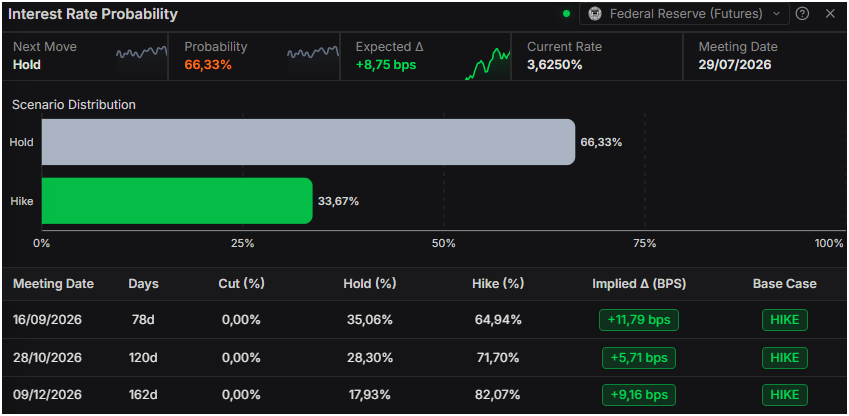
Money markets had priced in 35 basis points of Federal Reserve tightening by the end of 2026. For the July meeting, traders expect the US central bank to hold rates unchanged.
GBP/USD Price Forecast: Technical outlook
In the daily chart, GBP/USD trades at 1.3253, maintaining a bearish near-term tone as spot holds below the cluster of the 50-, 100- and 200-day simple moving averages (SMAs) grouped around 1.3420. The pair also trades beneath both the broken upward trend-line at 1.3468 and the former downward resistance line now watched around 1.3526, suggesting rallies remain capped while the Relative Strength Index (RSI) at 42 stays in neutral-to-soft territory.
On the topside, initial resistance stands at the daily SMA cluster near 1.3420, followed by the upward trend-line break level at 1.3468, while a more significant barrier emerges at the prior downward resistance trend-line around 1.3526. On the downside, the lack of nearby mapped structural supports leaves the pair vulnerable to further slippage, with traders likely using intraday lows and psychological handles as interim floors until a clearer technical base develops below the current 1.3253 area.
(The technical analysis of this story was written with the help of an AI tool.)
Pound Sterling Price Today
The table below shows the percentage change of British Pound (GBP) against listed major currencies today. British Pound was the strongest against the Japanese Yen.
| USD | EUR | GBP | JPY | CAD | AUD | NZD | CHF | |
|---|---|---|---|---|---|---|---|---|
| USD | 0.06% | 0.02% | 0.44% | -0.01% | -0.35% | -0.41% | 0.12% | |
| EUR | -0.06% | -0.04% | 0.35% | -0.13% | -0.43% | -0.49% | 0.04% | |
| GBP | -0.02% | 0.04% | 0.39% | -0.09% | -0.36% | -0.44% | 0.08% | |
| JPY | -0.44% | -0.35% | -0.39% | -0.46% | -0.79% | -0.83% | -0.33% | |
| CAD | 0.01% | 0.13% | 0.09% | 0.46% | -0.34% | -0.37% | 0.14% | |
| AUD | 0.35% | 0.43% | 0.36% | 0.79% | 0.34% | -0.03% | 0.50% | |
| NZD | 0.41% | 0.49% | 0.44% | 0.83% | 0.37% | 0.03% | 0.47% | |
| CHF | -0.12% | -0.04% | -0.08% | 0.33% | -0.14% | -0.50% | -0.47% |
The heat map shows percentage changes of major currencies against each other. The base currency is picked from the left column, while the quote currency is picked from the top row. For example, if you pick the British Pound from the left column and move along the horizontal line to the US Dollar, the percentage change displayed in the box will represent GBP (base)/USD (quote).

超过一百万用户依赖 FXStreet 获取实时市场数据、图表工具、专家洞见和外汇新闻。其全面的经济日历和教育网络研讨会帮助交易者保持信息领先、做出审慎决策。FXStreet 拥有约 60 人的团队,分布在巴塞罗那总部及全球各地区。
阅读更多


