
Cardano Price Forecast: ADA downtrend persists as bearish setup caps whale-backed rebound
作者 Manish Chhetri
更新: 8 Jun 2026


热门文章

Cardano (ADA) remains under pressure, trading below $0.170 on Monday after a massive correction in the previous week. The bearish price action is supported by the uncertainty surrounding Charles Hoskinson’s remarks last week, which weighed heavily on market sentiment.
- Cardano trades below $0.170 on Monday after plunging nearly 30% last week following comments from Charles Hoskinson.
- Santiment data shows certain whale wallets accumulated ADA during the recent correction.
- Despite whale accumulation, ADA remains capped by a bearish technical structure and weak market sentiment.
Cardano (ADA) remains under pressure, trading below $0.170 on Monday after a massive correction in the previous week. The bearish price action is supported by the uncertainty surrounding Charles Hoskinson’s remarks last week, which weighed heavily on market sentiment. While on-chain data shows certain whale wallets accumulated ADA during the sharp correction, bearish technical indicators and weakening derivatives metrics suggest the recovery attempt could remain limited.
Cardano remains under bearish pressure even as whales accumulate
Cardano’s bearish momentum accelerated last week, with ADA plunging nearly 30% after comments from founder Charles Hoskinson. As noted in the previous report, Hoskinson’s Thursday post on X stating, “I’m taking a break, TTYL,” sparked uncertainty among market participants and triggered a sharp sell-off.
However, Hoskinson returned on Friday in a live stream on X to clarify that he was only stepping back from social media and other public-facing activities. He emphasized that he remains committed to addressing complex challenges such as the Blockchain Trilemma but disclaims responsibility for the ADA price, as it could raise speculation risk.
The uncertainty surrounding his remarks weighed heavily on Cardano’s investor sentiment, sending ADA to a low of $0.148 on Saturday, a level not seen since December 26, 2020, before it recovered slightly the next day.
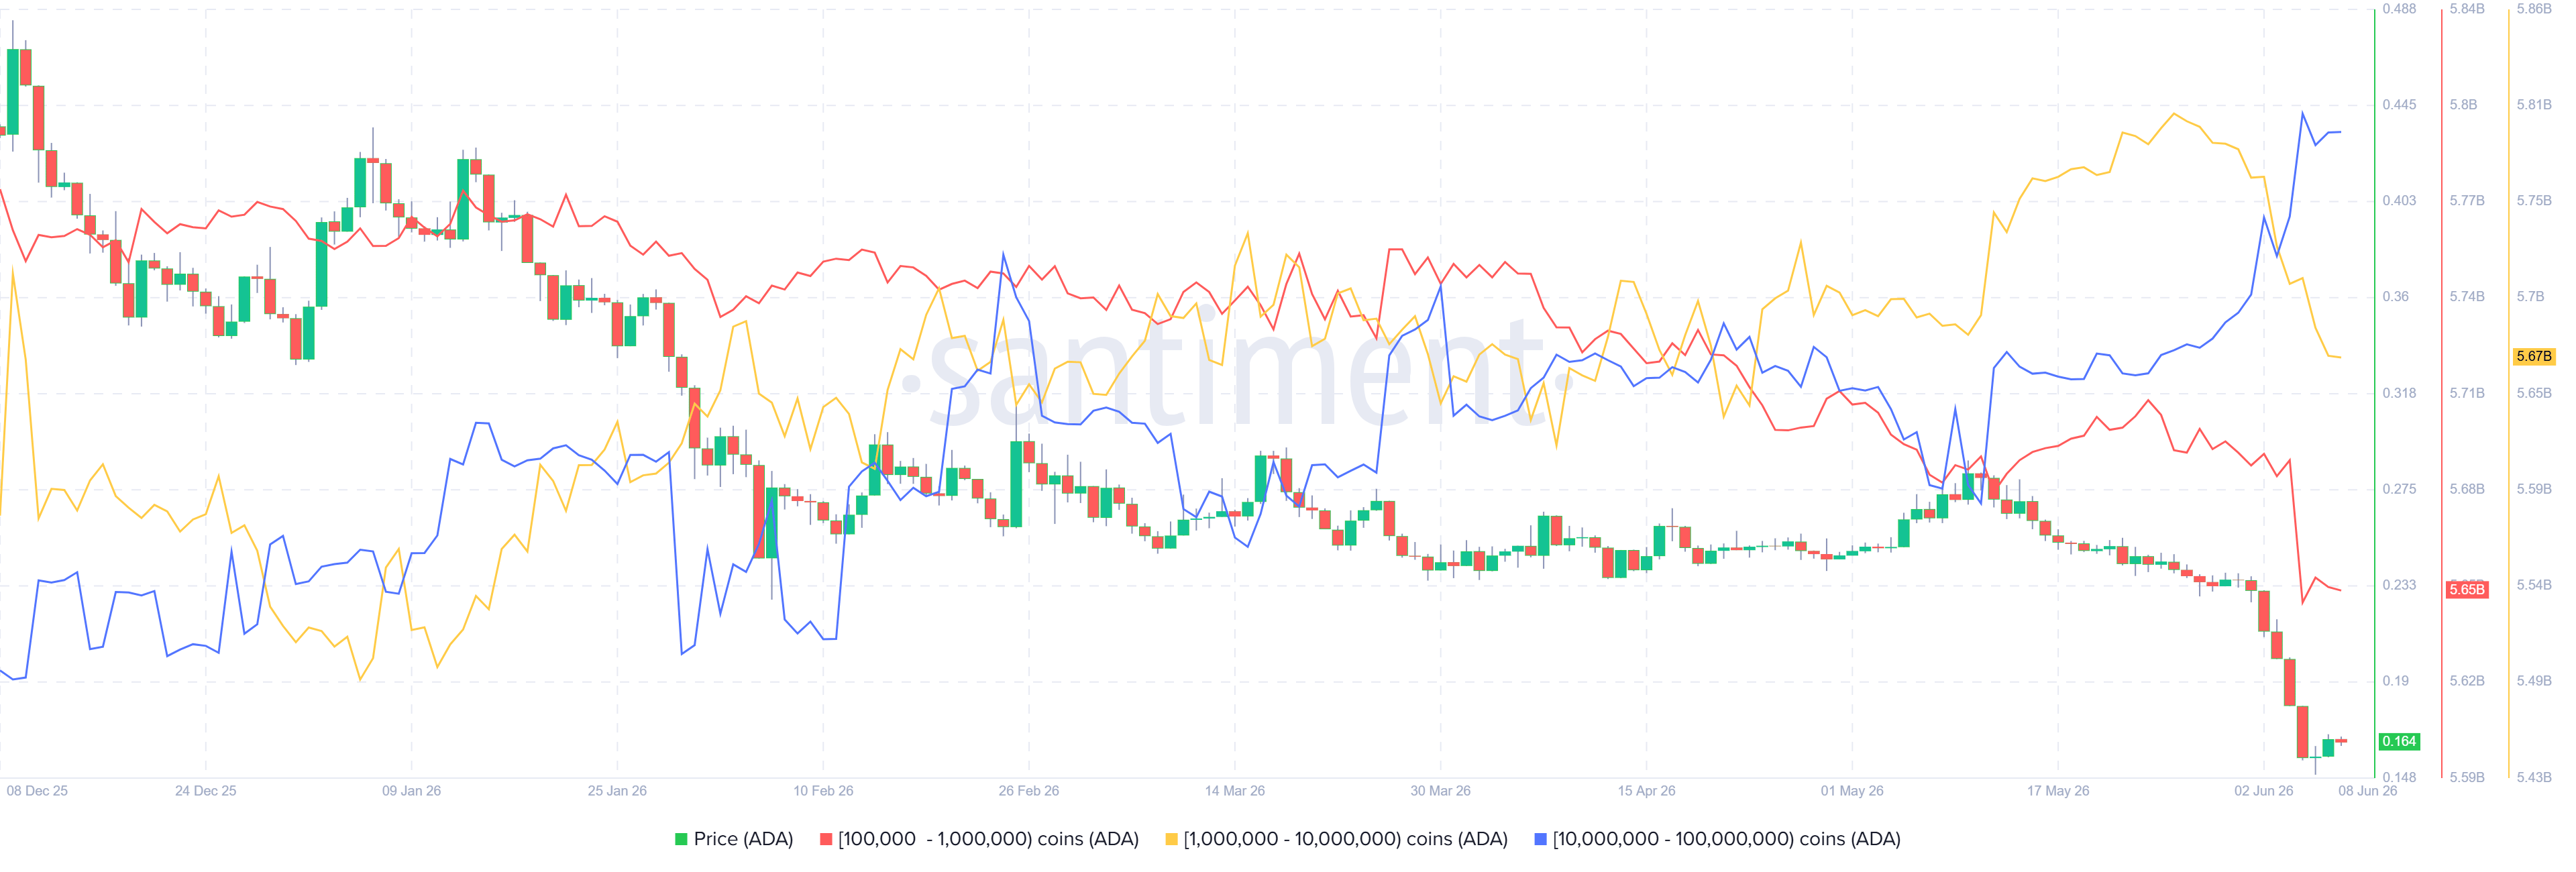
Diving deeper into whale activity, Santiment’s Supply Distribution data shows that certain whale wallets bought ADA during recent price dips.
The metric indicates that whales holding between 10 million and 100 million ADA tokens have accumulated a total of 220 million tokens from June 1. During the same period, wallets holding between 100,000 and 1 million ADA tokens (red line) and 1 million and 10 million ADA tokens (yellow line) have shed 140 million tokens.
This shows that the second cohort of whales could have fallen prey to the capitulation event. In contrast, the first set of wallets seized the opportunity and accumulated Cardano at a discount.
Derivatives metrics show weakening conditions
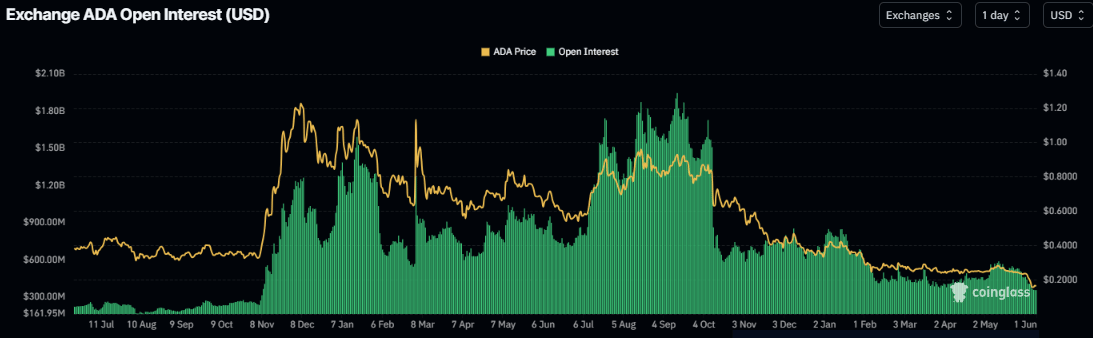
Cardano’s derivatives data shows a bearish bias. CoinGlass’ Open Interest (OI) for ADA drops to $353 million on Monday from the May high of $585 million, reaching levels not seen since November 2024. This steady drop in OI reflects waning investor participation and projects a bearish outlook.
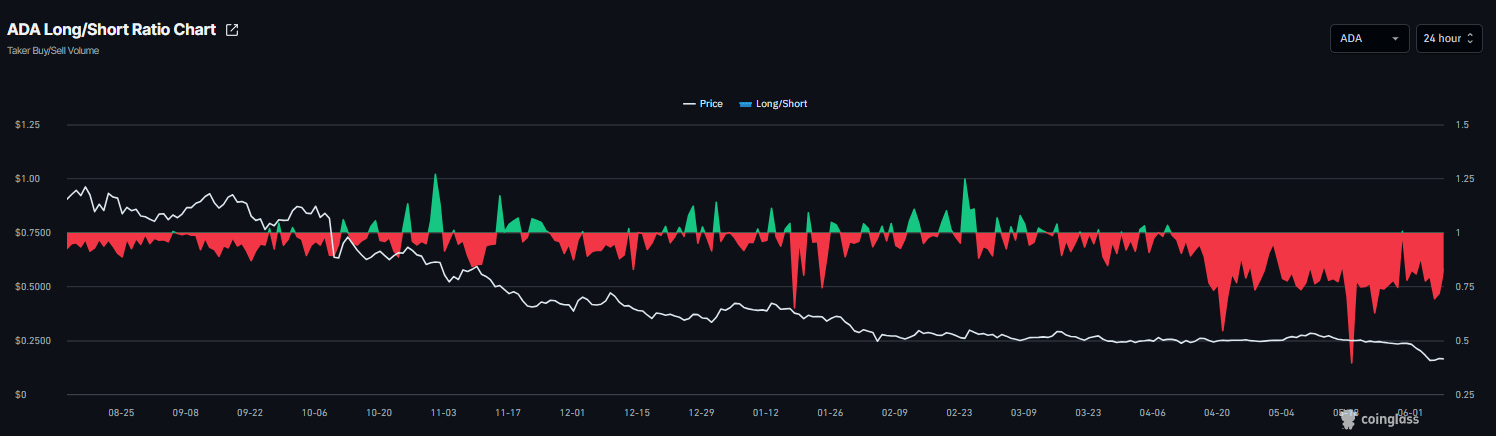
In addition, Coinglass’s long-to-short ratio for ADA reads 0.80 on Monday, nearing the lowest level over a month. The ratio being below one, indicates bearish sentiment, as traders are betting the asset’s price will fall.
Cardano Price Forecast: ADA drops to its lowest price level in over five years
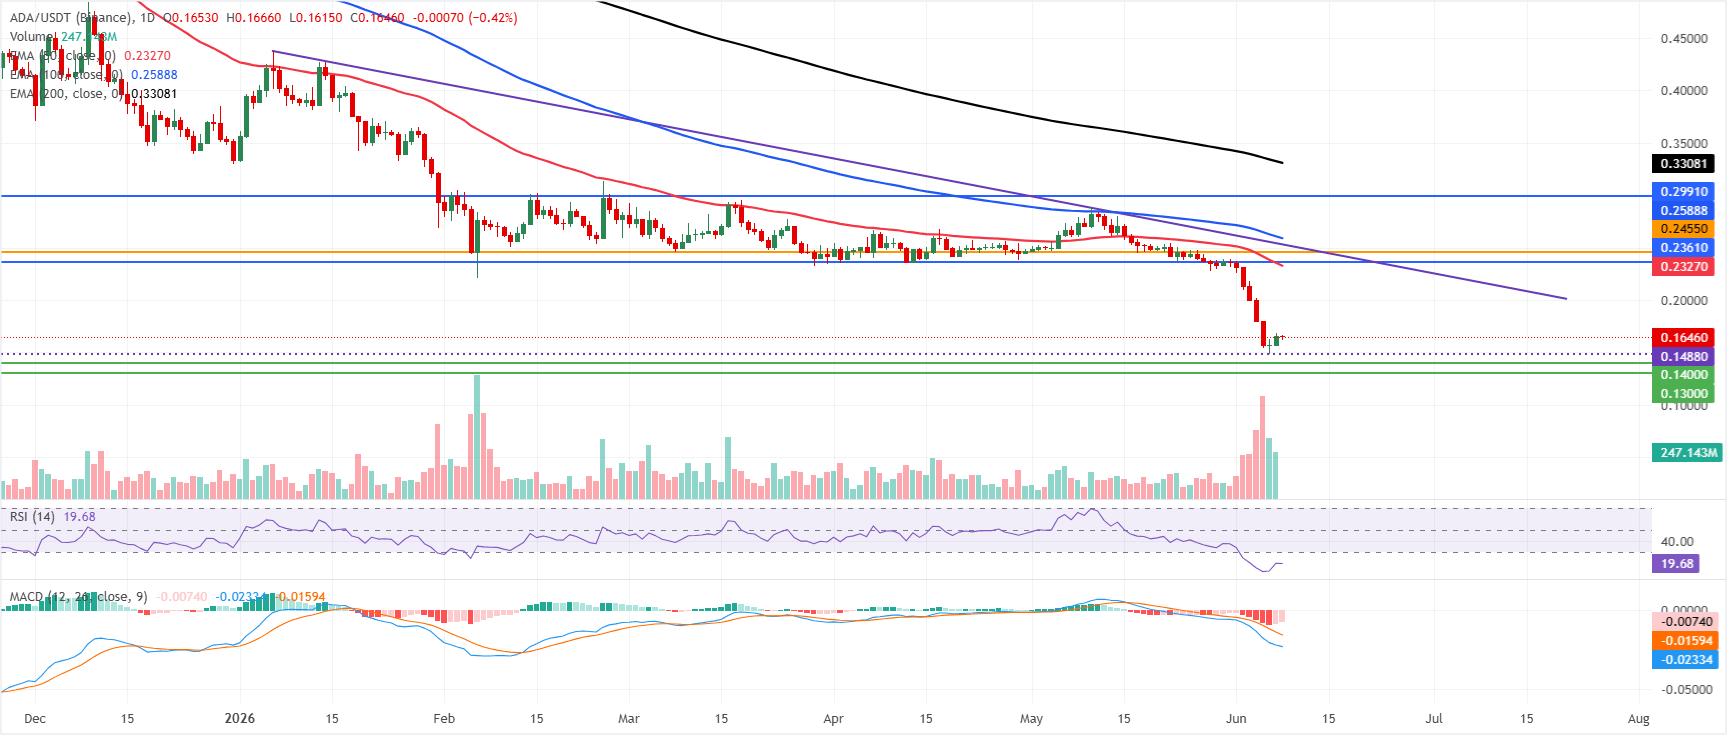
Cardano price trades at $0.163, maintaining a clear bearish bias as it remains well below the 50-day, 100-day, and 200-day Exponential Moving Averages (EMAs), clustered between roughly $0.230 and $0.330.
The Relative Strength Index (RSI) on the daily chart sits in oversold territory near 19. At the same time, the Moving Average Convergence Divergence (MACD) remains negative, which together hints at persistent downside pressure despite the risk of short-lived corrective bounces.
On the topside, initial resistance aligns with the 50-day EMA at $0.232, followed closely by the prior horizontal barrier at $0.236, forming the first cap for any rebound. Above that, the 100-day EMA at $0.258 comes next, ahead of a more distant hurdle at $0.299 and the 200-day EMA near $0.332.
On the downside, the next important support is the horizontal level at $0.140, where sellers may hesitate if the current decline extends.
(The technical analysis of this story was written with the help of an AI tool.)

超过一百万用户依赖 FXStreet 获取实时市场数据、图表工具、专家洞见和外汇新闻。其全面的经济日历和教育网络研讨会帮助交易者保持信息领先、做出审慎决策。FXStreet 拥有约 60 人的团队,分布在巴塞罗那总部及全球各地区。
阅读更多


