
Cardano Price Forecast: Bearish outlook strengthens as correction deepens
作者 Manish Chhetri
发布日期: 5 Feb 2026 | 修改日期: 5 Feb 2026


热门文章

Cardano (ADA) is extending its correction, trading below $0.29 at the time of writing on Thursday after posting two consecutive red candlesticks over the previous two days.
- Cardano price trades red on Thursday, posting two consecutive red candlesticks over the previous two days.
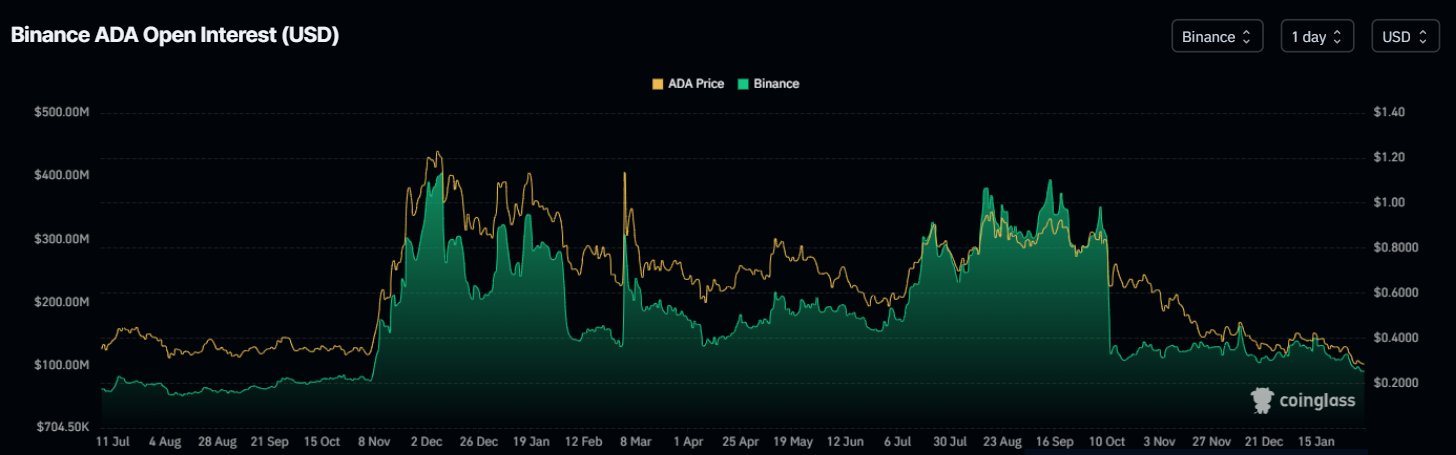
- Derivatives data indicates weakness, with Open interest dropping to November 2024 lows and rising short bets.
- Technical outlook suggests a deeper correction ahead, with bears targeting a level not seen since October 21, 2023.
Cardano (ADA) is extending its correction, trading below $0.29 at the time of writing on Thursday after posting two consecutive red candlesticks over the previous two days. The derivatives data shows signs of weakness, with ADA’s short bets rising amid falling Open Interest (OI), dropping to November 2024 lows. On the technical side, the outlook is bearish, with Cardano close to a price level not seen since October 21, 2023.
Cardano’s derivatives data shows bearish bias
Cardano’s futures OI at Binance exchange dropped to $90.21 million on Thursday, the lowest level since early November 2024, and has been steadily falling since mid-January. This drop in OI reflects waning investor participation and projects a bearish outlook.
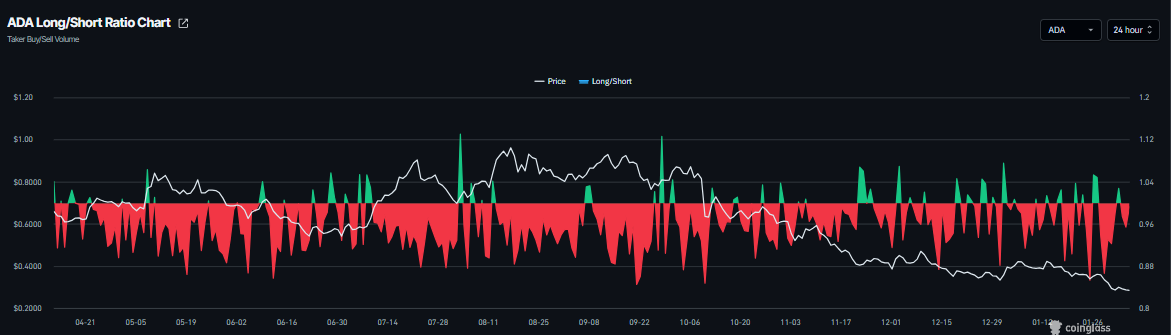
In addition, CoinGlass’s ADA long-to-short ratio stands at 0.95 on Thursday. This ratio, below one, reflects bearish sentiment in the markets, as more traders are betting on the asset price to fall.
Cardano Price Forecast: ADA bears in control
Cardano’s price declined by more than 15% last week, retesting the October 10 low of $0.27 on Saturday. ADA has traded red since Tuesday and, as of Thursday, is trading at $0.28.
If ADA continues its downward trend, it could extend the decline toward the October 21, 2023, low of $0.24.
The Relative Strength Index (RSI) on the daily chart stands near 30, pointing downward toward the oversold territory, indicating strong bearish momentum. The Moving Average Convergence Divergence (MACD) indicator showed a bearish crossover on January 18, which remains intact and thus further supports the negative outlook.
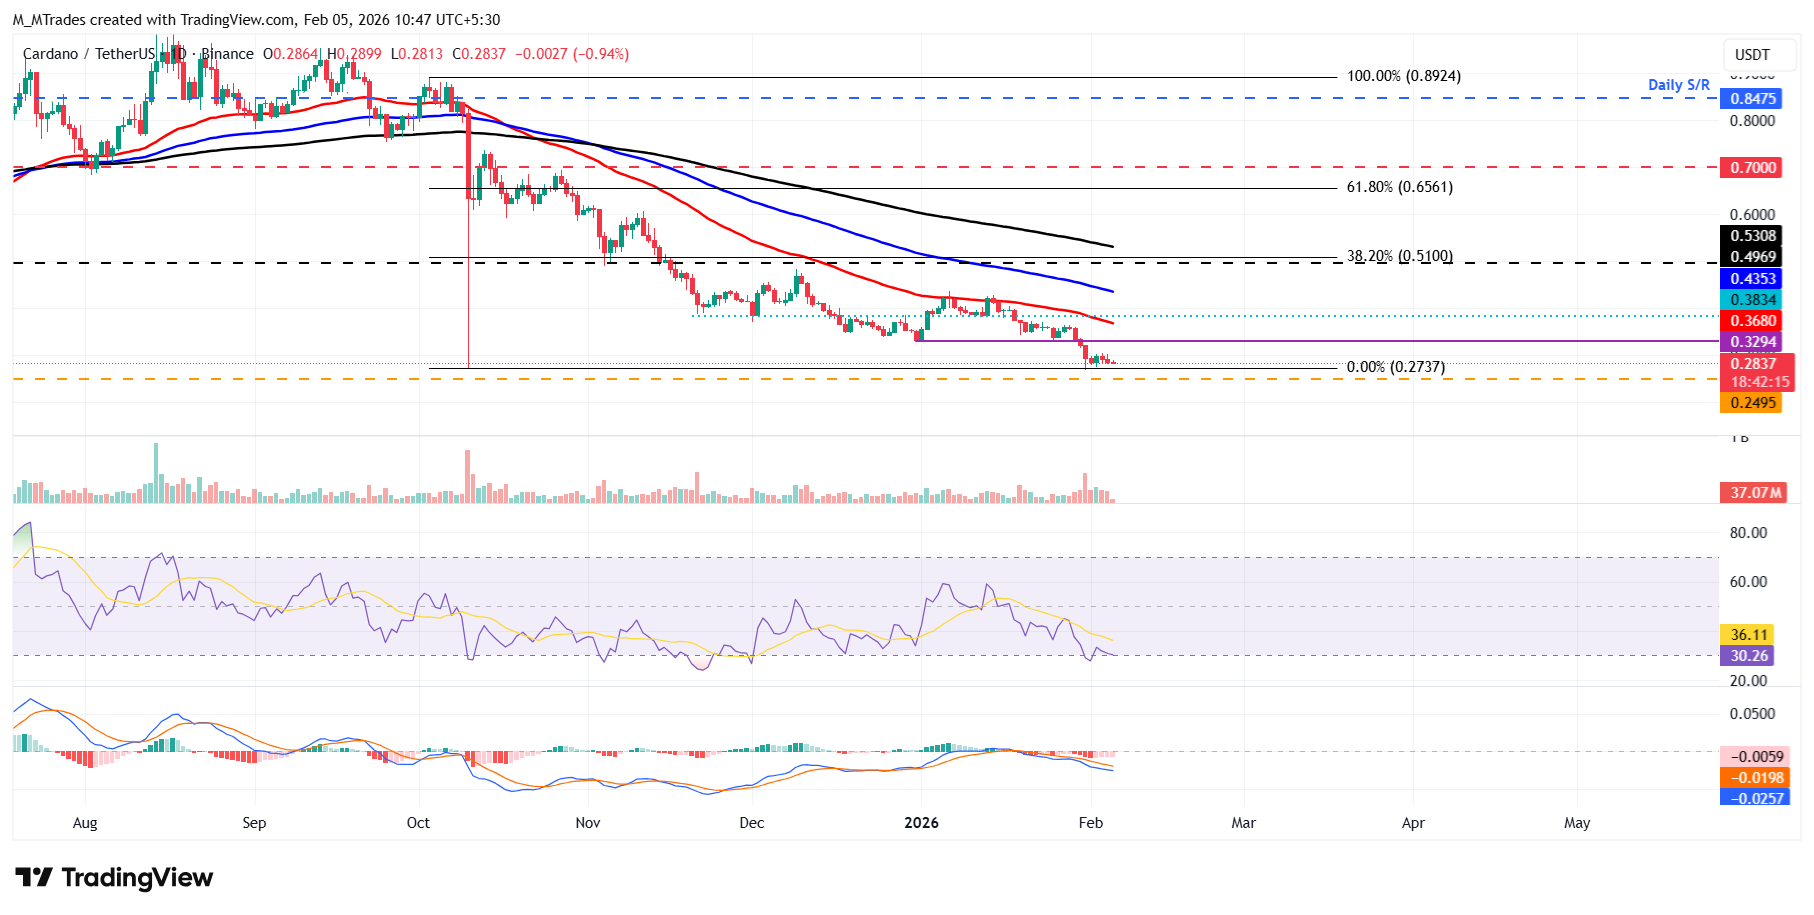
On the other hand, if ADA recovers, it could extend the recovery toward the daily resistance at $0.32.

超过一百万用户依赖 FXStreet 获取实时市场数据、图表工具、专家洞见和外汇新闻。其全面的经济日历和教育网络研讨会帮助交易者保持信息领先、做出审慎决策。FXStreet 拥有约 60 人的团队,分布在巴塞罗那总部及全球各地区。
阅读更多


