

Cardano Price Forecast: Extends losses as whale offloading, weak derivatives pressure ADA
- Cardano price slips below $0.175 on Wednesday, posting four consecutive days of losses.
- On-chain data shows that certain whales are offloading ADA tokens, increasing short-term selling pressure.
- Weakening derivatives metrics and fading bullish strength hint at deeper losses.
Cardano (ADA) remains under pressure, trading below $0.175 on Wednesday and posting four consecutive days of losses. Growing selling activity from large holders, weakening derivatives metrics and a deteriorating technical outlook suggest bears remain in control and could pave the way for further downside.
Whales offload ADA tokens
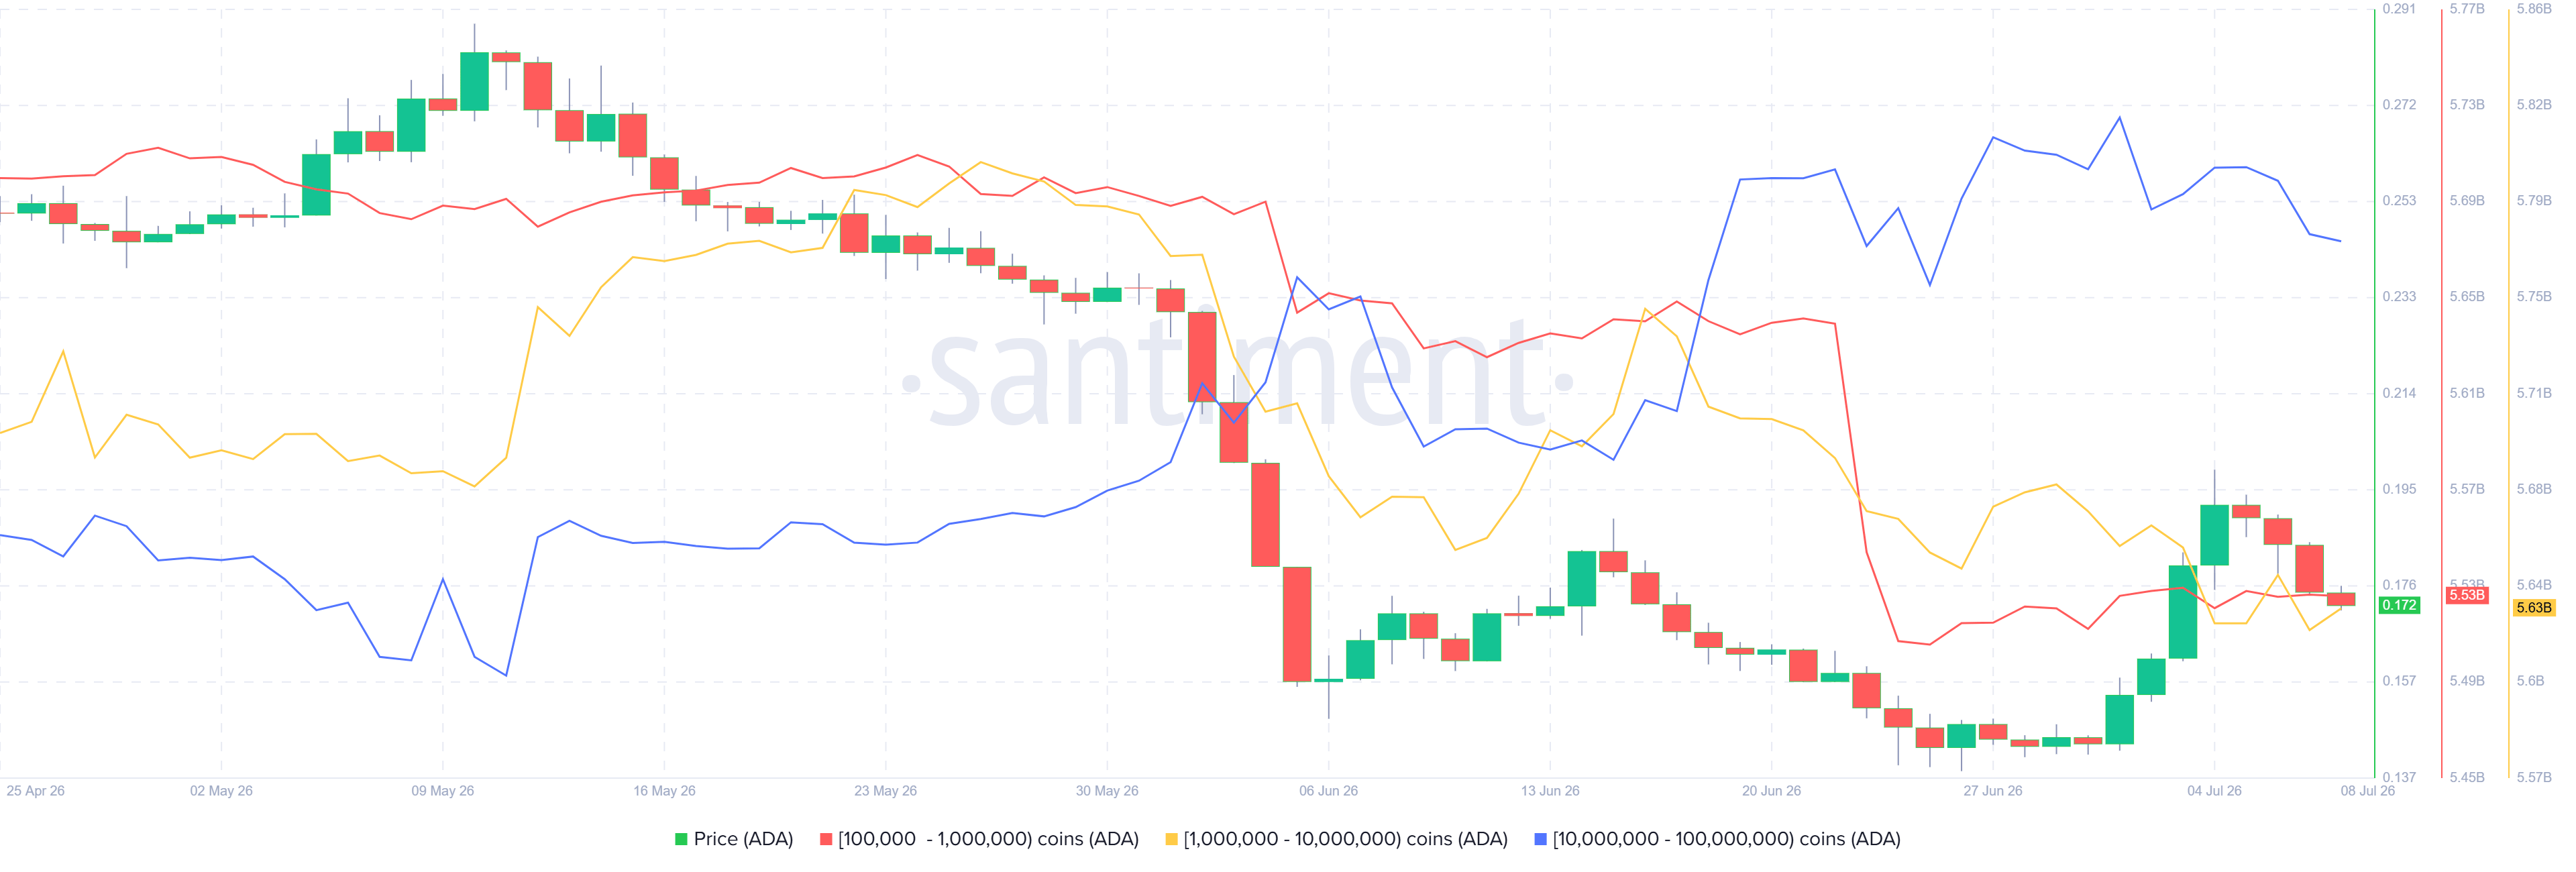
Santiment’s Supply Distribution data shows that whale wallets resumed offloading ADA tokens after last week’s recovery.

The metric indicates that whales holding between 100,000 and 1 million (red line), 1 million and 10 million (yellow line), and 10 million and 100 million ADA tokens have shed 190 million tokens since July 1, fueling the near-term selling pressure.
Derivatives data shows early signs of weakness
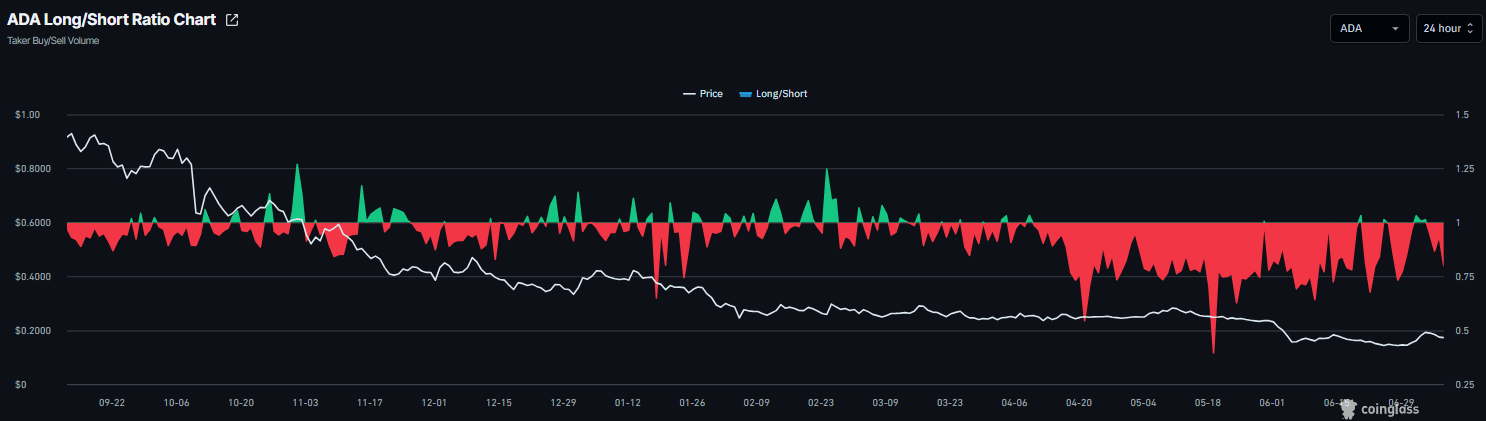
On the derivatives side, Cardano data shows cautious signs. CoinGlass’ long-to-short ratio for ADA reads 0.79 on Wednesday, nearing its lowest level in over a month. This ratio, being below one, reflects bearish sentiment in the market, as more traders are betting on the asset’s price to fall.
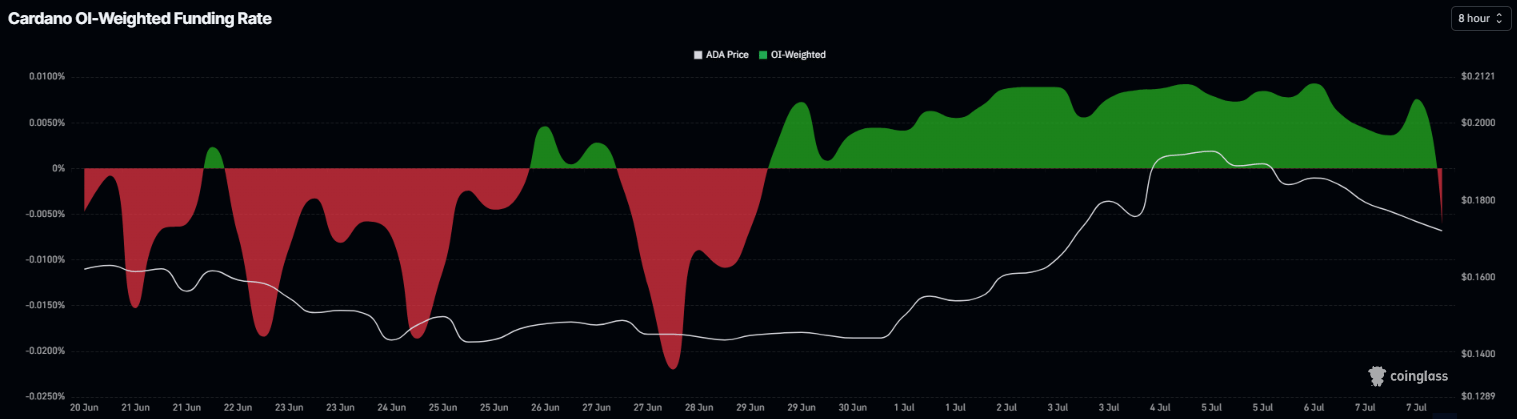
In addition, the funding rates data also supports a bearish outlook. CoinGlass’ OI-Weighted Funding Rate data for ADA flipped negative on Wednesday, reading -0.0060%. This negative rate indicates that shorts are paying longs and projects a bearish sentiment.
Cardano Price Forecast: ADA extends correction
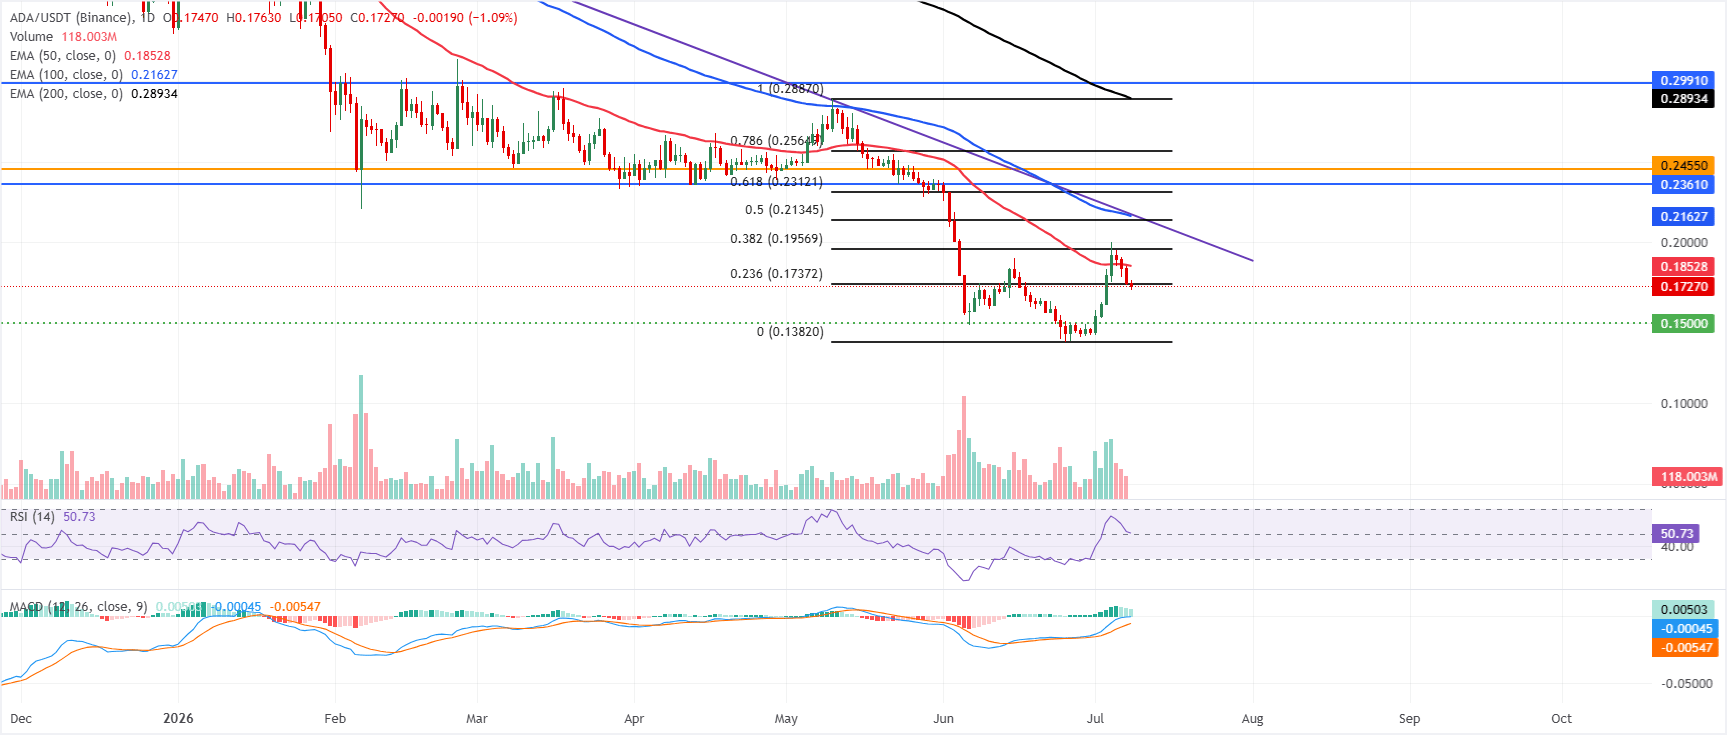
Cardano price trades at $0.172 on Wednesday, maintaining a bearish near-term tone as it remains below the key Exponential Moving Averages (EMAs), with the 50-day EMA at $0.185, the 100-day EMA at $0.216, and the 200-day EMA at $0.289 all acting as overhead supply.
Price is also lodged within a dense Fibonacci band, with the 32.82% Fibonacci retracement at $0.195 capping the latest bounce. At the same time, the Moving Average Convergence Divergence (MACD) turns positive, and the Relative Strength Index (RSI) hovers around 50, hinting at improving but still-capped momentum.
On the topside, immediate resistance is clustered at the 23.6% Fibonacci retracement at $0.173, followed by the 50-day EMA at $0.185 and the 38.2% Fibonacci retracement at $0.195, before a wider barrier emerges between the 50% retracement level at $0.213, the 100-day EMA at $0.216 and the broken descending trend-line around $0.217.
On the downside, initial demand is seen near the psychological and horizontal floor at $0.150, ahead of the Fibonacci cycle low at $0.138, with the pair needing to reclaim and hold above the $0.173 area to ease immediate downside pressure.
(The technical analysis of this story was written with the help of an AI tool. Know more.)














