
Cardano Price Forecast: Fading bearish momentum offers hope for recovery
作者 Manish Chhetri
更新: 29 Jun 2026


热门文章

Cardano (ADA) is stabilizing around $0.145 at the time of writing on Monday after suffering a sharp 21% decline over the previous two weeks. Derivatives metrics continue to reflect cautious market sentiment; however, fading bearish momentum suggests ADA could recover in the coming days.
- Cardano steadies at $0.145 on Monday after losing more than 21% over the last two weeks.
- Derivatives metrics continue to cap ADA's recovery, with negative funding rates and increasing short positioning among traders.
- Despite the weak derivatives backdrop, technical indicators suggest bearish momentum is fading, pointing to early signs of a potential recovery.
Cardano (ADA) is stabilizing around $0.145 at the time of writing on Monday after suffering a sharp 21% decline over the previous two weeks. Derivatives metrics continue to reflect cautious market sentiment; however, fading bearish momentum suggests ADA could recover in the coming days.
Derivatives data shows cautious market sentiment
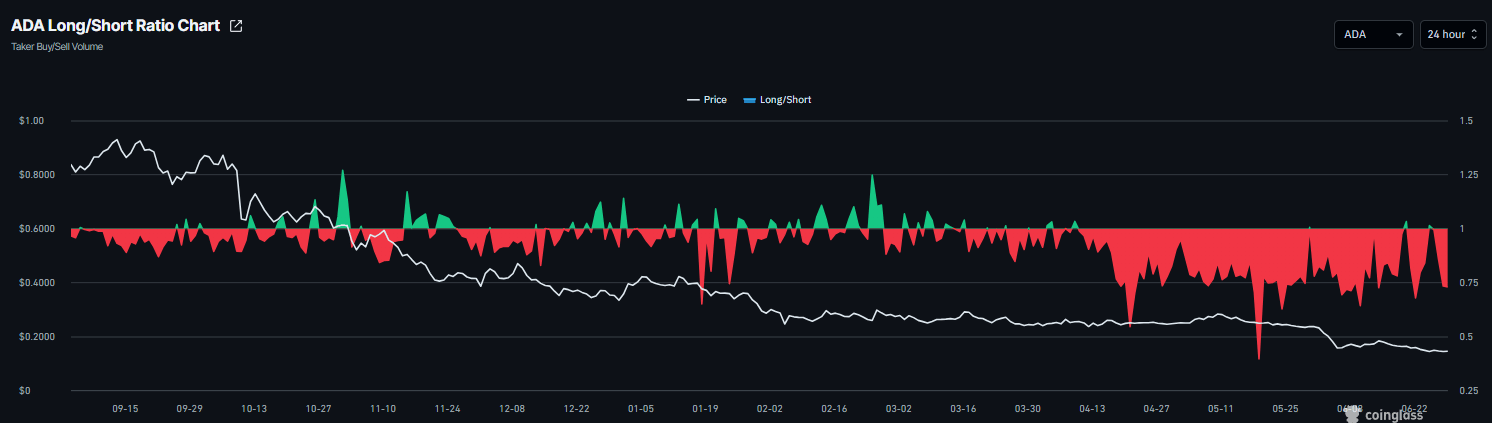
On the derivatives side, Cardano data continues to show bearish bias. CoinGlass’ long-to-short ratio for ADA reads 0.72 on Monday, the lowest level in over a month. This ratio, being below 1, reflects bearish sentiment in the market, as more traders are betting the asset’s price will fall.
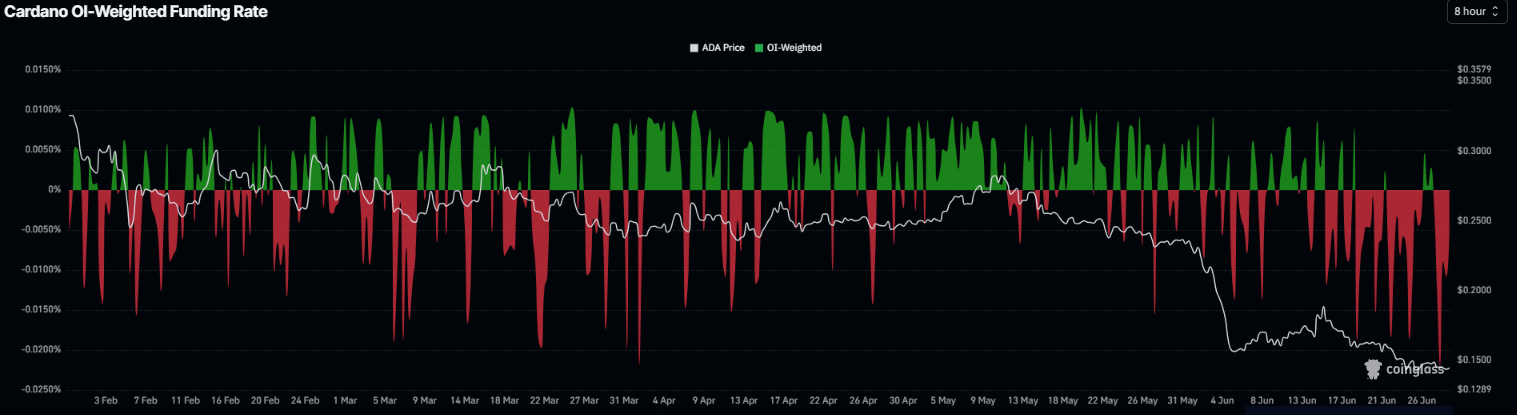
In addition, the funding rates flipped negative on Saturday and read -0.0055% on Monday, indicating that shorts are paying longs and projecting a bearish outlook.
Some signs of optimism
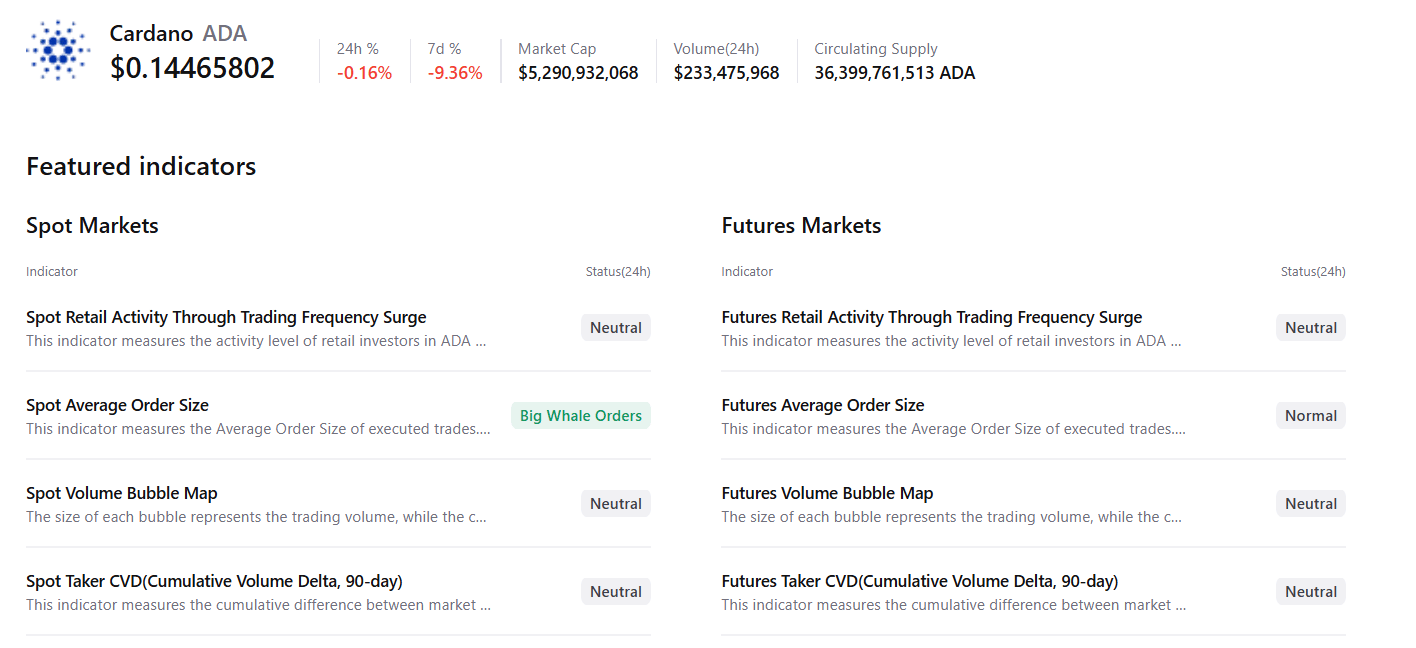
CryptoQuant’s summary data shows mild bullish sentiment. Cardano’s spot markets show large whale orders amid neutral conditions across other metrics, supporting a potential recovery.
Cardano Price Forecast: ADA could rebound if $0.140 holds strong
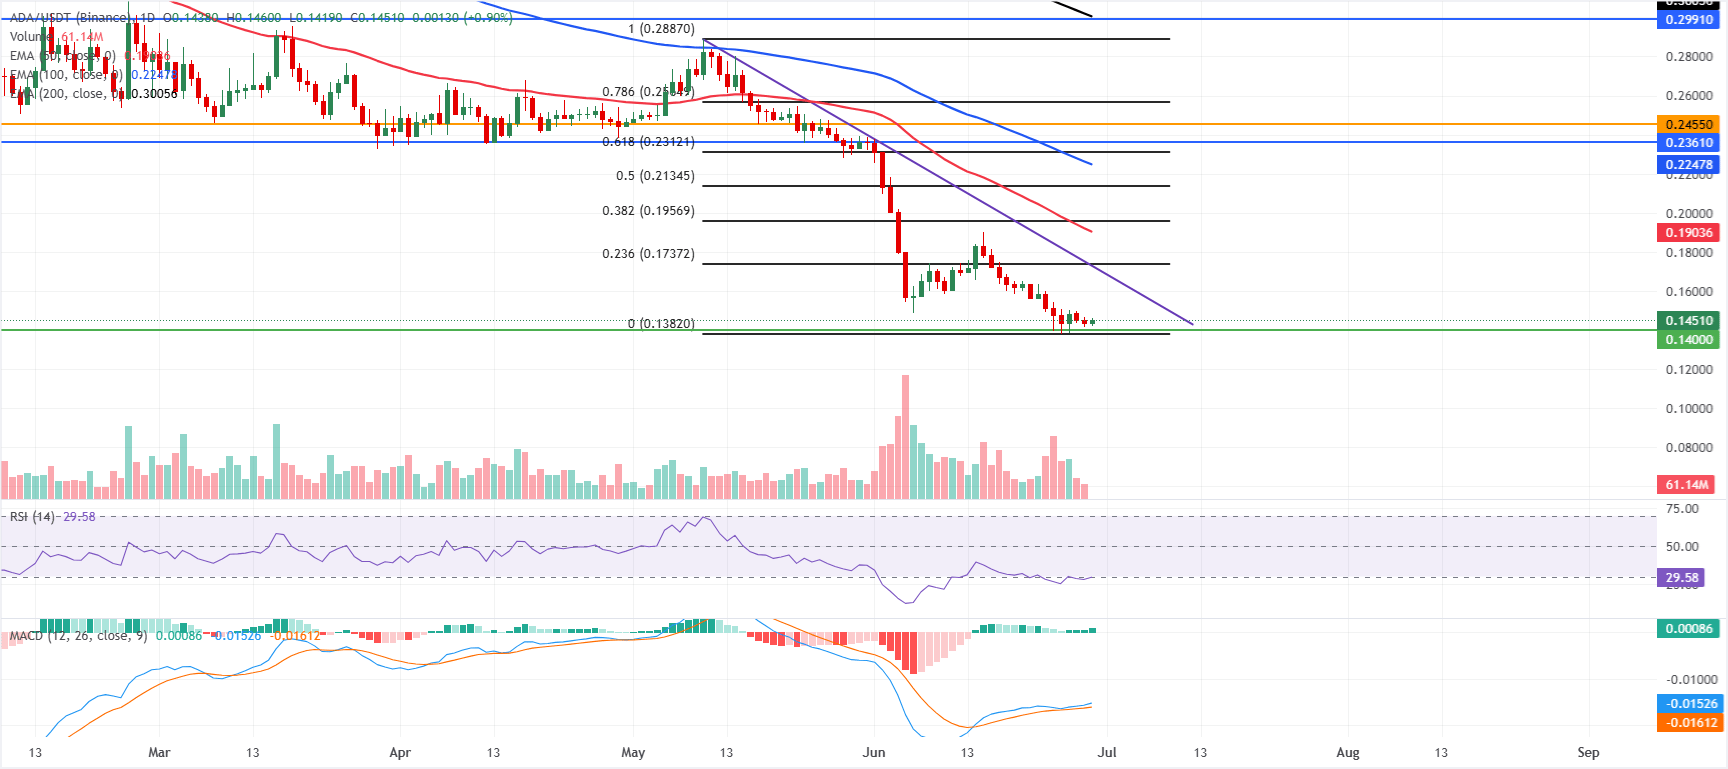
Cardano price trades at $0.145 on Monday, finding support around the key $0.140 psychological support over the weekend. ADA has corrected by over 21% in the last two weeks and continues to maintain its bearish bias, holding well below the 50-day, 100-day, and 200-day Exponential Moving Averages (EMAs) at $0.1904, $0.2248, and $0.3006, respectively.
The Relative Strength Index (RSI) at 29 flirts with oversold territory. The Moving Average Convergence Divergence (MACD) indicator has turned marginally positive. However, with prices still suppressed across all major EMAs, this suggests only tentative stabilization rather than a clear recovery.
On the downside, a daily close back under $0.1451 would expose the horizontal support at $0.1400 ahead of the structural low around $0.1382.
On the topside, initial resistance is clustered in the $0.1726–$0.1737 area where the broken descending trendline and the 23.6% Fibonacci retracement converge, followed by the 50-day EMA near $0.1904 and the 38.2% retracement at $0.1957. Higher up, the mid-range barrier at $0.2134 and the 100-day EMA at $0.2248 precede a dense supply band between $0.2312 and $0.2565, while more substantial resistance waits at the horizontal levels of $0.2991 and the 200-day EMA around $0.3006.
(The technical analysis of this story was written with the help of an AI tool.)

超过一百万用户依赖 FXStreet 获取实时市场数据、图表工具、专家洞见和外汇新闻。其全面的经济日历和教育网络研讨会帮助交易者保持信息领先、做出审慎决策。FXStreet 拥有约 60 人的团队,分布在巴塞罗那总部及全球各地区。
阅读更多


