
Chainlink Price Forecast: LINK breakout in focus, but 50-day EMA remains a hurdle
作者 John Isige
更新: 10 Apr 2026


热门文章

Chainlink (LINK) gains momentum, trading at $9.13 at the time of writing on Friday. The oracle token’s bullish outlook mirrors the broader crypto market's positive sentiment, driven by the fragile yet holding ceasefire between the United States (US) and Iran.
- Chainlink rises for a second consecutive day, eyeing a breakout above $10.00.
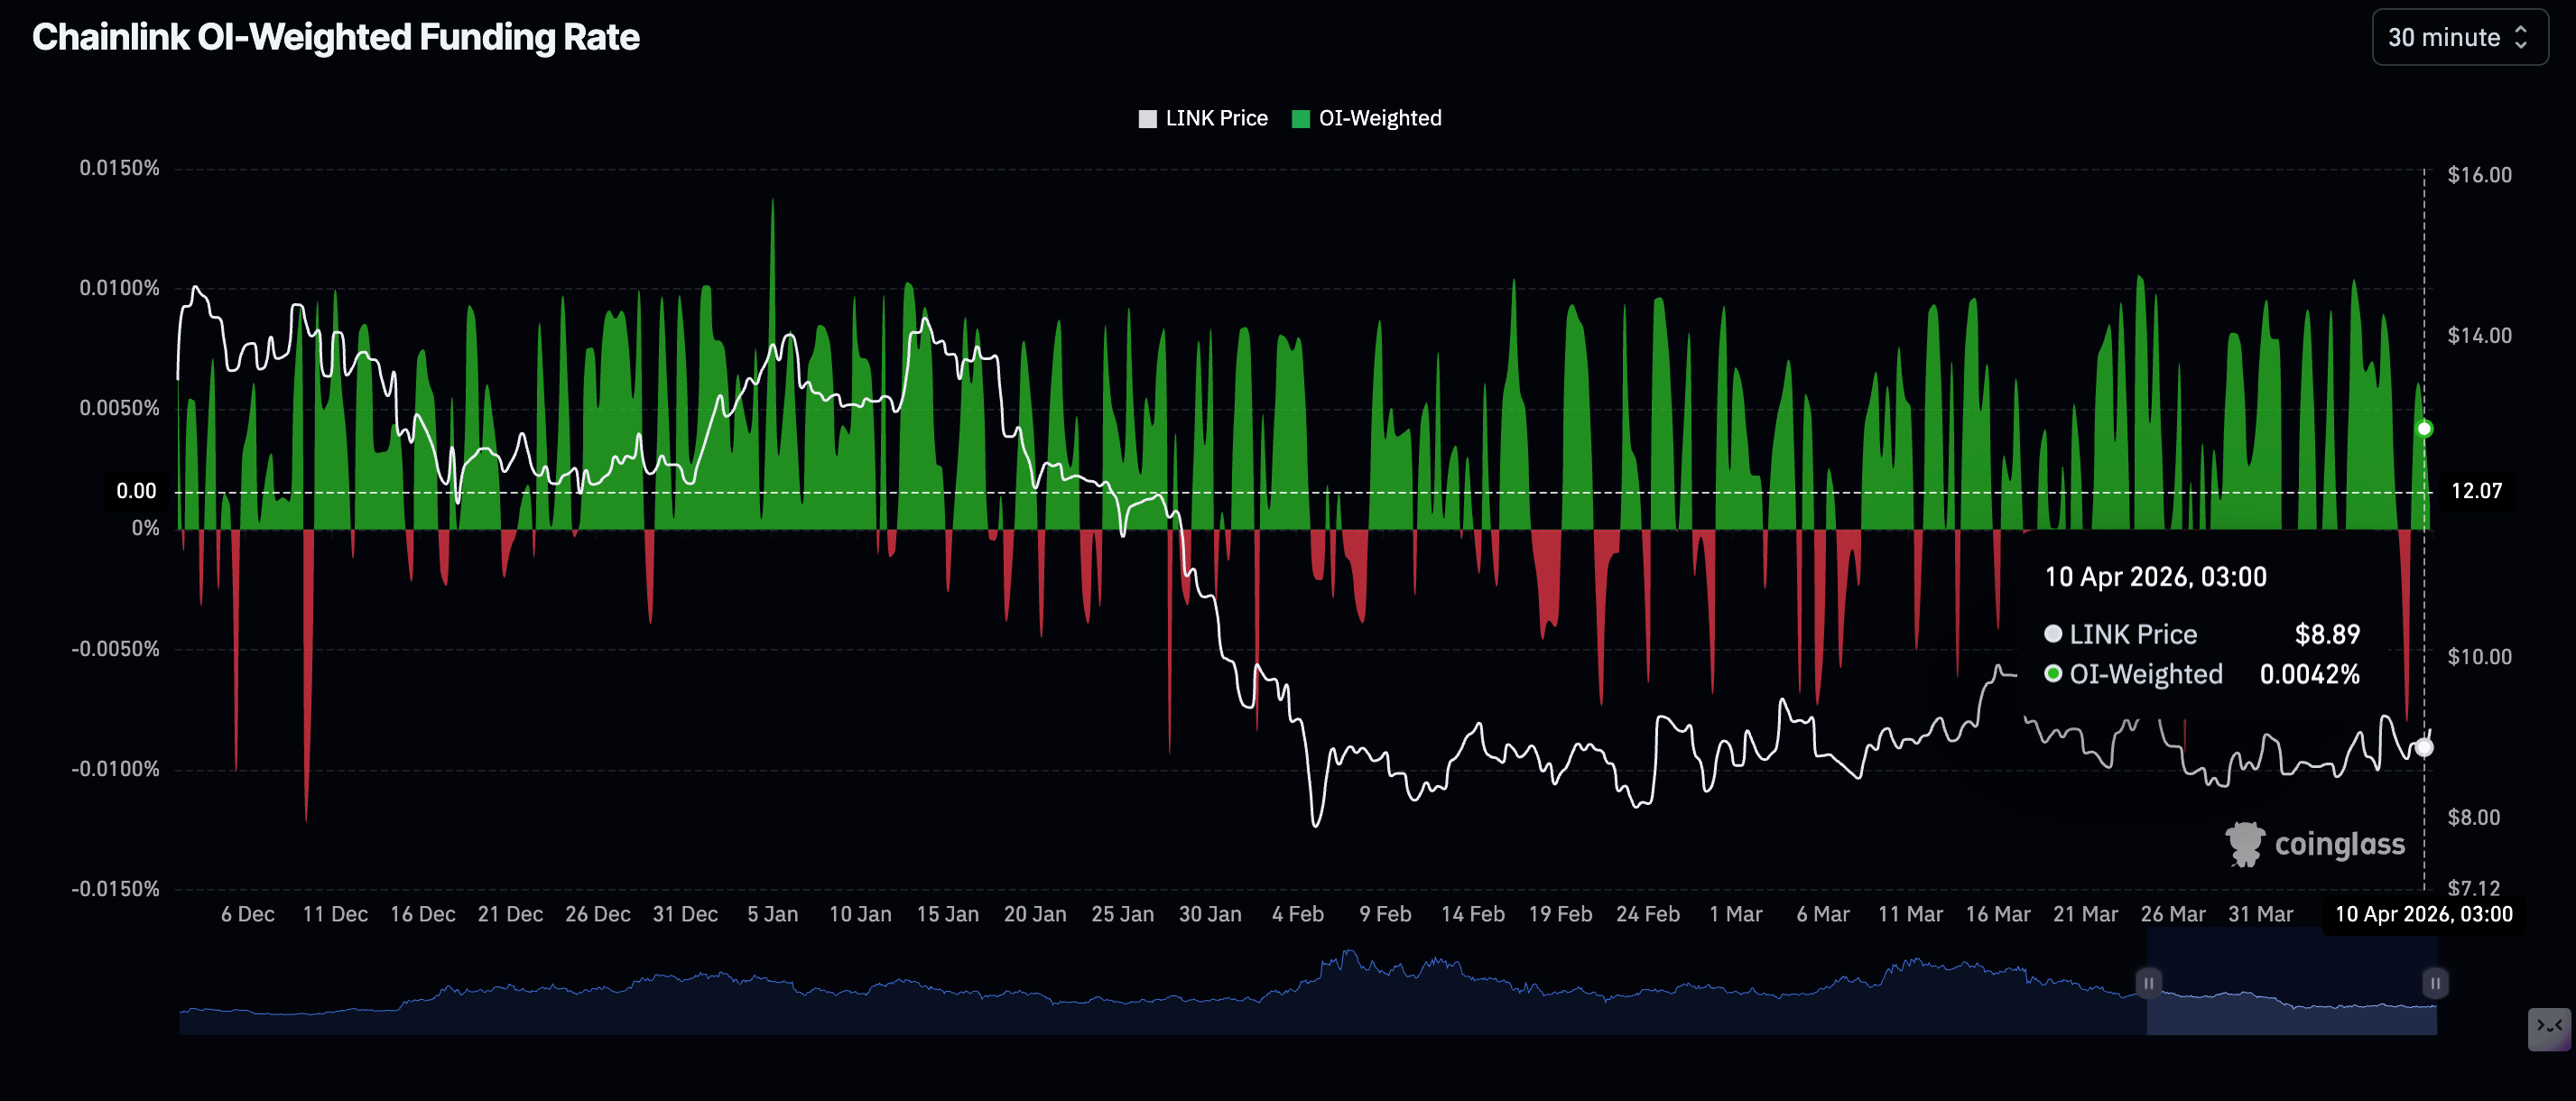
- Traders pile into long positions in LINK, lifting the Open Interest-Weighted Funding Rate into positive territory.
- Momentum indicators rise in tandem with Chainlink, but the 50-day EMA caps its immediate upside.
Chainlink (LINK) gains momentum, trading at $9.13 at the time of writing on Friday. The oracle token’s bullish outlook mirrors the broader crypto market's positive sentiment, driven by the fragile yet holding ceasefire between the United States (US) and Iran.
Chainlink steadies as bullish bets expand
Traders appear to be gaining conviction in Chainlink’s ability to sustain an uptrend, which may explain the surge in bullish bets, keeping the futures Open Interest (OI) Weighted Funding Rate positive at 0.0042% on Friday, slightly down from 0.0061% the previous day. If this outlook remains intact, pressure could ease, paving the way for Chainlink’s breakout above $10.00.
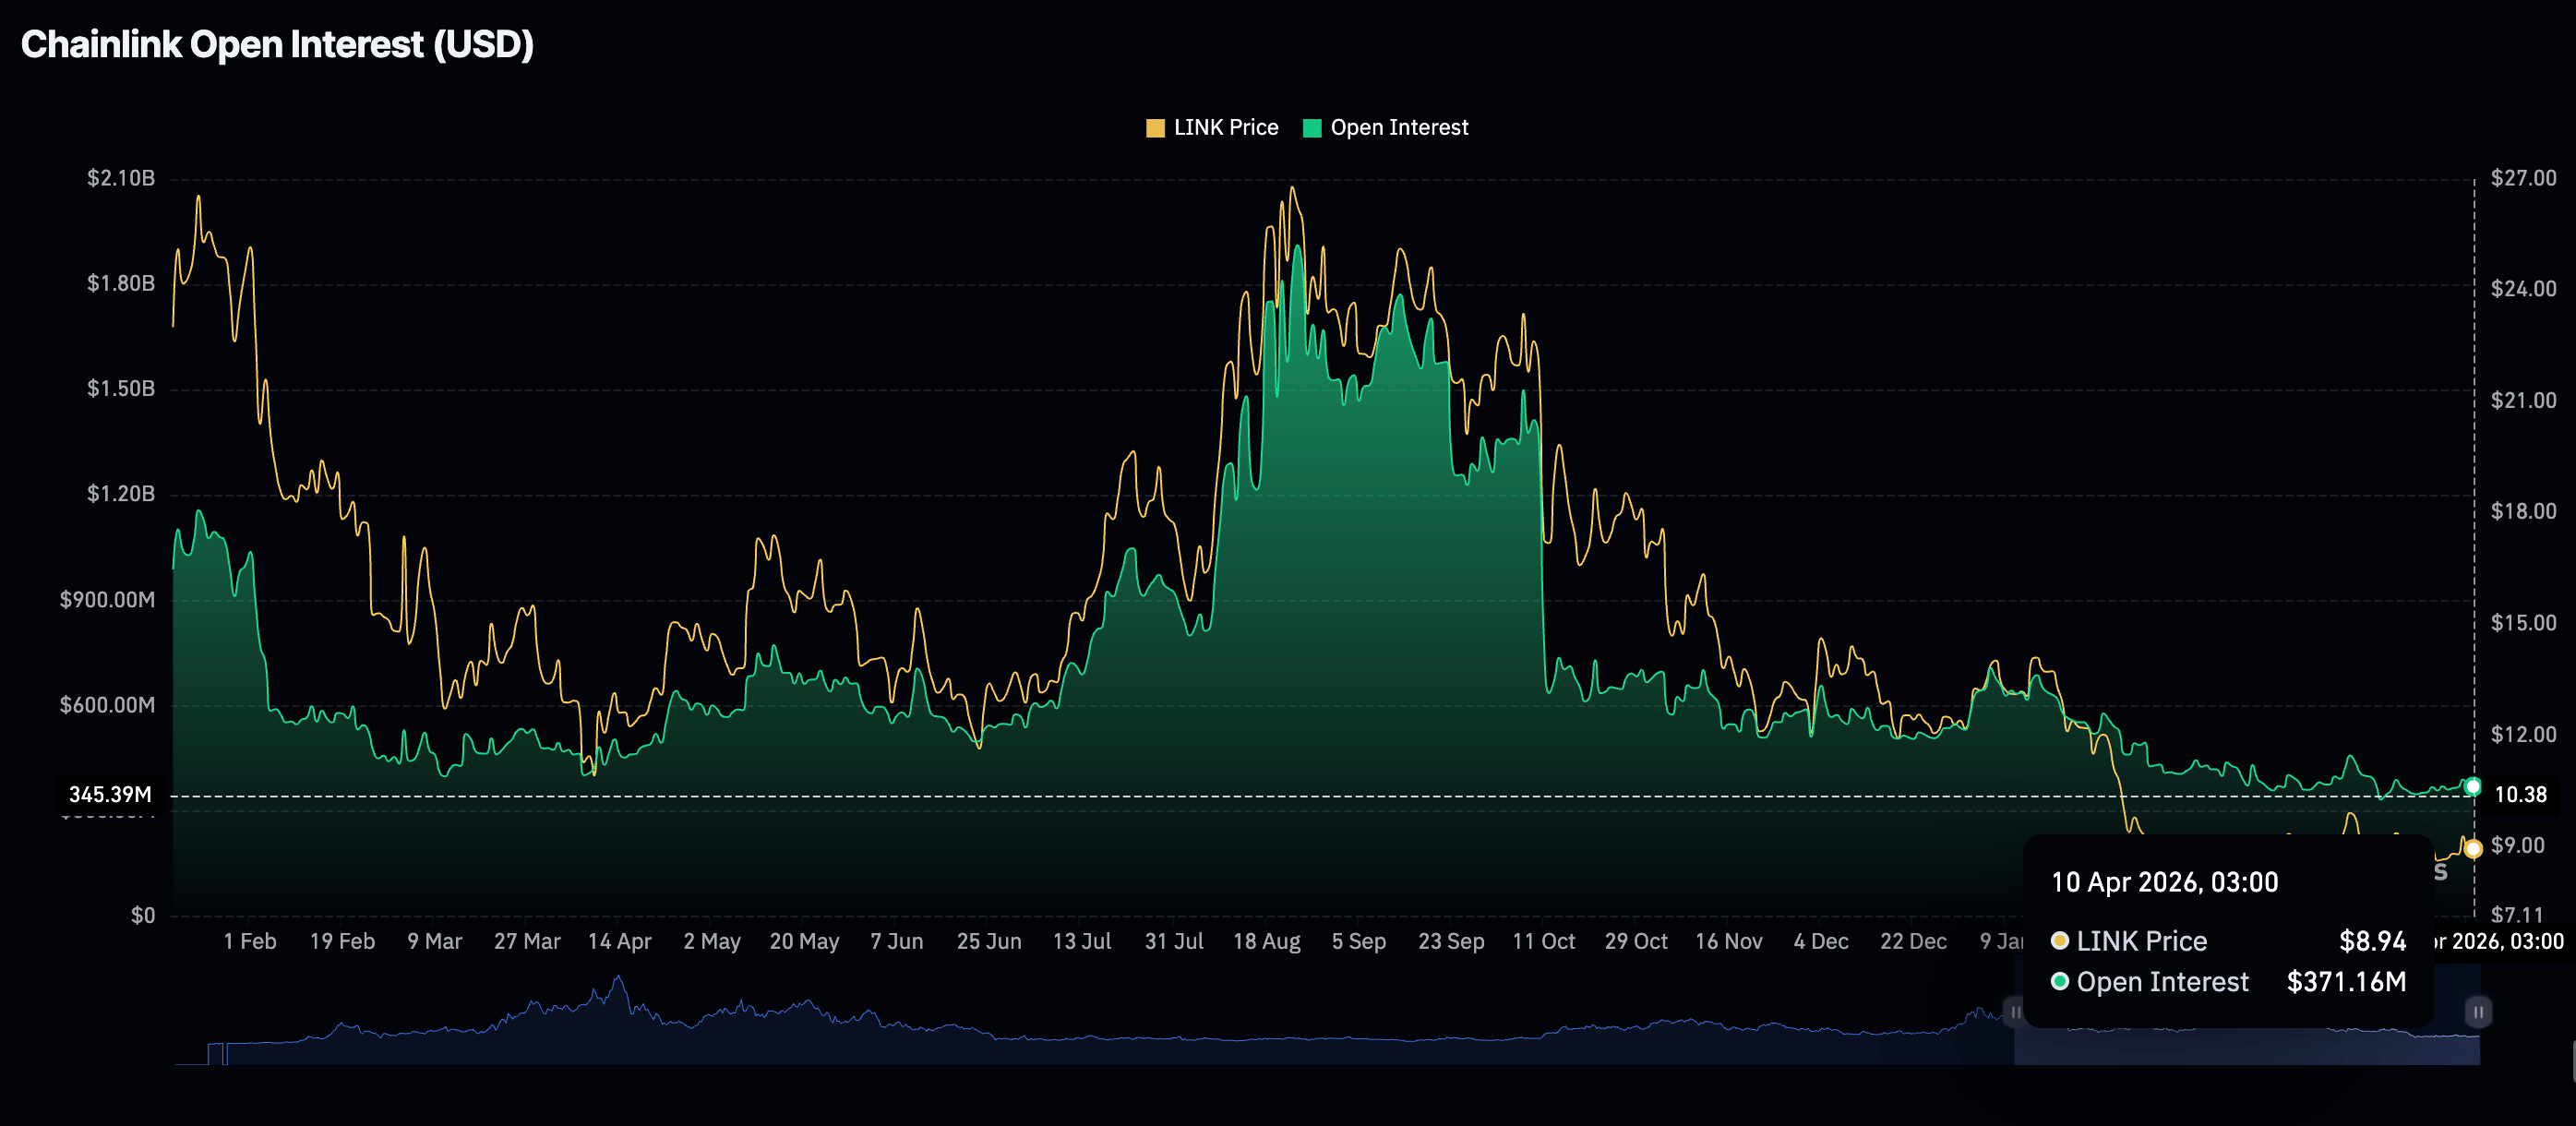
Meanwhile, LINK faces suppressed retail demand, as reflected by futures OI, which reflects the notional value of outstanding futures contracts, shrinking to roughly $371 million on Friday, from around $376 million the previous day. Suppressed futures OI indicates that investors are losing conviction and are unwilling to open new positions.
Technical outlook: Chainlink faces hurdles despite breakout attempt
Chainlink trades at $9.13, keeping a constrained outlook as spot holds below the main moving averages and a dominant downward resistance trendline. The price hovers just under the 50-day Exponential Moving Average (EMA) at $9.16, while the 100-day EMA at $10.19 and the 200-day EMA at $12.08 remain comfortably overhead, suggesting that the broader recovery attempt is still limited within a medium-term downtrend.
Momentum is more constructive, with the Relative Strength Index (RSI) near 54 on the daily chart and the Moving Average Convergence Divergence (MACD) turning positive, yet this improving tone has not been enough to reclaim the nearby moving-average ceiling.
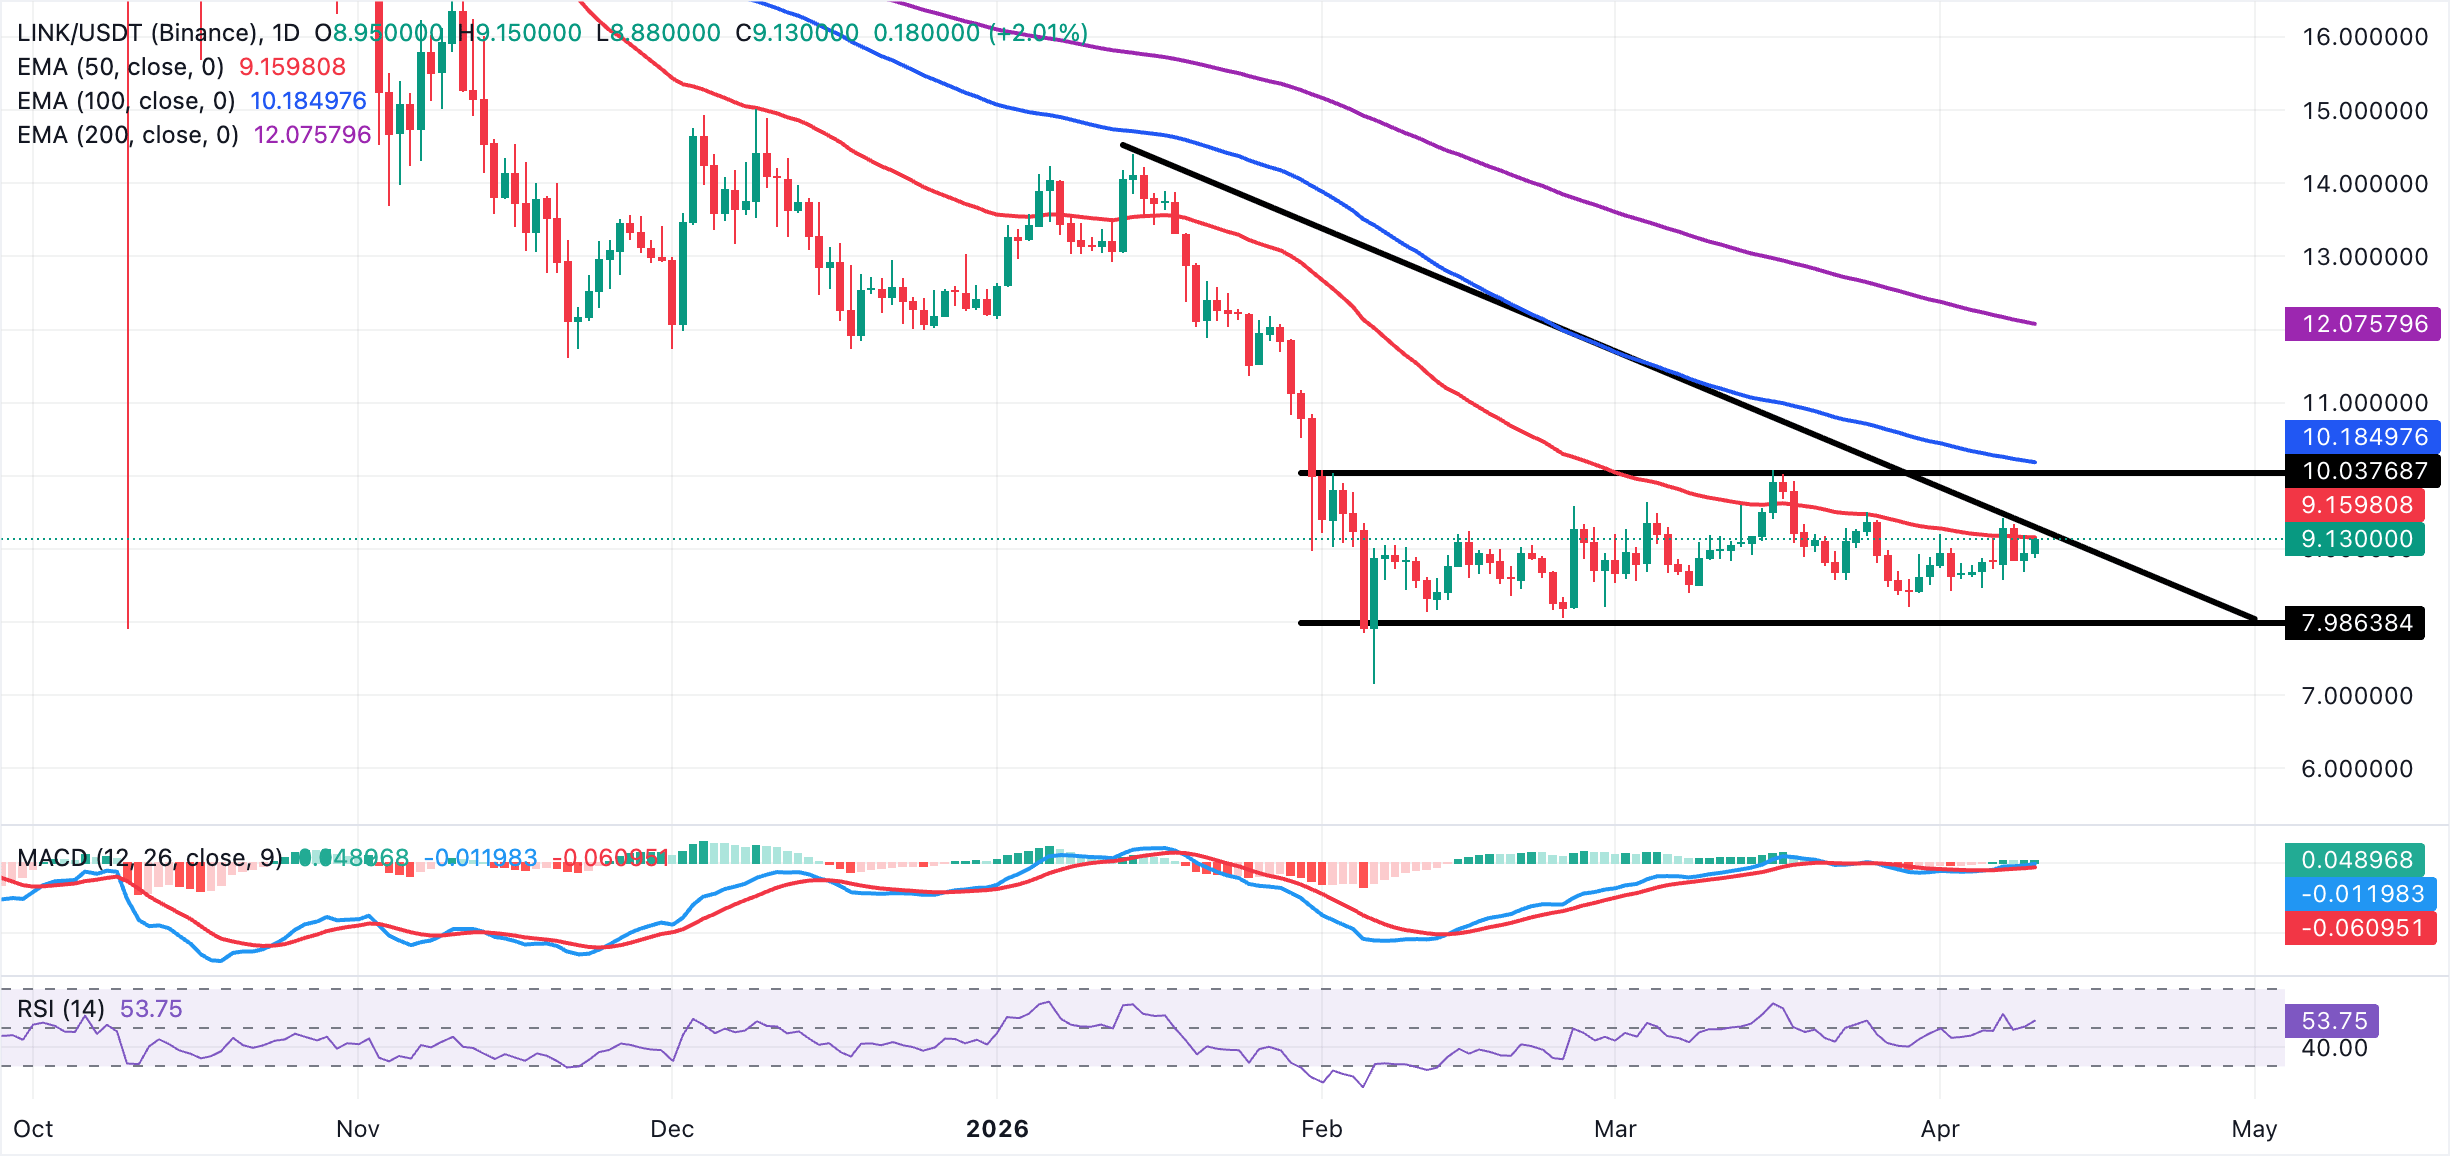
On the topside, immediate resistance is clustered around the 50-day EMA at $9.16, followed by the break zone of the descending trendline near $9.26, where sellers are likely to reassert control on first tests. A sustained push above that area would expose the next bullish target at the 100-day EMA around $10.19, ahead of the more strategic barrier at the 200-day EMA near $12.08.
The lack of clearly defined nearby support levels in the provided metrics leaves the oracle token vulnerable to deeper pullbacks if buyers fail to overcome the $9.16–$9.26 supply band, and traders will need to look to prior swing lows, for instance, $8.68 on the broader chart, for potential demand zones.
Open Interest, funding rate FAQs
Higher Open Interest is associated with higher liquidity and new capital inflow to the market. This is considered the equivalent of increase in efficiency and the ongoing trend continues. When Open Interest decreases, it is considered a sign of liquidation in the market, investors are leaving and the overall demand for an asset is on a decline, fueling a bearish sentiment among investors.
Funding fees bridge the difference between spot prices and prices of futures contracts of an asset by increasing liquidation risks faced by traders. A consistently high and positive funding rate implies there is a bullish sentiment among market participants and there is an expectation of a price hike. A consistently negative funding rate for an asset implies a bearish sentiment, indicating that traders expect the cryptocurrency’s price to fall and a bearish trend reversal is likely to occur.
(The technical analysis of this story was written with the help of an AI tool.)

超过一百万用户依赖 FXStreet 获取实时市场数据、图表工具、专家洞见和外汇新闻。其全面的经济日历和教育网络研讨会帮助交易者保持信息领先、做出审慎决策。FXStreet 拥有约 60 人的团队,分布在巴塞罗那总部及全球各地区。
阅读更多


