
Chainlink Price Forecast: Partnerships, ecosystem growth could fuel LINK recovery
作者 Manish Chhetri
更新: 1 Jul 2026


热门文章

Chainlink (LINK) recovers modestly, trading above $7.30 on Wednesday after weeks of heavy selling pressure. The recovery could strengthen as Arc joined the Chainlink Scale program on Tuesday, boosting ecosystem growth and adoption.
- Chainlink recovers slightly, trading above $7.30 on Wednesday after weeks of sustained selling pressure.
- Arc joins the Chainlink Scale program on Tuesday, boosting ecosystem growth.
- Mixed on-chain and derivatives metrics keep LINK's rebound capped.
Chainlink (LINK) recovers modestly, trading above $7.30 on Wednesday after weeks of heavy selling pressure. The recovery could strengthen as Arc joined the Chainlink Scale program on Tuesday, boosting ecosystem growth and adoption. However, traders should remain cautious, as mixed on-chain and derivatives data continues to cap LINK’s upside.
Growing partnership boosts LINK’s ecosystem growth
Chainlink's official X account announced on Tuesday that Arc, Circle's stablecoin-native Layer-1 blockchain, has joined the Chainlink Scale program. It aims to provide developers with secure access to premium enterprise-grade infrastructure.
On the same day, Theo announced that it had invested $20 million in Fidelity International's FILQ tokenized USD liquidity fund via Sygnum. The investment leverages Chainlink's Runtime Environment to deliver on-chain Net Asset Value (NAV), pricing data from JPMorgan, and fund distribution metrics.
These partnerships and ecosystem developments signal a bullish long-term outlook for Chainlink and its native token, LINK, boosting ecosystem growth and bolstering investor confidence.
However, in the short term, it failed to lift LINK prices, as the price consolidated after the previous week's correction.
Mixed on-chain and derivatives caps recovery
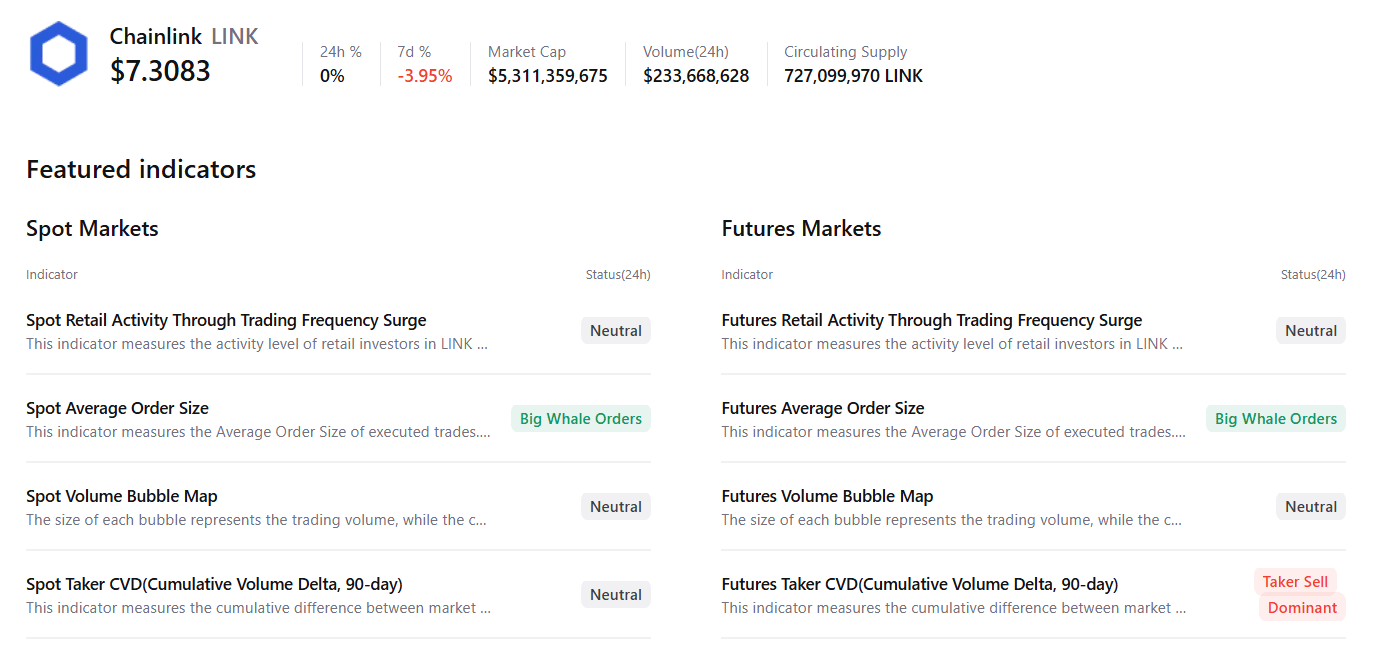
CryptoQuant’s summary data shows mixed sentiment. Chainlink’s spot and futures markets show large whales' orders, suggesting a positive outlook, while the futures market shows sell-side dominance, suggesting a negative bias. This mixed bias suggests cautious sentiment among traders and is capping any potential recovery.
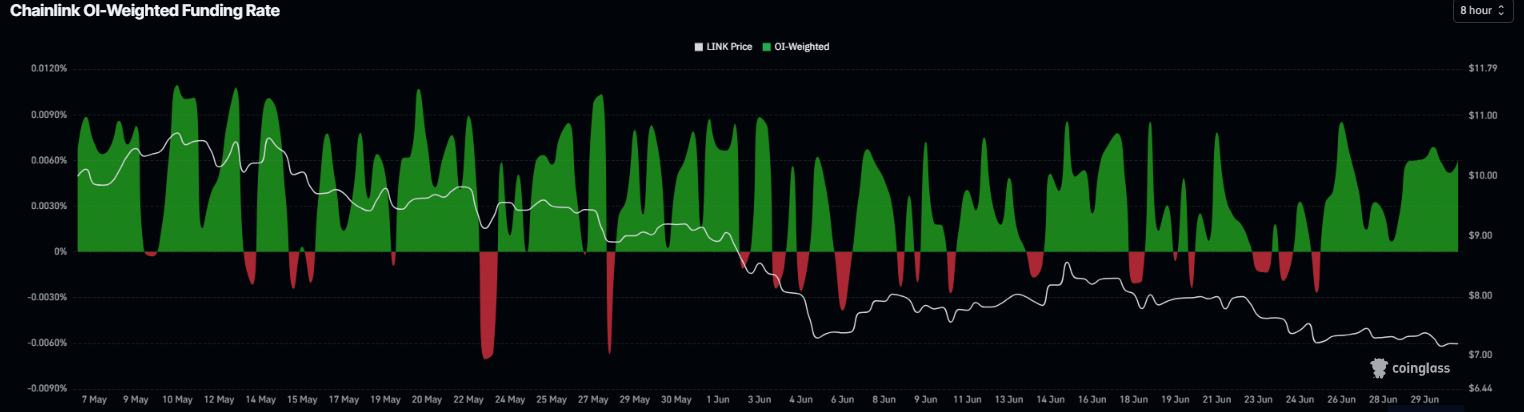
On the derivative side, sentiment also remains mixed. Chainlink’s funding rates turned positive on Thursday, reading 0.0060% on Wednesday, indicating that longs are paying the shorts and suggesting a bullish bias.
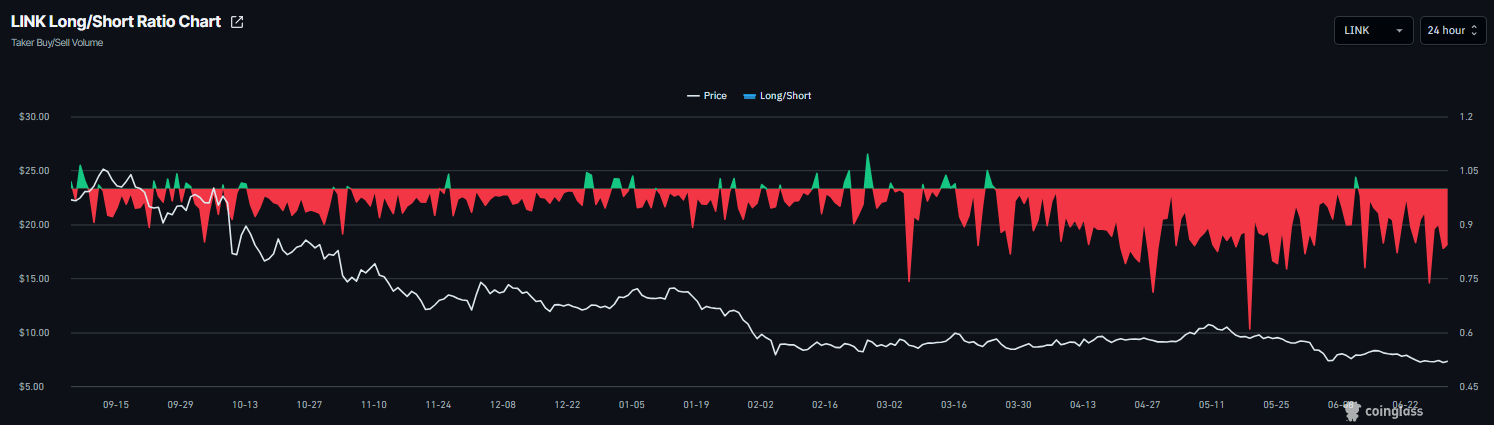
However, Coinglass long-to-short ratio for LINK read 0.84 on Wednesday, nearing its lowest levels in over a month. This ratio, being below 1, reflects bearish sentiment in the market, as more traders are betting the asset’s price will fall.
Chainlink Price Forecast: Fading bearish momentum could lift prices
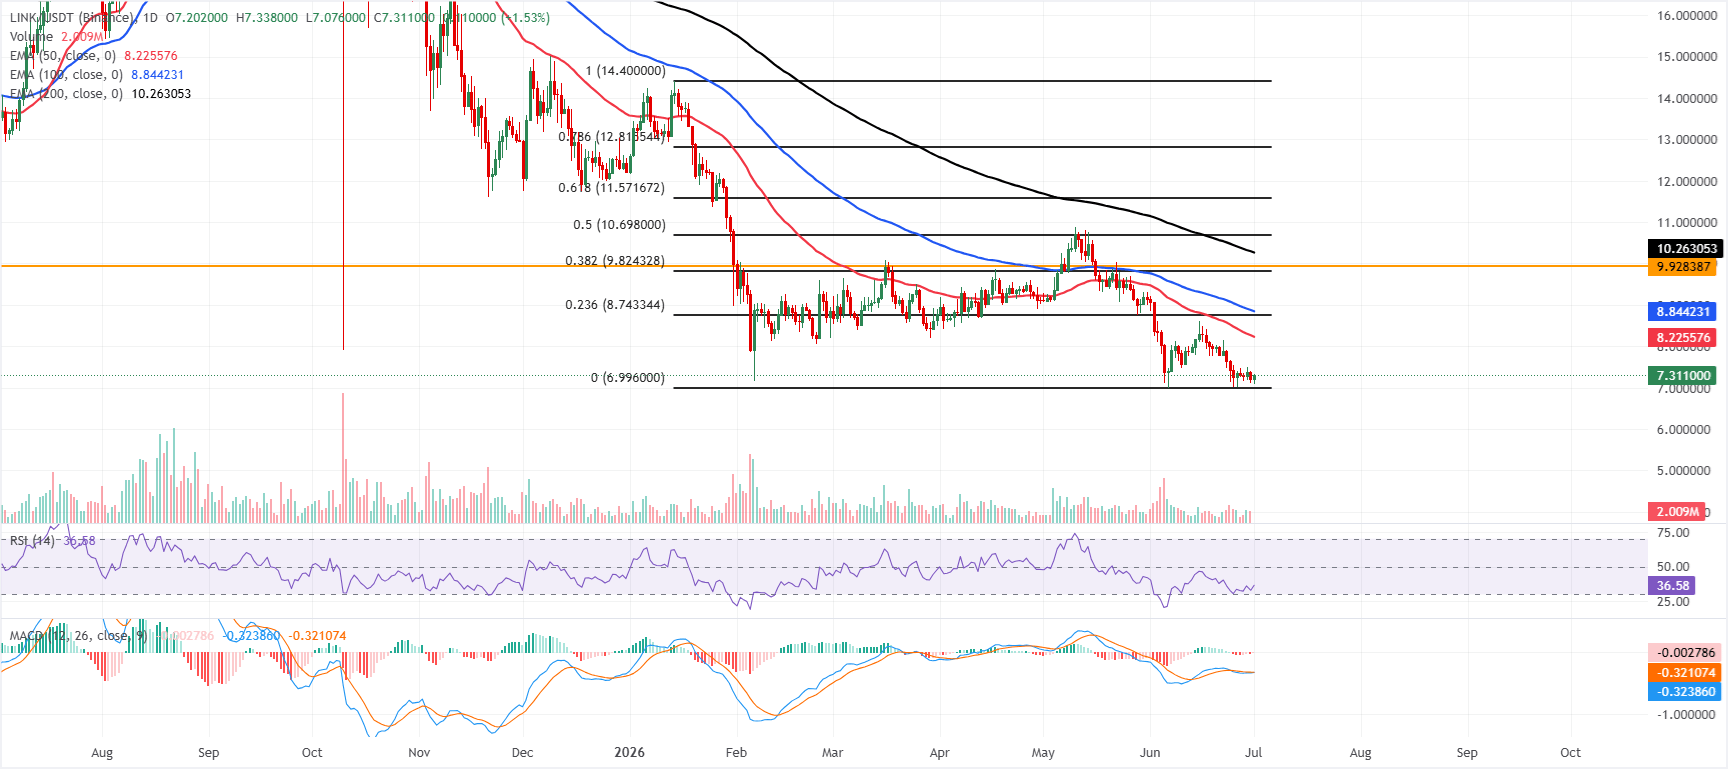
Chainlink trades at $7.31 on Wednesday, maintaining a bearish bias as the price remains well below the 50-day, 100-day, and 200-day Exponential Moving Averages (EMAs), clustered between roughly $8.23 and $10.26.
The Relative Strength Index (RSI) at about 37 remains in weak territory, while the slightly negative Moving Average Convergence Divergence (MACD) hints at fading downside momentum rather than a decisive turn, suggesting any recovery attempts are likely to face overhead supply.
On the topside, initial resistance emerges at the 50-day EMA near $8.22, followed by the 23.6% Fibonacci retracement at $8.74 and the 100-day EMA around $8.84. Above there, the 38.2% Fibonacci retracement at $9.82 and the horizontal cap near $9.93 precede the heavier band formed by the 200-day EMA at $10.26.
On the downside, immediate support is seen near the recent anchor around $6.99; a break below this zone would reopen the path to fresh lows in the broader corrective phase.
(The technical analysis of this story was written with the help of an AI tool.)

超过一百万用户依赖 FXStreet 获取实时市场数据、图表工具、专家洞见和外汇新闻。其全面的经济日历和教育网络研讨会帮助交易者保持信息领先、做出审慎决策。FXStreet 拥有约 60 人的团队,分布在巴塞罗那总部及全球各地区。
阅读更多


