
Chiliz Price Forecast: CHZ extends correction below $0.040 as bearish momentum intensifies
作者 Manish Chhetri
发布日期: 10 Feb 2026 | 修改日期: 10 Feb 2026


热门文章

Chiliz (CHZ) price extends its correction, trading below $0.040 at the time of writing on Tuesday, after falling through a key resistance level set the previous day.
- Chiliz price extends its correction on Tuesday after failing to break a key resistance area on Monday.
- On-chain and derivatives data signal bearish sentiment prevails, with rising retail activity, overheating conditions, sell dominance and increasing short bets.
- The technical outlook indicates weakness in momentum indicators, suggesting a deeper correction ahead.
Chiliz (CHZ) price extends its correction, trading below $0.040 at the time of writing on Tuesday, after falling through a key resistance level set the previous day. The bearish sentiment around CHZ intensifies, with on-chain and derivatives data showing weak conditions, and the technical outlook is unfavorable.
Chiliz on-chain and derivatives data point to further downside
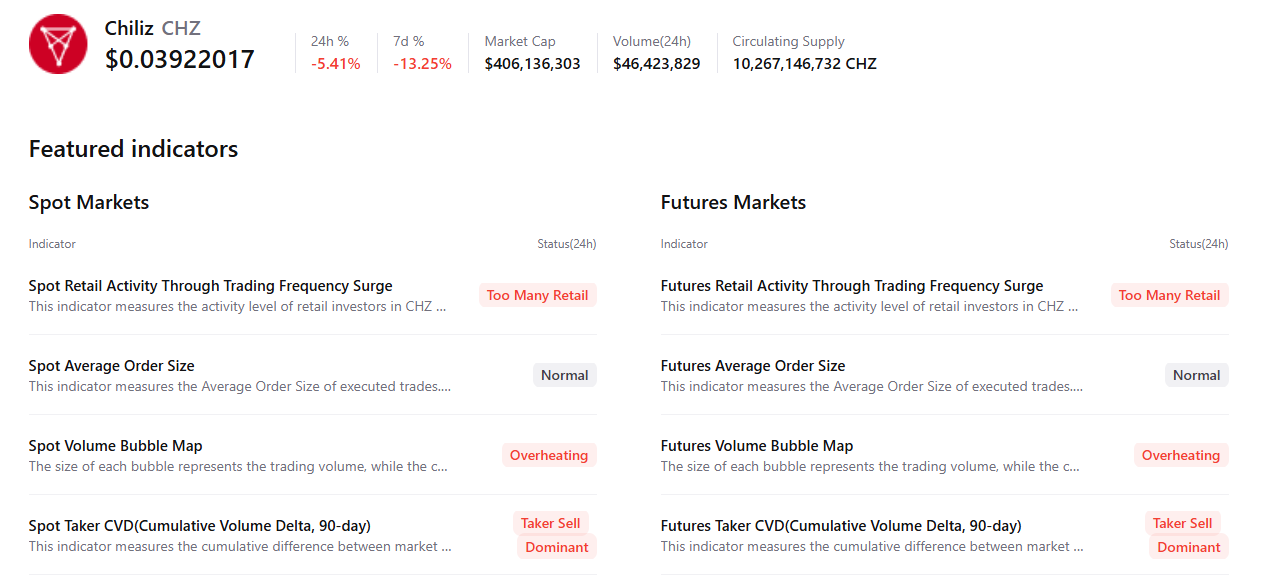
CryptoQuant’s summary data supports a bearish outlook for CHZ. Both spot and futures markets show signs of rising retail activity, overheating, and seller dominance, suggesting a potential correction ahead.
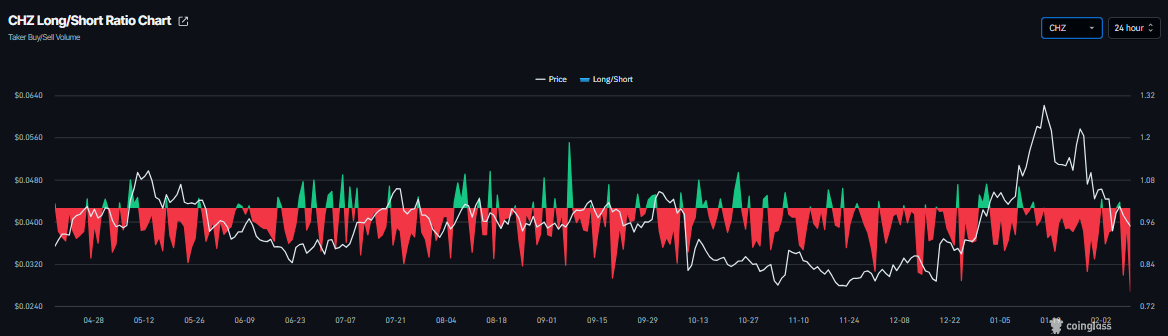
On the derivatives side, data from Coinglass shows that CHZ’s long-to-short ratio is at 0.76 on Tuesday, the lowest level in over a month. This ratio, being below one, indicates bearish sentiment in the market, as more traders are betting on CHZ’s price to fall.
Chiliz Price Forecast: CHZ momentum indicators support a deeper correction
Chiliz price has been in a downward trend since mid-January after failing to overcome the weekly resistance at $0.063. CHZ price faced resistance around two Exponential Moving Averages (EMAs) – the 100-day at $0.042 and 200-day at $0.041 – on Sunday, and declined by more than 6% through Monday. At the time of writing on Tuesday, CHZ is trading at around $0.039.
If CHZ continues its downward trend, it could extend the correction toward the daily support at $0.037.
The Relative Strength Index (RSI) reads 38, below its neutral level of 50, and points downward, indicating that bearish momentum is gaining traction. Moreover, the Moving Average Convergence Divergence (MACD) showed a bearish crossover on January 21, which remains intact, further supporting the negative outlook.
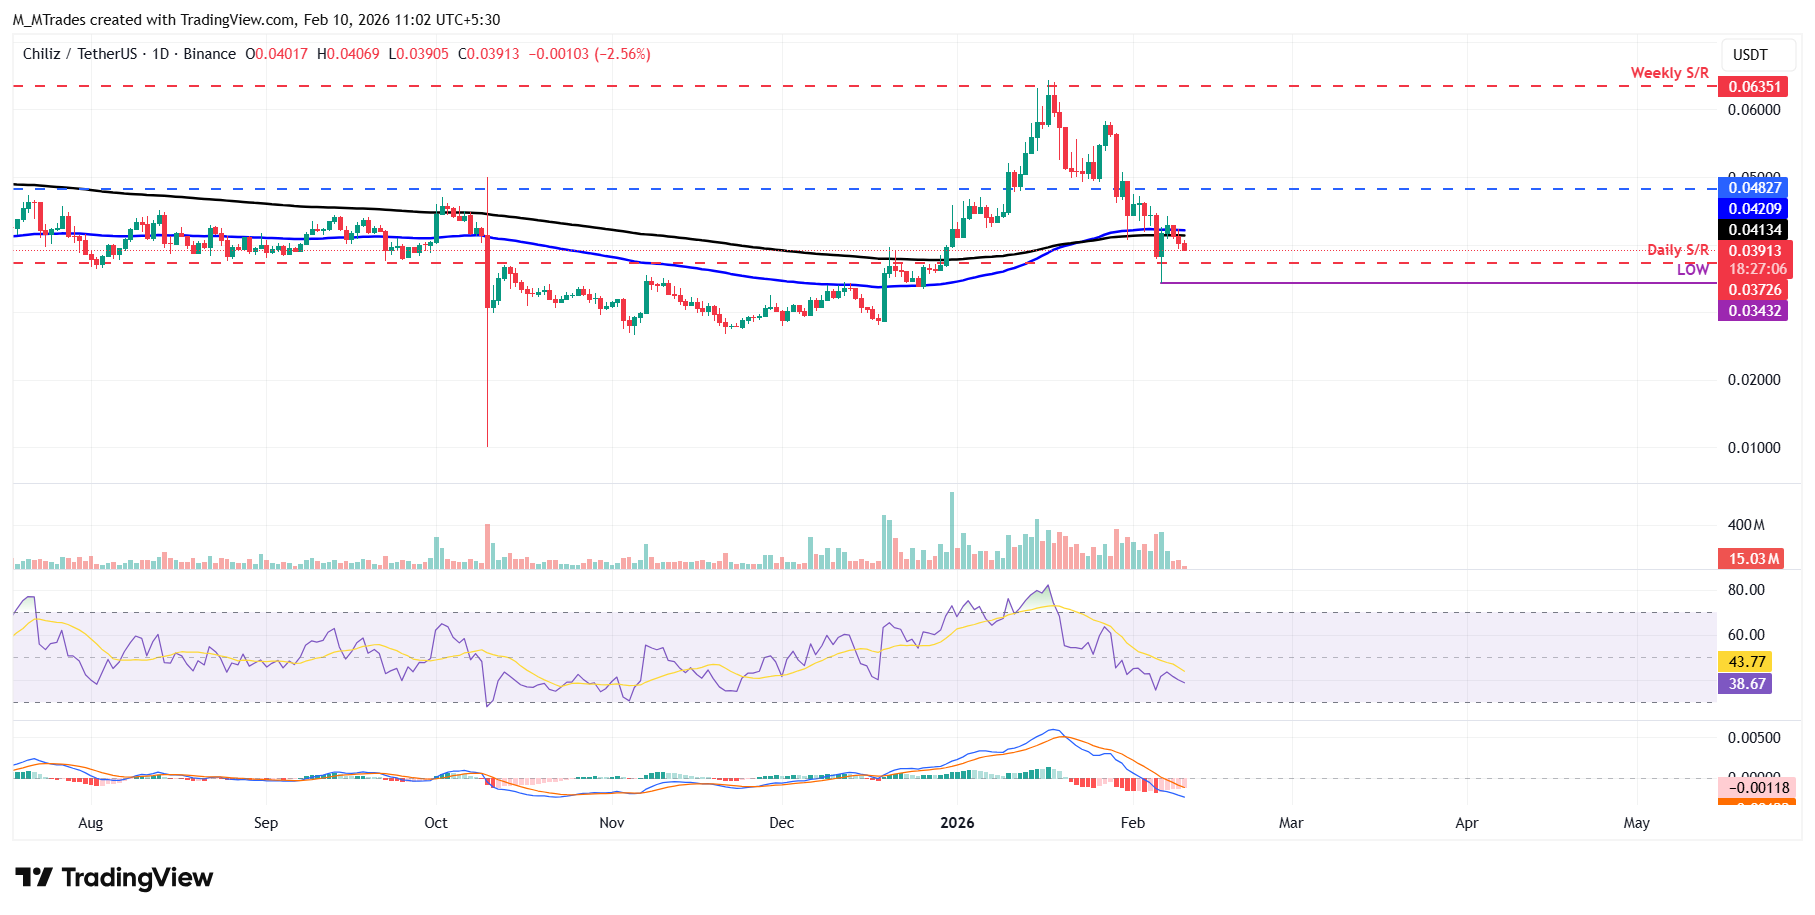
Any chances of a recovery hinge on CHZ closing above the 100-day EMA at $0.042. If this level is cleared, the next resistance would be found at $0.048.

超过一百万用户依赖 FXStreet 获取实时市场数据、图表工具、专家洞见和外汇新闻。其全面的经济日历和教育网络研讨会帮助交易者保持信息领先、做出审慎决策。FXStreet 拥有约 60 人的团队,分布在巴塞罗那总部及全球各地区。
阅读更多


