
Chiliz Price Forecast: CHZ gains momentum following a technical bullish breakout
作者 Manish Chhetri
更新: 10 Mar 2026


热门文章

Chiliz (CHZ) is showing signs of strength, trading above $0.040 as of writing on Tuesday after breaking out of a falling wedge, a technical pattern often associated with bullish reversals.
- Chiliz price is nearing the cluster of EMAs on Tuesday, after breaking above the falling wedge pattern.
- Mixed on-chain conditions with a slight bullish tilt could extend the recovery.
- Momentum indicators signal a strengthening bull trend with a potential upside continuation if CHZ clears the EMA resistance zone.
Chiliz (CHZ) is showing signs of strength, trading above $0.040 as of writing on Tuesday after breaking out of a falling wedge, a technical pattern often associated with bullish reversals. On-chain data projects a mixed outlook with a slight bullish tilt, while strengthening momentum indicators suggest the altcoin could extend its upward trend if buying pressure persists.
Mixed outlook with a slight bullish tilt suggests improving sentiment for CHZ
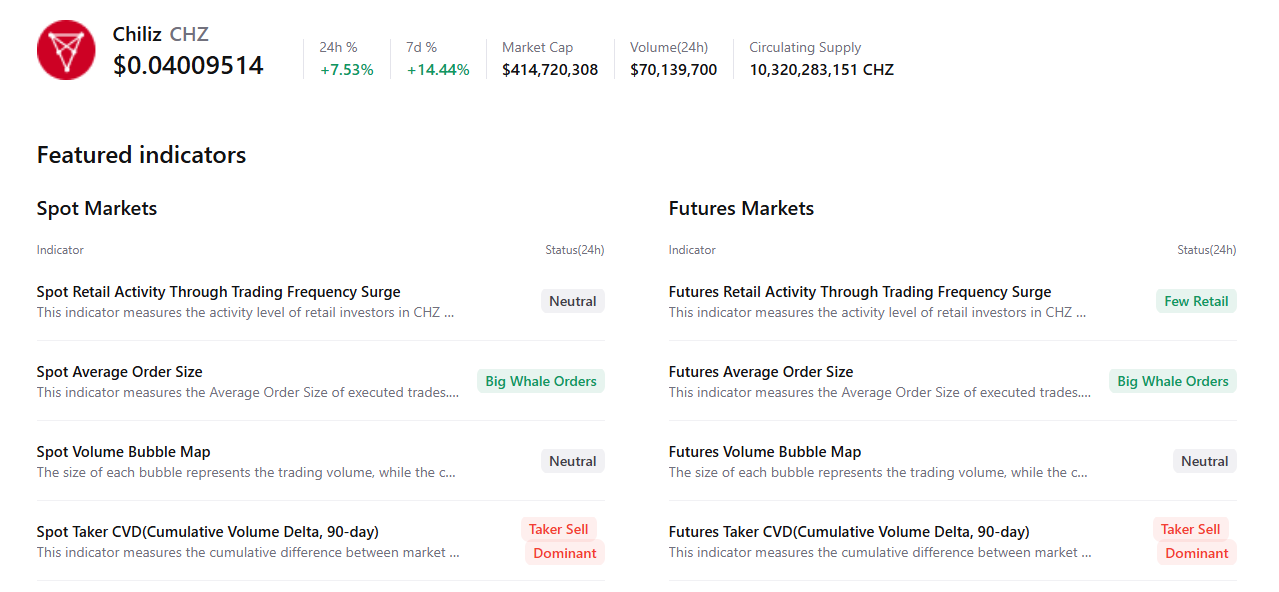
Chiliz’s CryptoQuant summary data shows mixed conditions with early signs of bullishness. The presence of large whale orders and few retail traders in the market suggests a slightly optimistic outlook for CHZ. However, activity across both spot and futures markets suggests sellers’ dominance, reflecting slight negative sentiment among investors.
Santiment’s Social Dominance metric for Chiliz supports a positive outlook. The index measures the share of CHZ-related discussions across the cryptocurrency media. It has been in an upward trend since early March, reading 0.016% on Tuesday, the highest level since early February. This rise indicates growing market interest and strengthening sentiment among CHZ investors.
 [09-1773118818108-1773118818109.02.09, 10 Mar, 2026].png)
Chiliz Price Forecast: Bulls are in control
Chiliz price trades above $0.040 as of Tuesday. The near-term bias tilts mildly bullish as price holds above the recently broken falling wedge pattern, signaling a shift away from the prior downtrend. The latest candles trade back over the 50- and 100-day EMAs clustered around $0.039–0.040, indicating emerging trend support after the rebound from $0.034, the upper boundary of the pattern.
Momentum also improves, with the Relative Strength Index (RSI) on the daily chart rising above 50 and the Moving Average Convergence Divergence (MACD) line crossing above its signal line into positive territory, suggesting strengthening upside pressure.
Initial support now sits at $0.037, ahead of the deeper horizontal level at $0.027. On the upside, a sustained close above the recent $0.040–$0.041 band would open the way toward the mid-February reaction high near $0.043, followed by the $0.045 region where prior supply emerged along the former trendline.
(The technical analysis of this story was written with the help of an AI tool.)

超过一百万用户依赖 FXStreet 获取实时市场数据、图表工具、专家洞见和外汇新闻。其全面的经济日历和教育网络研讨会帮助交易者保持信息领先、做出审慎决策。FXStreet 拥有约 60 人的团队,分布在巴塞罗那总部及全球各地区。
阅读更多


