
Cross-chain trials on Pi Network's testnet hint at bullish PI breakout
作者 Vishal Dixit
更新: 13 May 2026


热门文章
Pi Network (PI) is trading in the red on Wednesday, extending its consolidation within a descending wedge pattern on the 4-hour chart.
- Pi Network consolidates above $0.1700 on Wednesday, tapering within a descending wedge pattern.
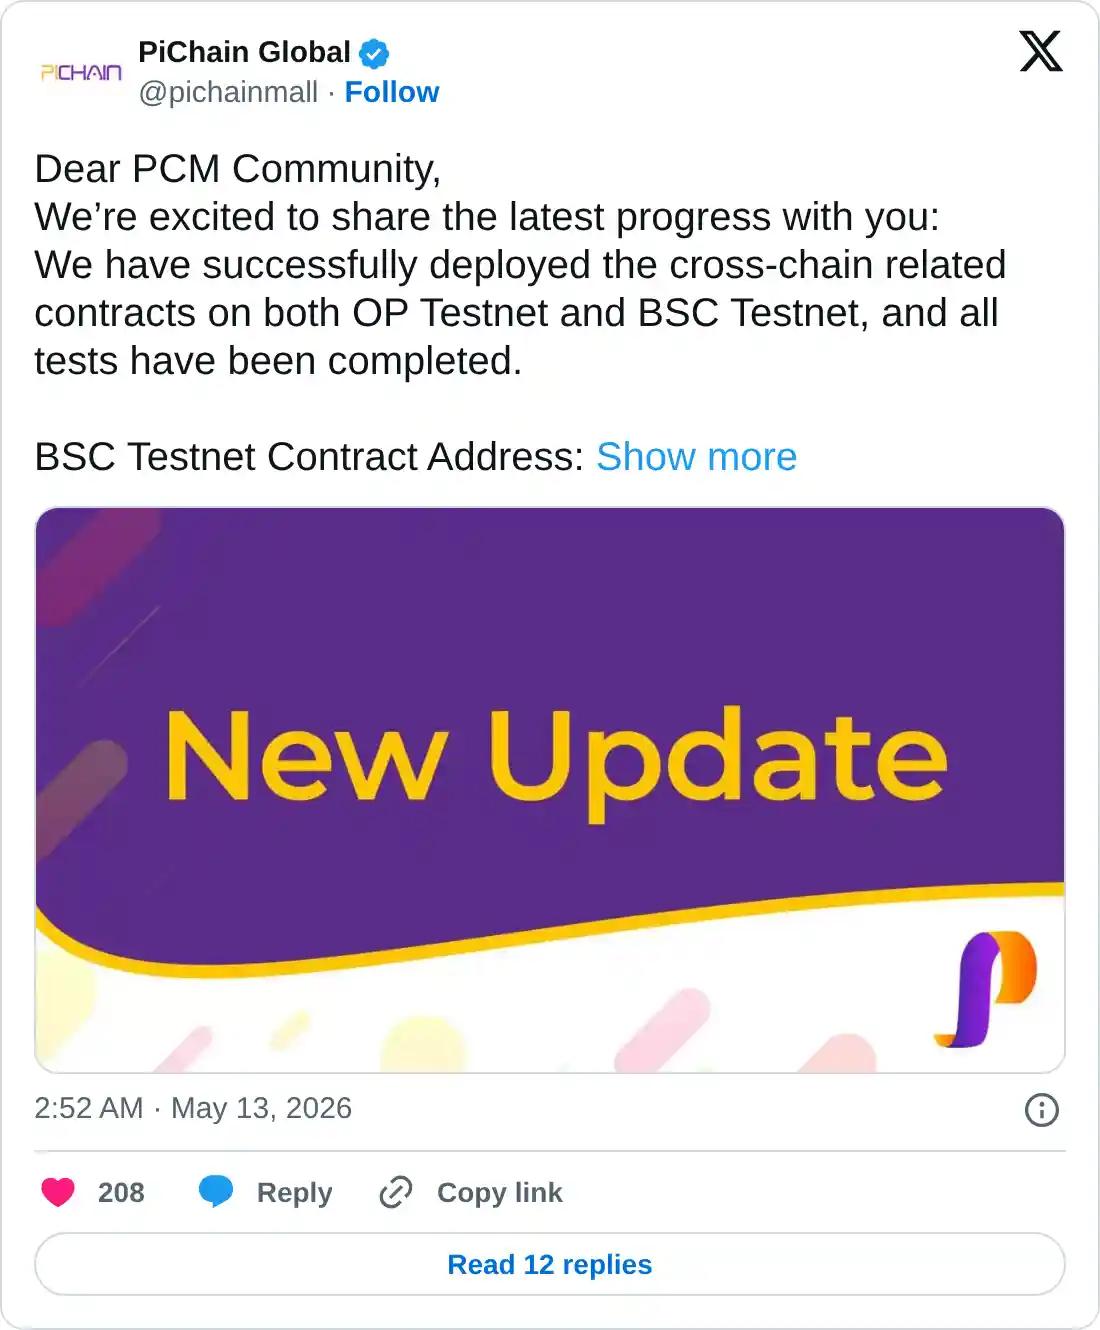
- PiChain Global, an e-commerce platform built on Pi Network, deploys cross-chain contracts on BSC and OP testnets.
- The technical outlook for PI is mildly bullish, as the RSI shows positive divergence.
Pi Network (PI) is trading in the red on Wednesday, extending its consolidation within a descending wedge pattern on the 4-hour chart. PiChain Global, an e-commerce platform within the Pi Network ecosystem, deployed cross-chain contracts on the BSC and OP testnets, highlighting the new capabilities enabled by the ongoing mainnet upgrades.
The technical outlook for PI is mildly bullish, as the 4-hour Relative Strength Index (RSI) indicator shows a positive divergence while price holds above $0.1700, signaling a potential upside breakout from the descending wedge pattern.
Pi ecosystem tests new mainnet capabilities
PiChain Global announced in an X post on Wednesday that it successfully deployed cross-chain smart contracts across two different blockchain testnets of BSC, previously known as Binance Smart Chain, and Optimism’s OP testnet built on Ethereum. PiChain aims to expand this cross-chain functionality to its PCM wallet, while temporarily pausing its Meeta social app due to limited resources.
Cross-chain functionality is enabled by the Pi Core Team’s push for the mainnet upgrade, which has reached Stellar Protocol v23 on Pi Network’s testnet. Meanwhile, the mainnet nodes must complete the Protocol v23 upgrade by Friday to remain connected to the network. A successful transition would unlock similar cross-chain functionality on the mainnet, expanding the PI token’s utility.

Technical outlook: Is Pi Network ready for a bullish breakthrough?
Pi Network shows a consolidating trend between the $0.1700 round figure and the May 9 high at $0.1766 on the 4-hour chart. The consolidation is capped by an overhead trendline that connects the highs of April 29 and May 6, while the lows of April 30 and May 8 form a support trendline. These converging trendlines form a falling wedge pattern, which typically leads to an upside breakout, suggesting mildly constructive momentum.
Momentum on the 4-hour chart shows short-term recovery. The Moving Average Convergence Divergence (MACD) trails above its signal line, with the histogram bars remaining positive and contracting toward the zero line. Meanwhile, the Relative Strength Index (RSI) at 46 shows a steady rise in the mid-range, while the price holds above $0.1700, signaling a positive divergence.
On the topside, immediate resistance aligns with the short-term descending trendline clustered around $0.1766. A sustained break above this line would be needed to ease the current cap and open the way toward the May 6 high at $0.0.1881.
On the downside, initial support lies near $0.1700, followed by the active descending support trendline near $0.1670, where a break lower would expose a deeper pullback and weaken the broader consolidation structure.
(The technical analysis of this story was written with the help of an AI tool.)

超过一百万用户依赖 FXStreet 获取实时市场数据、图表工具、专家洞见和外汇新闻。其全面的经济日历和教育网络研讨会帮助交易者保持信息领先、做出审慎决策。FXStreet 拥有约 60 人的团队,分布在巴塞罗那总部及全球各地区。
阅读更多


