
Crypto Market Overview: Bitcoin below $67,000 as bears resurface – Algorand, Render, Quant show resilience
作者 Vishal Dixit
更新: 3 Apr 2026


热门文章

Bitcoin (BTC) faces renewed selling pressure, extending losses below $67,000 at press time on Friday, pulling down Ethereum (ETH) and Ripple (XRP) to $2,050 and $1.30, respectively. Derivatives data shows an increase in bearish inclination among traders amid the broader market risk-off sentiment.
- Bitcoin extends losses below $67,000 on Friday, weighing down Ethereum and XRP to $2,050 and $1.30, respectively.
- Data shows an increase in short-sided positional buildup amid risk-off market sentiment.
- Algorand, Render, and Quant show resilience amid broader market correction, securing double-digit gains over the last 24 hours.
Bitcoin (BTC) faces renewed selling pressure, extending losses below $67,000 at press time on Friday, pulling down Ethereum (ETH) and Ripple (XRP) to $2,050 and $1.30, respectively. Derivatives data shows an increase in bearish inclination among traders amid the broader market risk-off sentiment. Despite this, Algorand (ALGO), Render (RENDER), and Quant (QNT) have secured double-digit gains over the last 24 hours, reflecting resilience.
The US-Iran war, high oil prices, and inflation risk
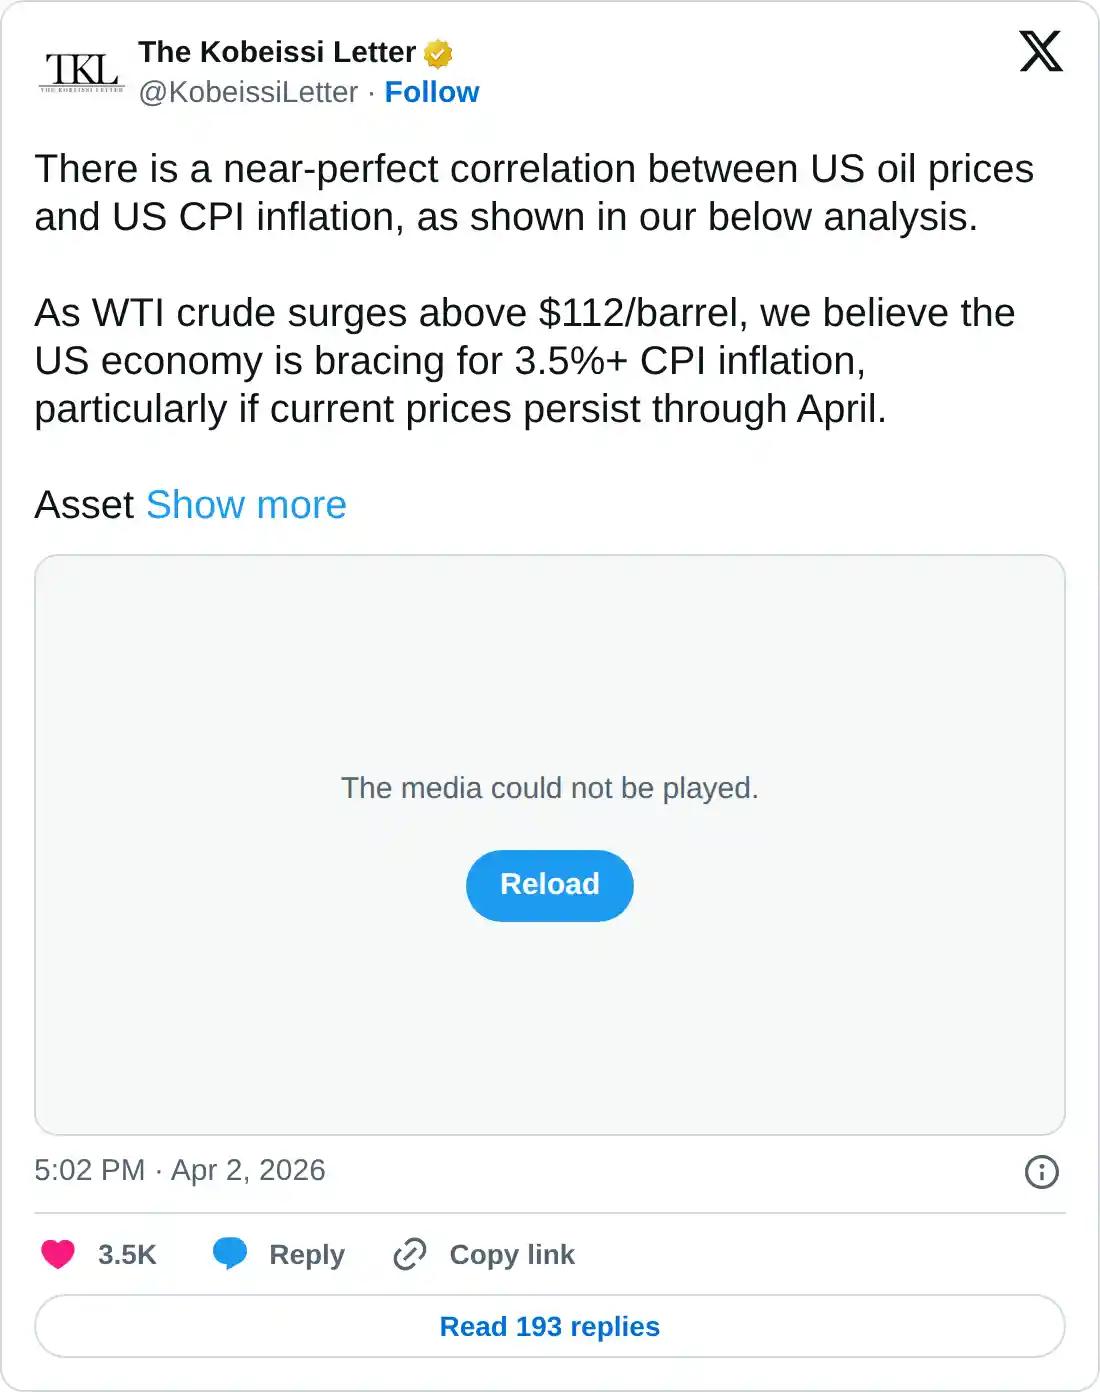
Bitcoin is gradually approaching Monday’s open price around $66,000 under renewed selling pressure, risking gains from earlier this week with a bearish weekend. Downside pressure is linked to the US-Iran war, which is fueling oil prices and threatening to heighten US inflation. According to The Kobessi Letter, the intense correlation between US oil prices and CPI inflation projects the possibility of inflation rising to 3.5%.
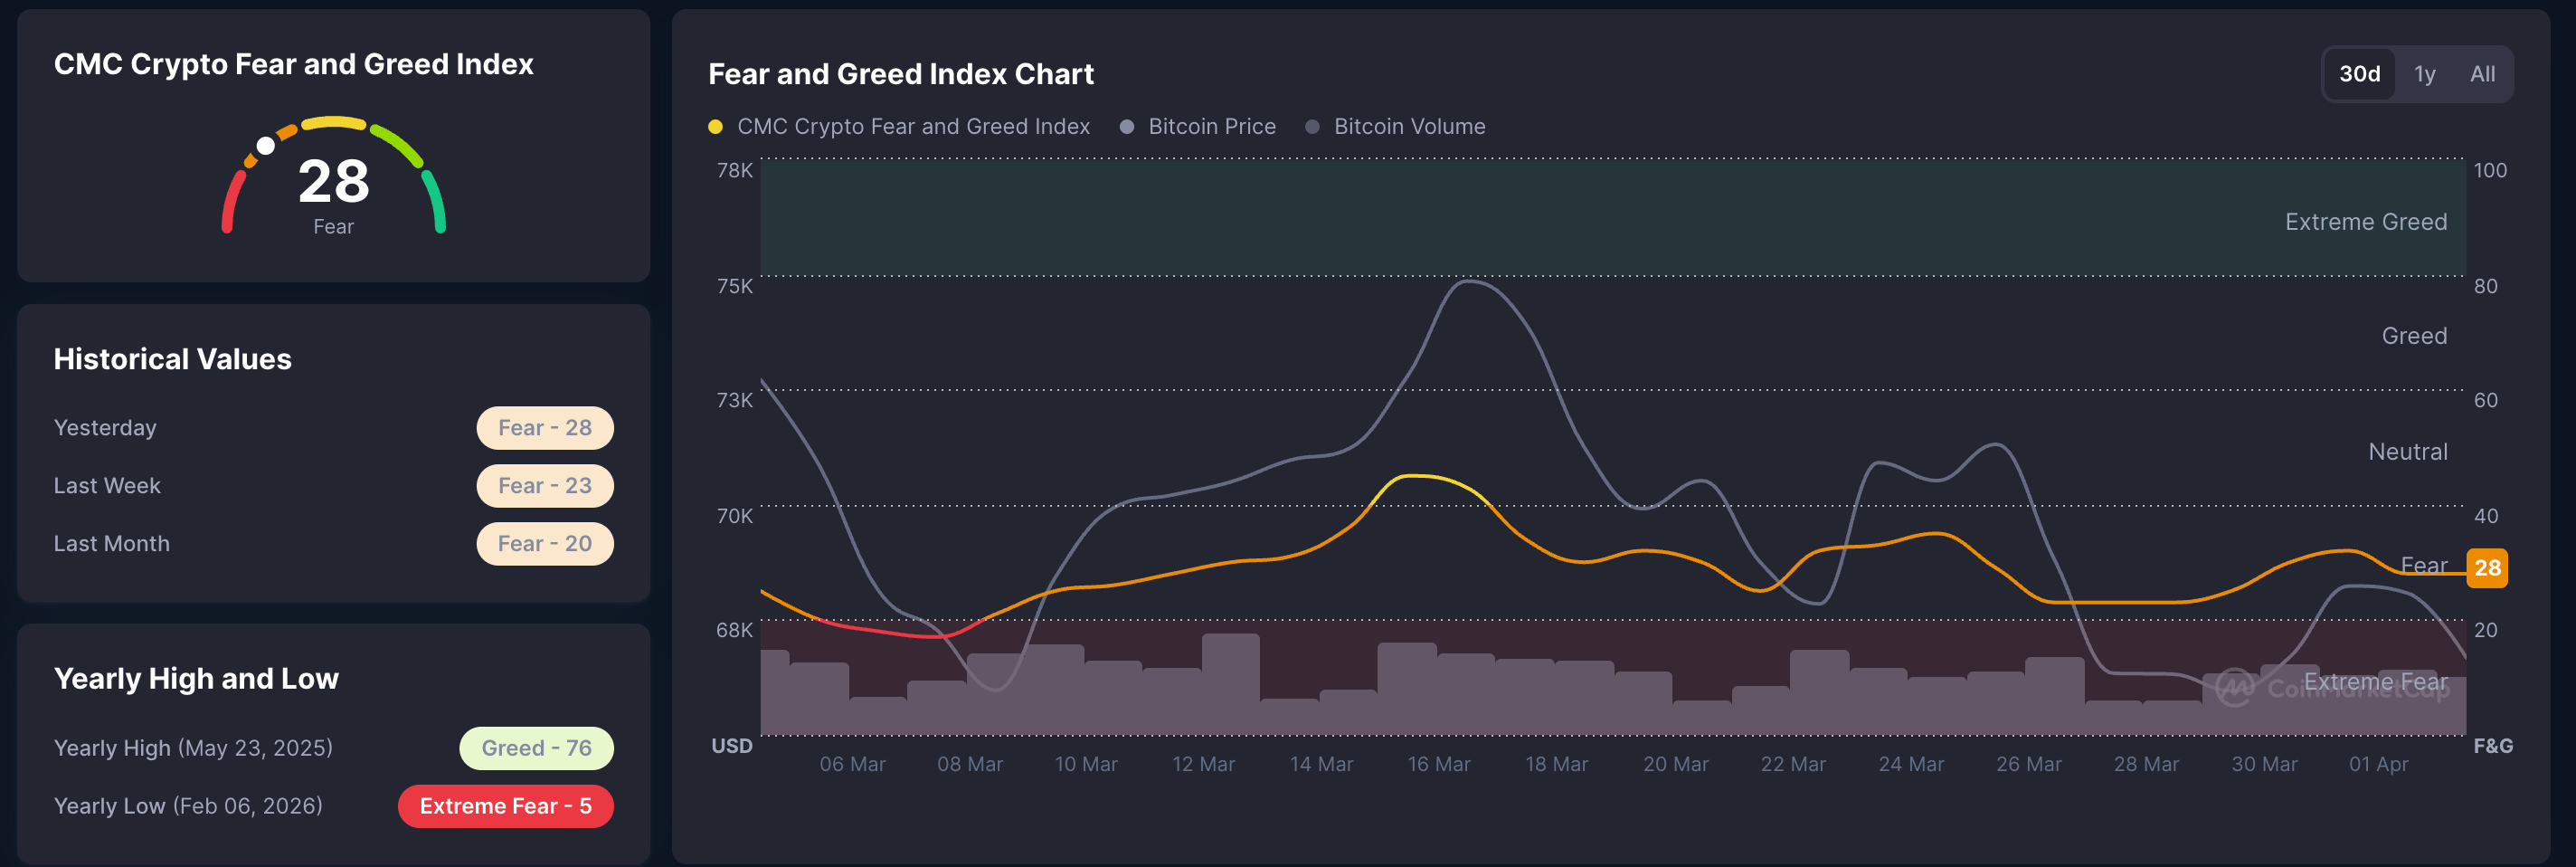
CoinMarketCap’s Fear and Greed Index at 28 on Friday shows the market sentiment remains risk-averse after a minor spike to neutral levels in mid-March.
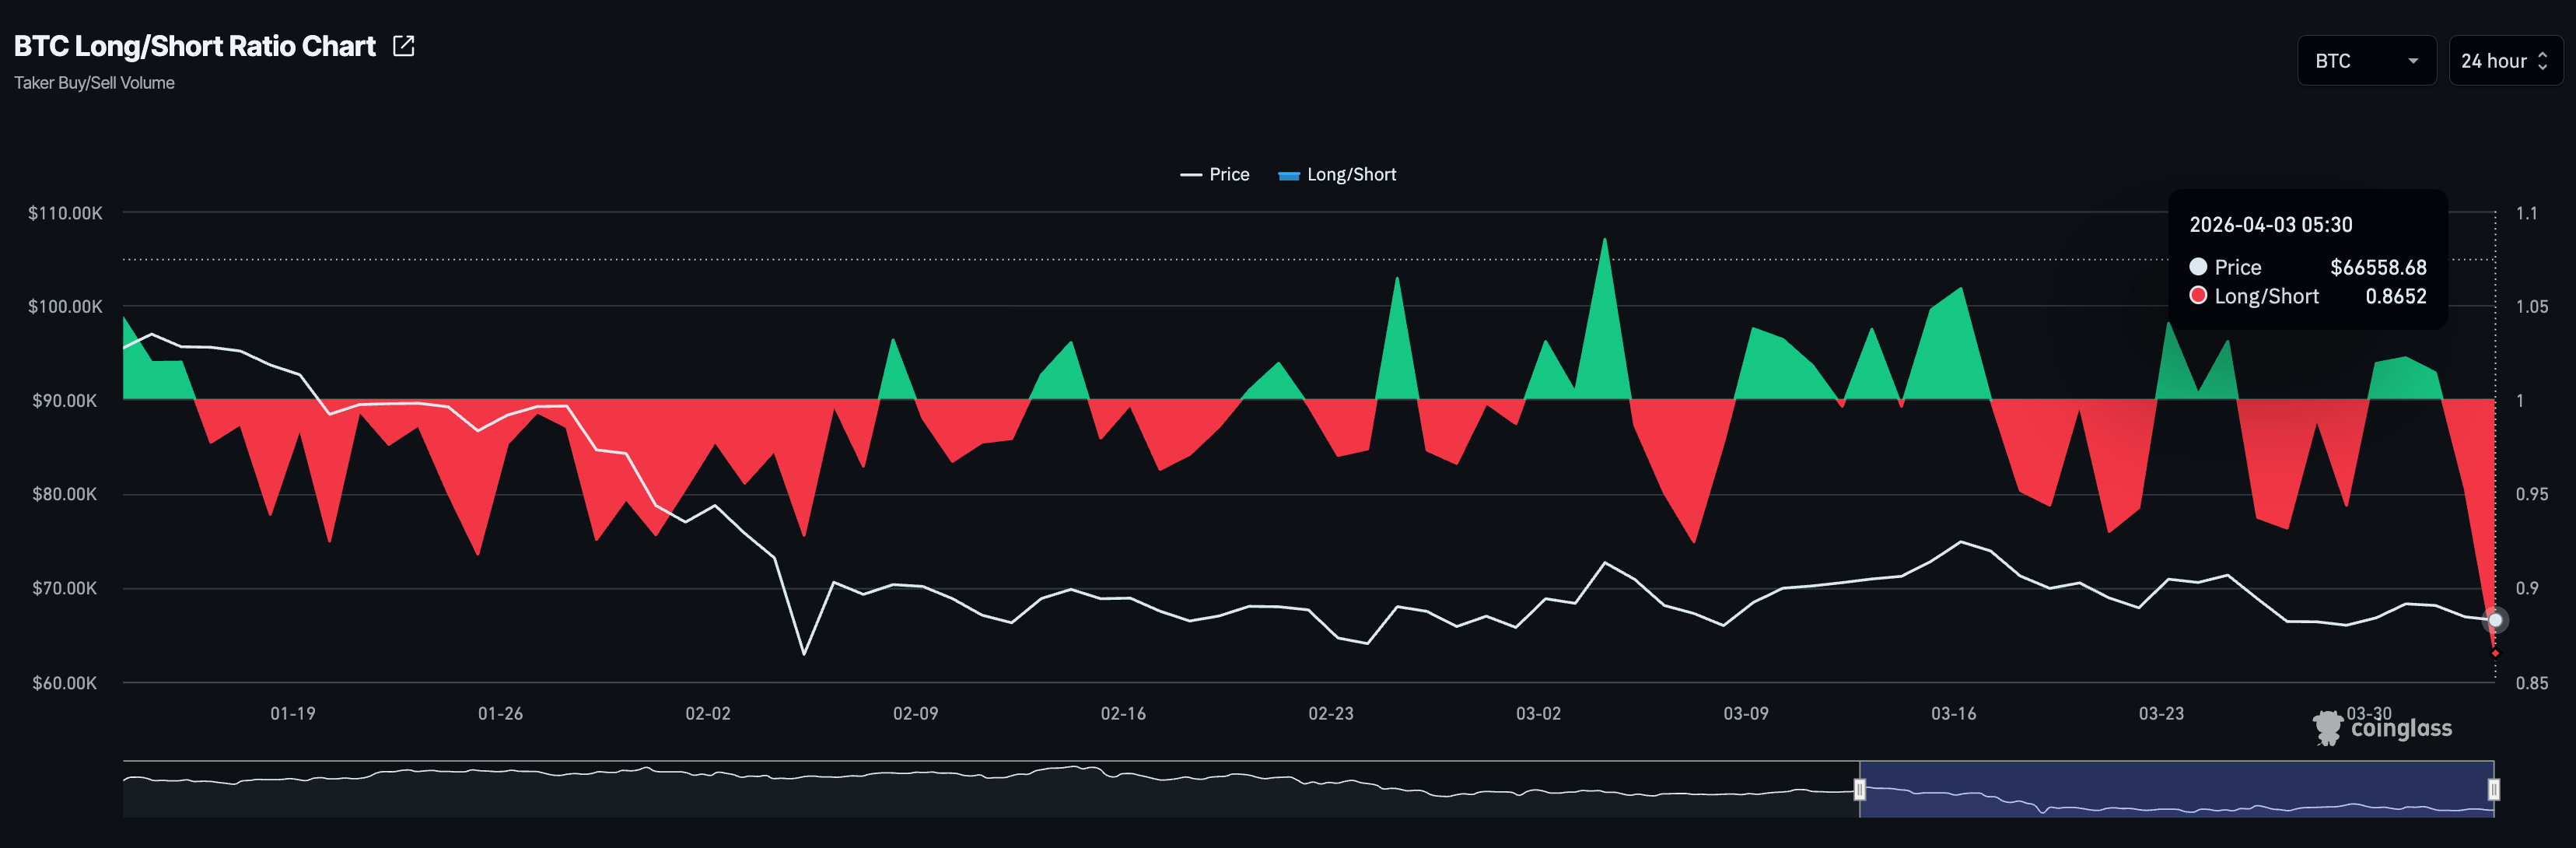
Amid this macro pressure, CoinGlass data shows the Bitcoin long-to-short ratio dropping to 0.8652, suggesting traders are betting against the King Crypto and are anticipating a further correction in the near term.
Top Crypto Gainers: ALGO, RENDER, and QNT rise against pressure
Algorand extends gains by over 7% at press time on Friday, holding a steady rise so far this week. The near‑term bias turns bullish as ALGO breaks above the long‑running descending trend line that had capped rallies from the $0.1456 high, with the latest candle also reclaiming the 100‑day Exponential Moving Average at $0.1062. The move unfolds against a still‑declining 200‑day EMA, framing the advance as an emerging recovery within a broader downtrend.
Momentum readings back the upside tilt, as the Relative Strength Index (RSI) at 75 pushes into overbought territory above 70 and the Moving Average Convergence Divergence (MACD) line extends above its signal in positive territory with a widening histogram, indicating strengthening buying pressure.
A daily close above the 50.0% retracement at $0.1130, measured from the $0.1456 high to the $0.0807 low, would open the door to the 78.6% Fibonacci retracement level at $0.1283, close to the 200-day EMA at $0.1323.
Immediate support is now seen at the 100-day EMA at $0.1062, followed by the 50-day EMA at $0.0936.
Render trades around $1.9010 at press time on Friday. The near-term bias turns mildly bullish as price extends above the 50- and 100-day EMA, suggesting improving trend conditions despite the 200-day average still capping the broader structure overhead.
The MACD line has crossed above its signal near the zero line and the histogram is turning positive, hinting at recovering upside momentum. The RSI at 64 is in positive territory without overbought readings, reinforcing a bias toward further gains rather than immediate exhaustion.
Initial resistance emerges at the 50.0% Fibonacci retracement at $1.92, measured from the $2.71 high to the $1.12 low, with a break higher opening the way toward the 61.8% retracement at $2.11 and then the descending 200-day EMA near that zone.
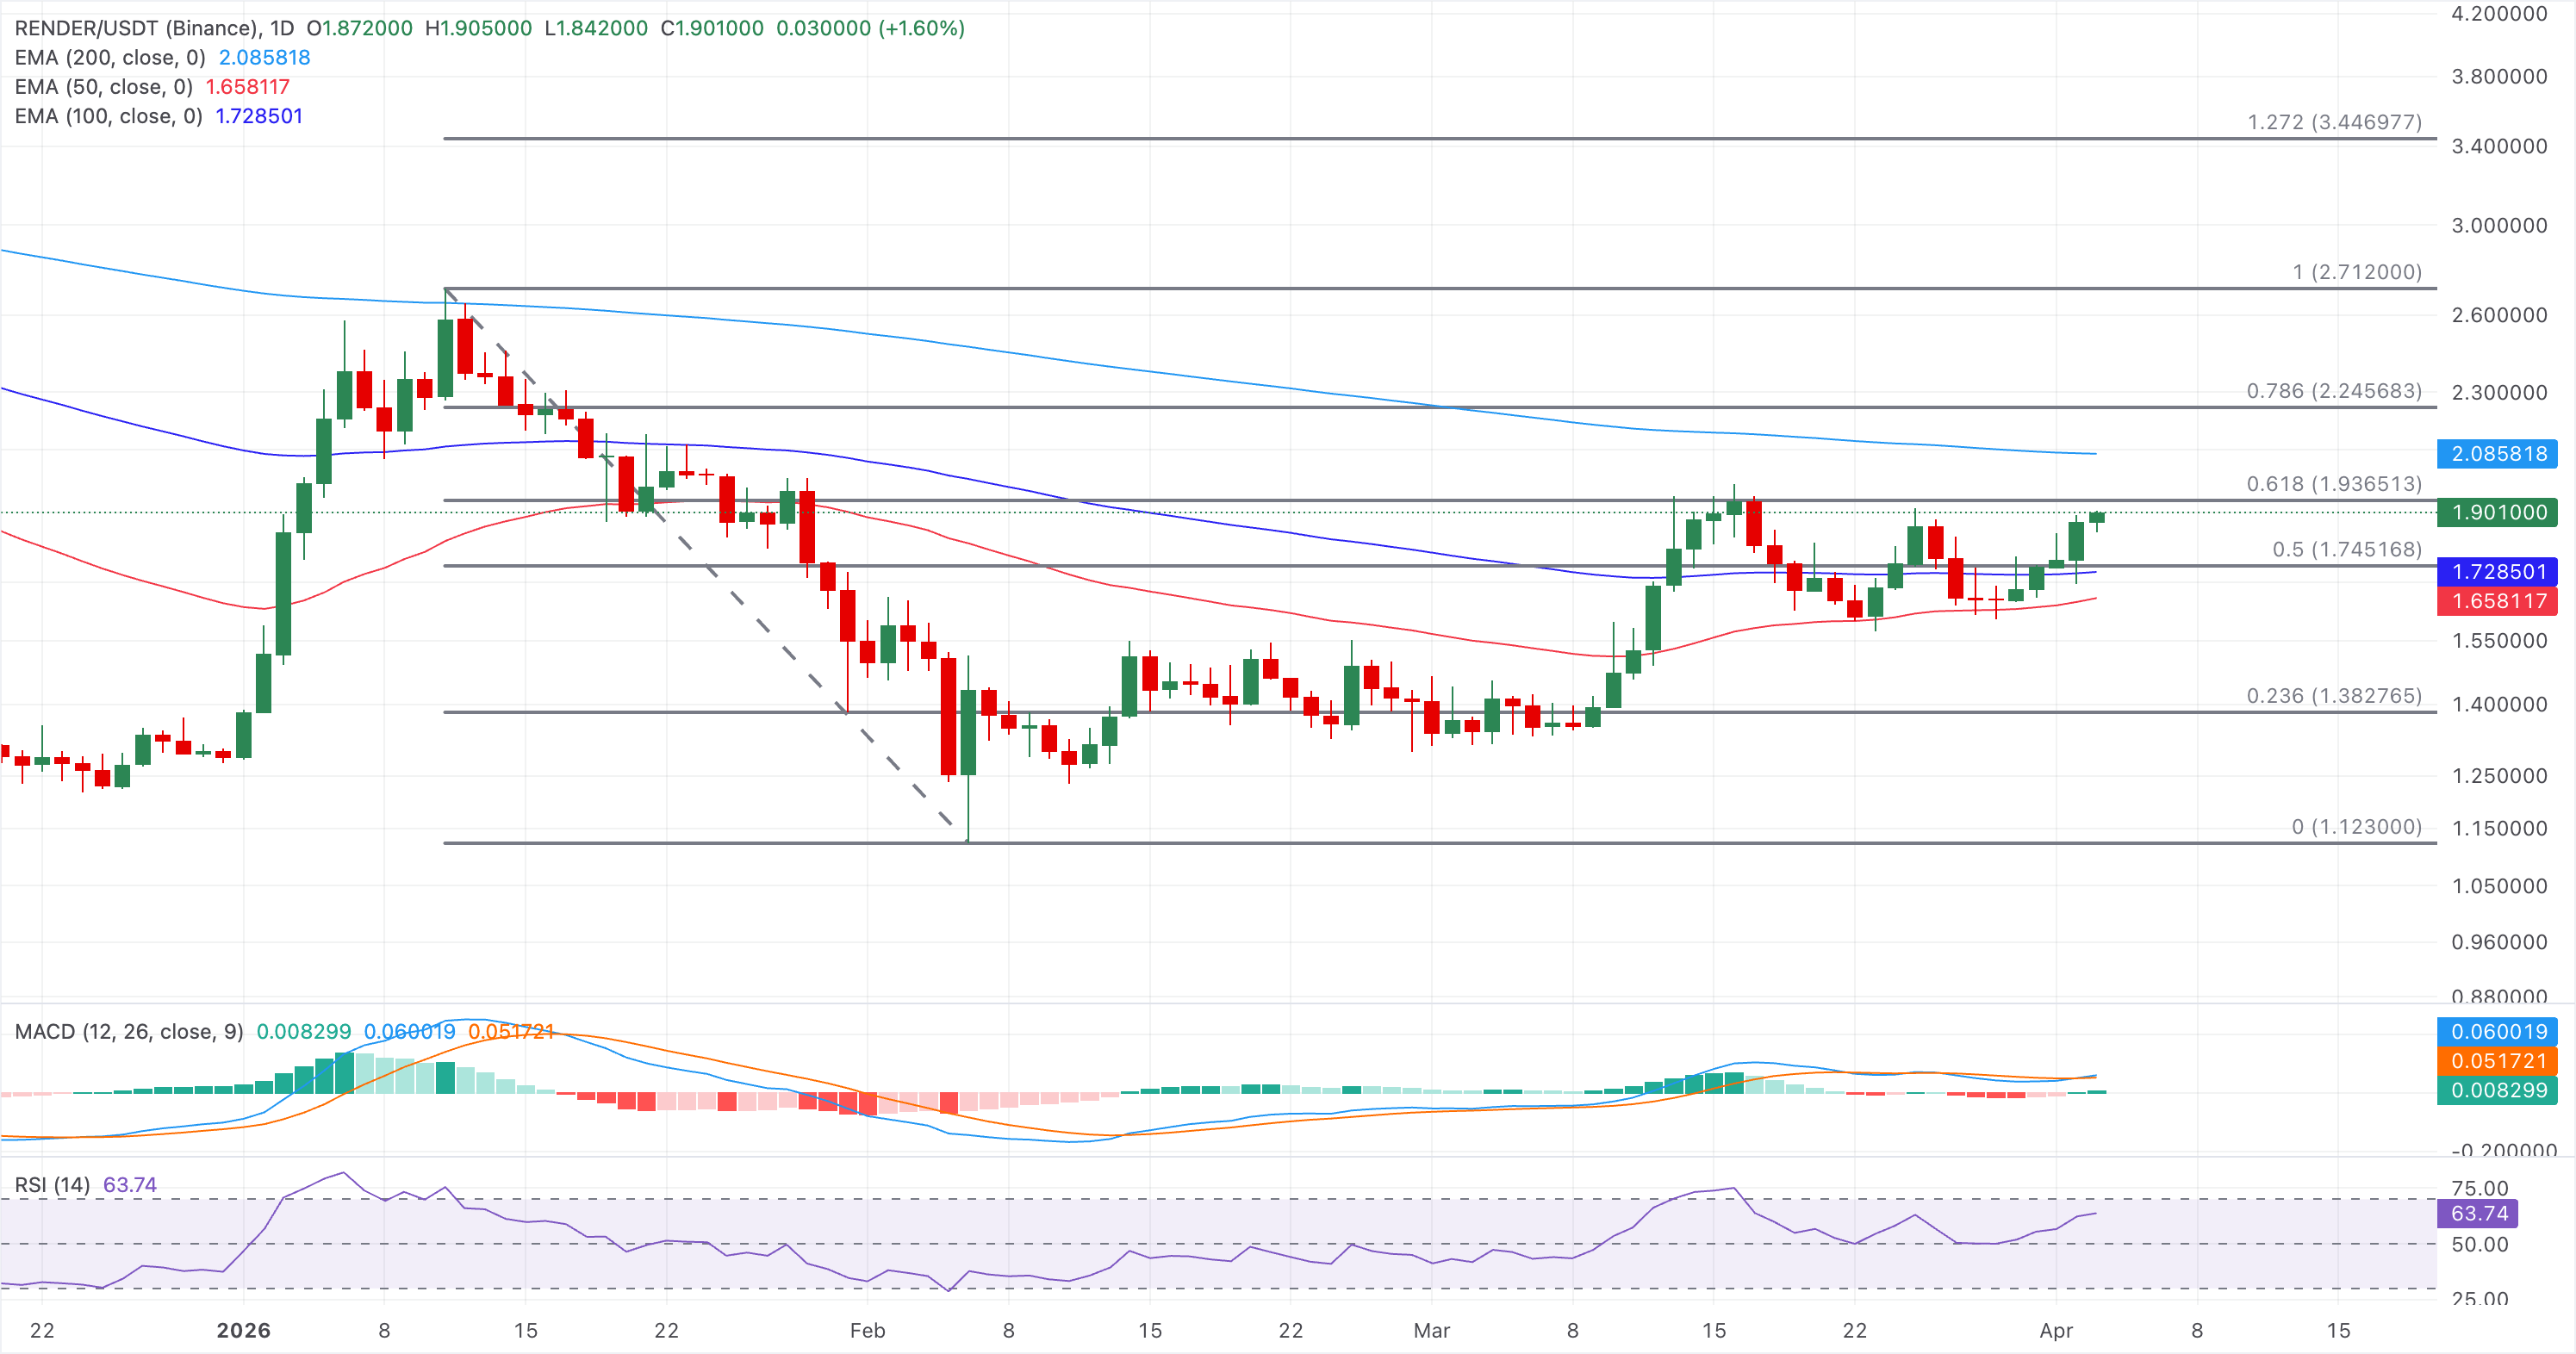
On the downside, immediate support aligns with the 38.2% retracement at $1.73, followed by stronger demand around the 23.6% retracement at $1.50, where prior consolidation and the rising 50-day average would be expected to attract dip buyers if the current advance pauses.
Quant is up roughly 5% at the time of writing on Friday, approaching the 200-day EMA at $77.90. The near-term bias is mildly bullish as price holds above the 50- and 100-day EMAs, signaling recovering demand after last week’s pullback.
The MACD line rises toward the signal line from below, with both still near the zero mark, and the histogram contracts, suggesting fading bearish momentum rather than strong upside conviction. The RSI at 62 leans to the bullish side of neutral, reinforcing the view that buyers retain the initiative, though without overbought readings.
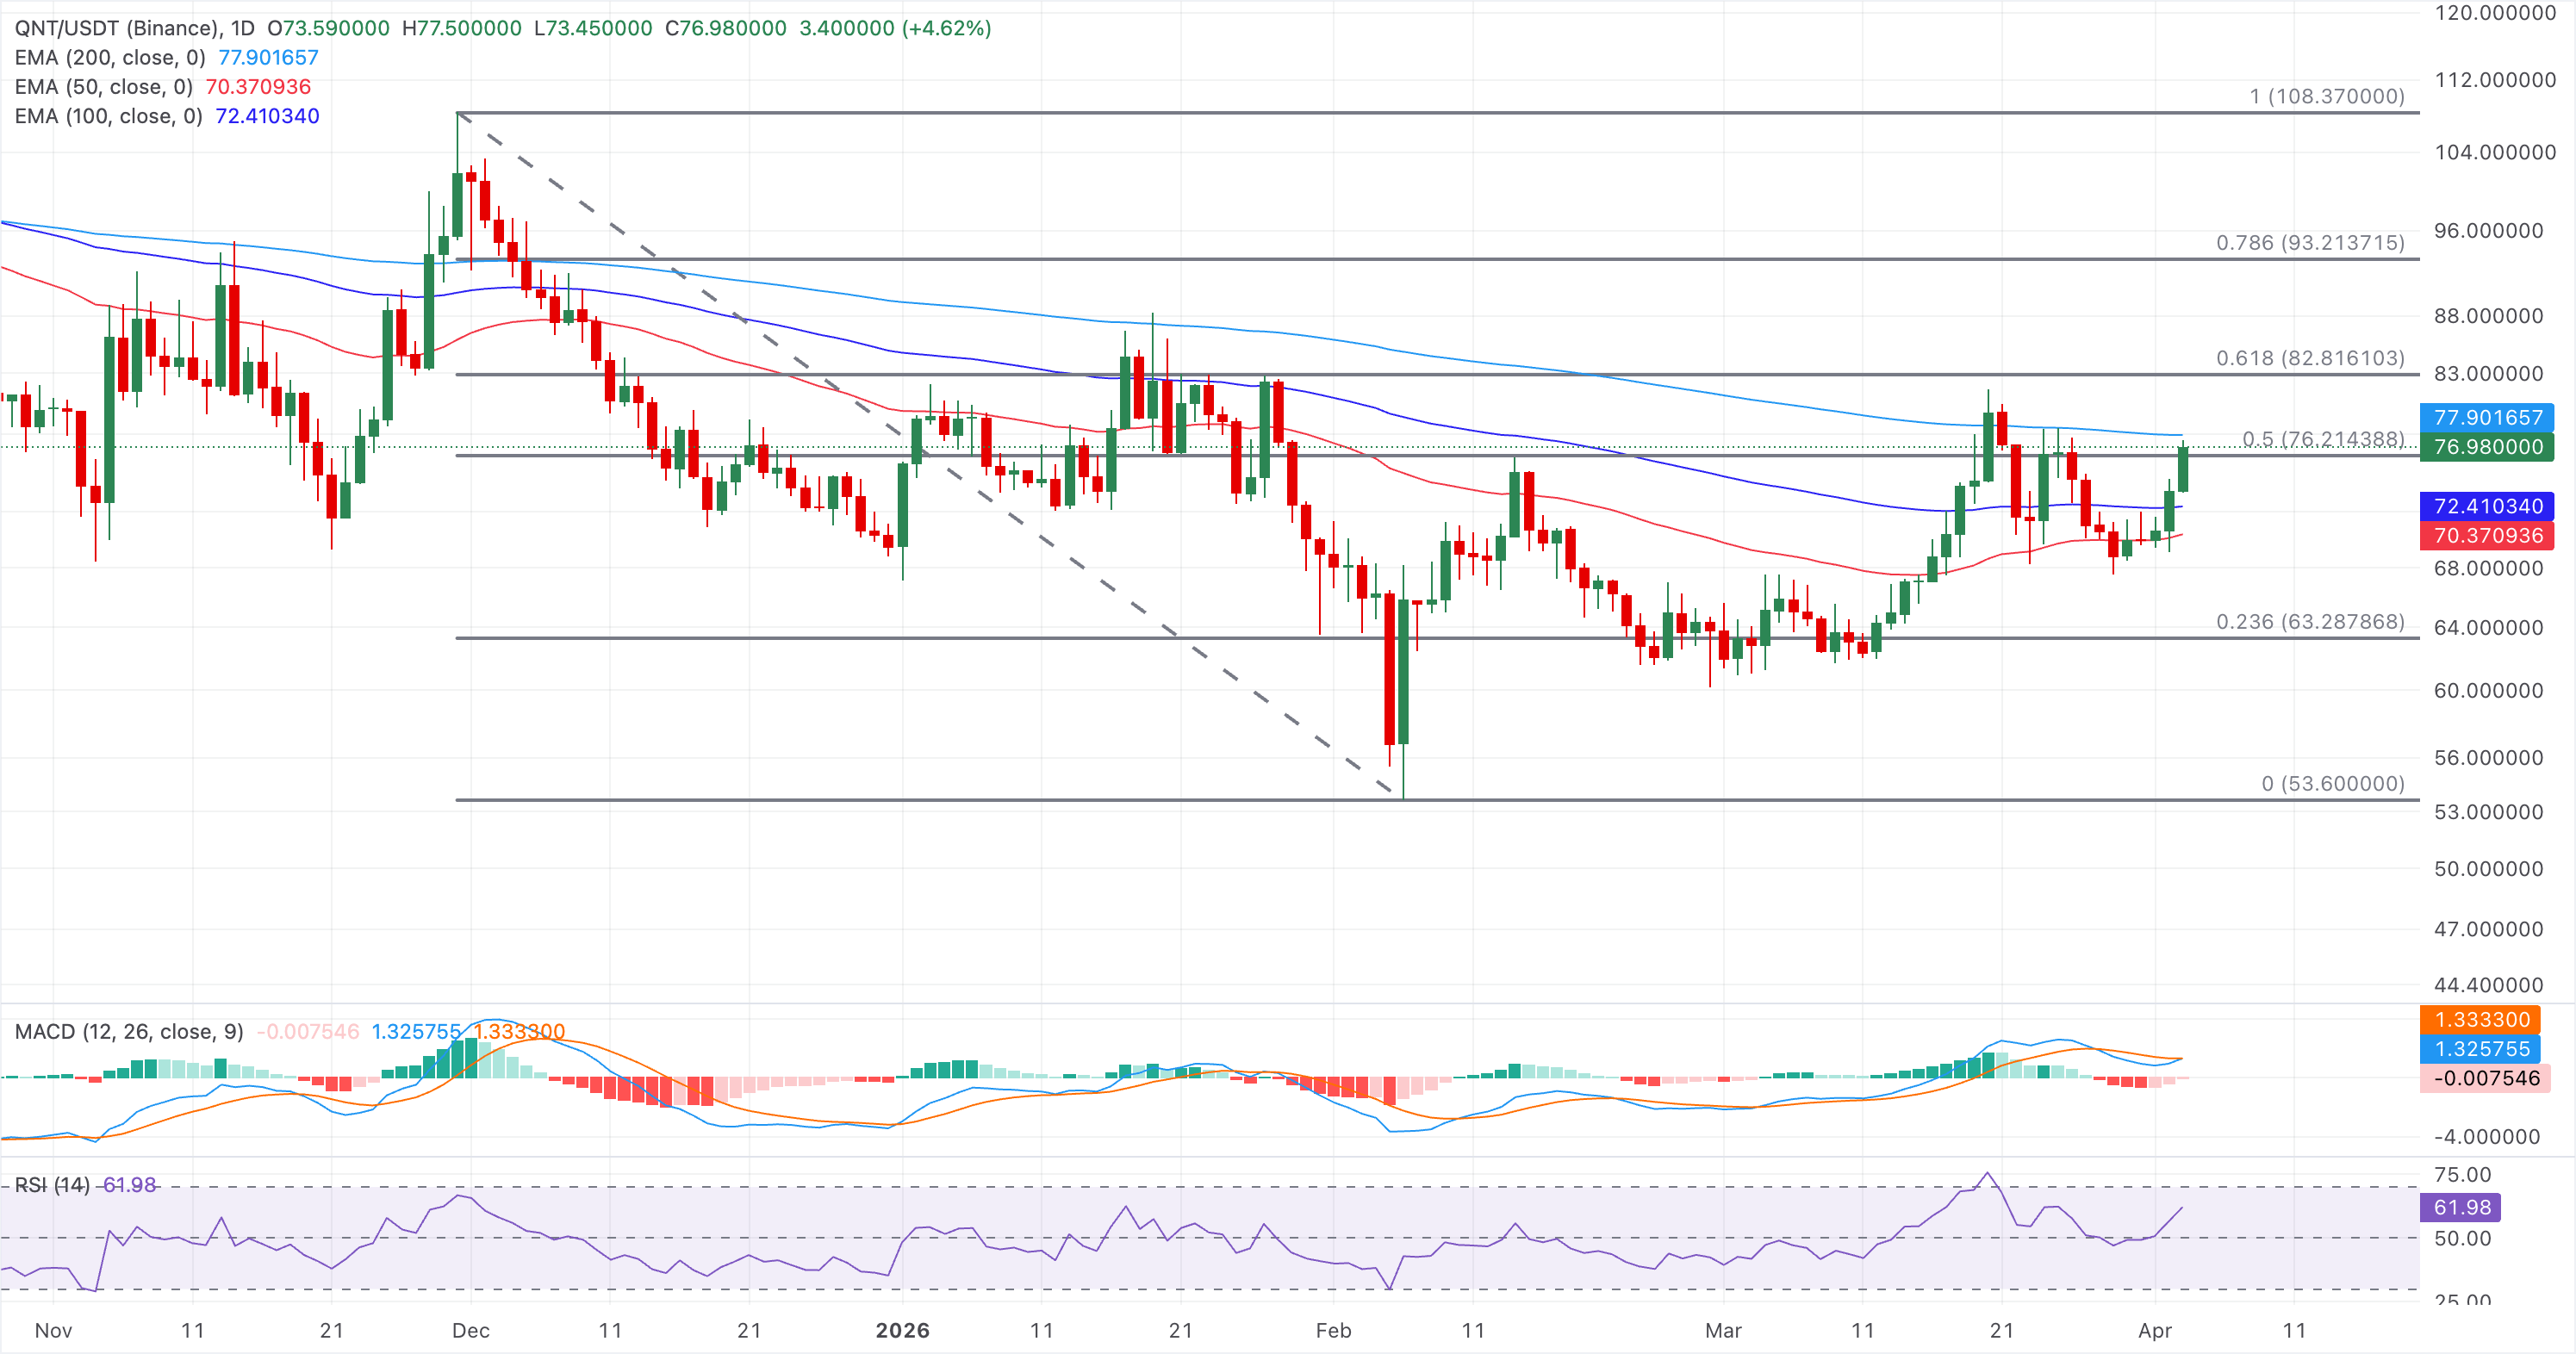
Immediate resistance emerges near the 50.0% Fibonacci retracement at $80.99, measured from the $108.37 high to the $53.60 low, with the 200-day exponential moving average just above, reinforcing this barrier. A sustained break above this area would expose the 61.8% retracement at $87.45 as the next upside target.
On the downside, initial support aligns with the 38.2% retracement at $74.52, followed by the 23.6% retracement at $66.53, where pullbacks would need to hold to preserve the current bullish bias.
(The technical analysis of this story was written with the help of an AI tool.)

超过一百万用户依赖 FXStreet 获取实时市场数据、图表工具、专家洞见和外汇新闻。其全面的经济日历和教育网络研讨会帮助交易者保持信息领先、做出审慎决策。FXStreet 拥有约 60 人的团队,分布在巴塞罗那总部及全球各地区。
阅读更多


