
Crypto Market Overview: Bitcoin tops $69,000 amid Trump’s ultimatum – FET, PEPE, AVAX lead gains
作者 Vishal Dixit
更新: 6 Apr 2026


热门文章

Bitcoin (BTC) rises above $69,000 at press time on Monday amid Donald Trump’s extension of the deadline for Iran from Monday to Tuesday night while threatening strikes on power plants and bridges.
- Bitcoin extends gains above $69,000 on Monday, fueling altcoins’ recovery.
- US President Donald Trump threatened to strike Iran’s power plants and other key sites with a deadline by Tuesday night.
- FET, PEPE, and AVAX led gains over the last 24 hours.
Bitcoin (BTC) rises above $69,000 at press time on Monday amid Donald Trump’s extension of the deadline for Iran from Monday to Tuesday night while threatening strikes on power plants and bridges. Meanwhile, the Artificial Superintelligence Alliance (FET), Pepe (PEPE), and Avalanche (AVAX) are leading gains over the last 24 hours.
Trump’s extended deadline approaches, again
US President Donald Trump has warned to “blow everything up” in Iran in case the state fails to make a deal by 01:00 GMT on Wednesday. This marks the 4th shift in the US strikes' deadline on power plants while the Strait of Hormuz remains closed. On the other hand, Iran continues to deny claims of peace talks and threatens neighboring petroleum-exporting countries (OPEC). Iran has also challenged the petrodollar system by allowing some oil tankers to pass in exchange for a toll paid in Bitcoin or euros. This could loosely align with Sunday’s recovery in Bitcoin spot demand.
Top Crypto Gainers: FET, PEPE, and AVAX lead recovery
FET is up over 4% at press time on Monday, extending above the 100-day Exponential Moving Average (EMA) near $0.2247. The AI crypto token targets the 78.6% Fibonacci retracement at $0.2622, measured from the $0.3149 high to the $0.1340 low. A decisive close above this level could target the 200-day EMA at $0.3133.
The 50-day EMA has turned higher, while the 100-day EMA still lags price, indicating an improving medium-term tone amid a broader basing structure.
Momentum is constructive but not overextended, with the Relative Strength Index (RSI) at 61, while the Moving Average Convergence Divergence (MACD) line remains slightly below its signal line, hinting that upside pressure is building but not yet decisive.
On the flip side, the 100-day and 50-day EMAs serve as crucial support levels at $0.2247 and $0.2100, respectively.
Meanwhile, the frog-themed meme coin, PEPE, rises over 2% at the time of writing on Monday, extending the 2% gains from the previous day. The near-term bias is neutral, with a modest bullish tilt, as price action and all the crucial daily EMAs are effectively declining, suggesting a broadly downward trend.
The 50-day EMA at $0.00000364 serves as immediate resistance, and a daily close above it would open the doors to the 23.6% Fibonacci retracement level at $0.00000381, measured from the $0.00000723 high to the $0.00000313 low.
The MACD line fluctuates around the zero line, with minimal separation between the MACD and signal lines, reinforcing the view of muted momentum and a consolidative environment. The RSI is at 55, above the midline, suggesting that downside pressure has faded and that buyers are slowly regaining control despite the lack of directional price follow-through.
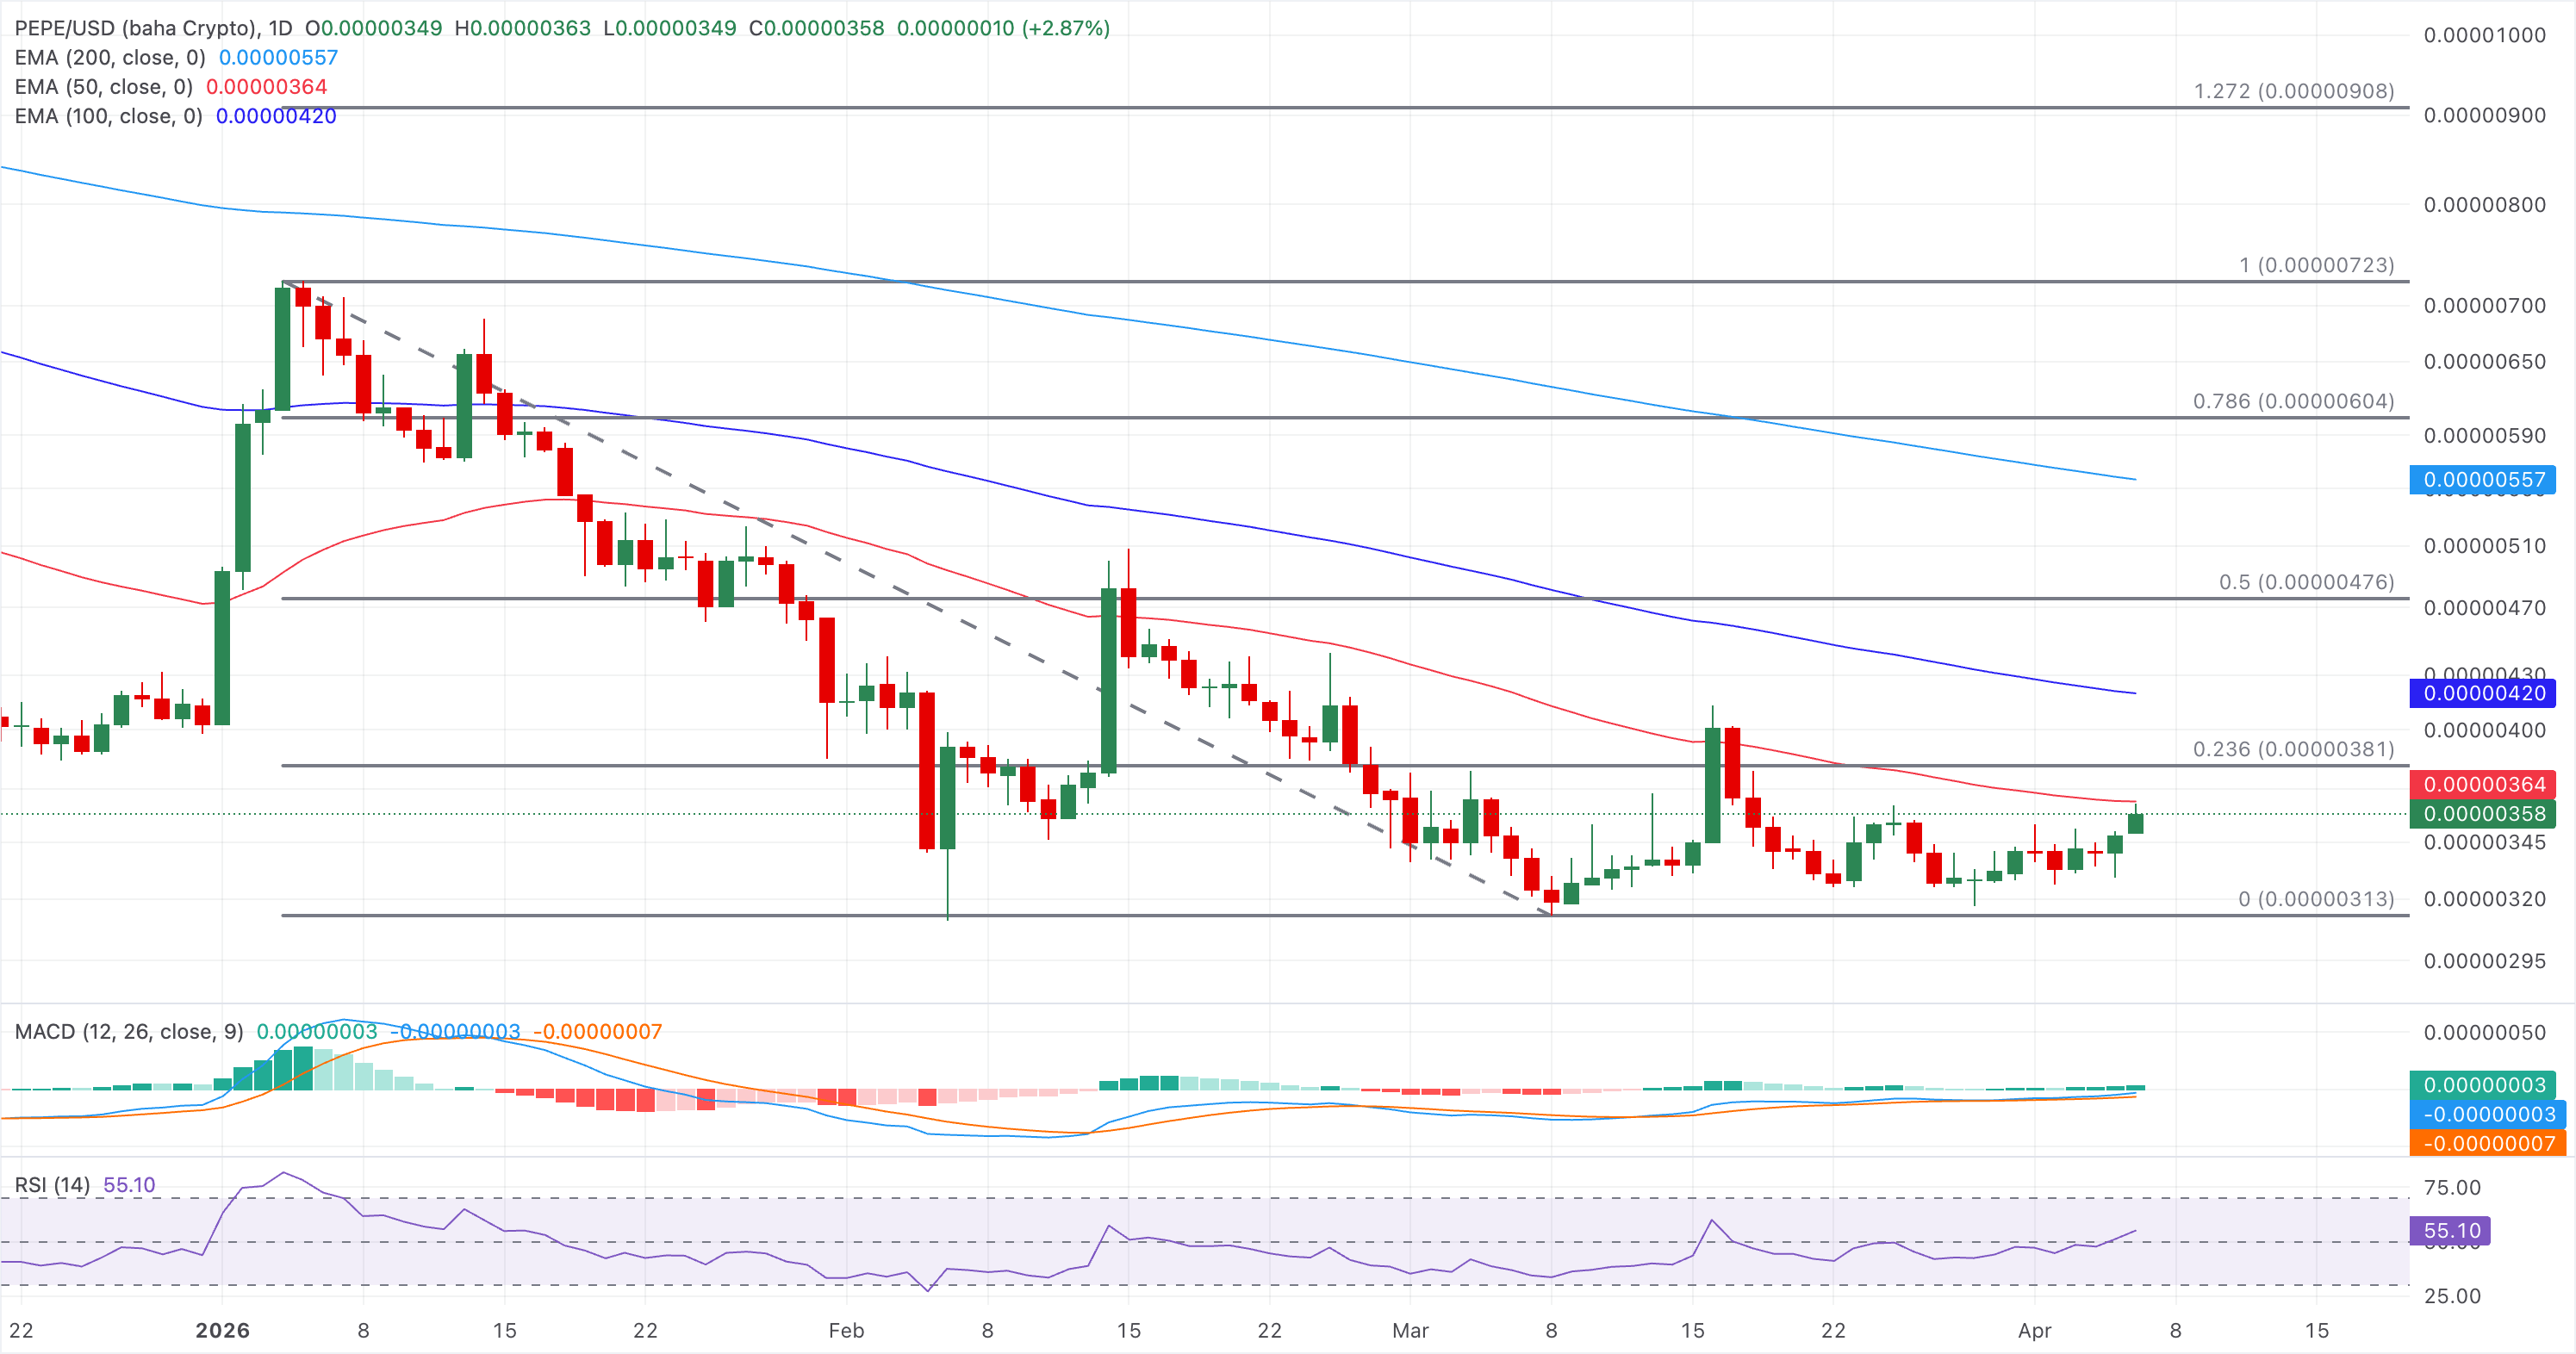
On the flip side, the key support for PEPE remains at $0.00000313, last tested on March 8.
Avalanche is up roughly 6% at press time on Monday, testing the 50-day EMA at $9.58. If AVAX clears this level, it could target the 100-day EMA at $10.75.
The MACD line has crossed back above its signal, with the histogram turning higher, suggesting improving upside momentum after a shallow consolidation. The RSI at 57 departs from mid-range and points higher, indicating buyers are regaining control without yet reaching overbought conditions.
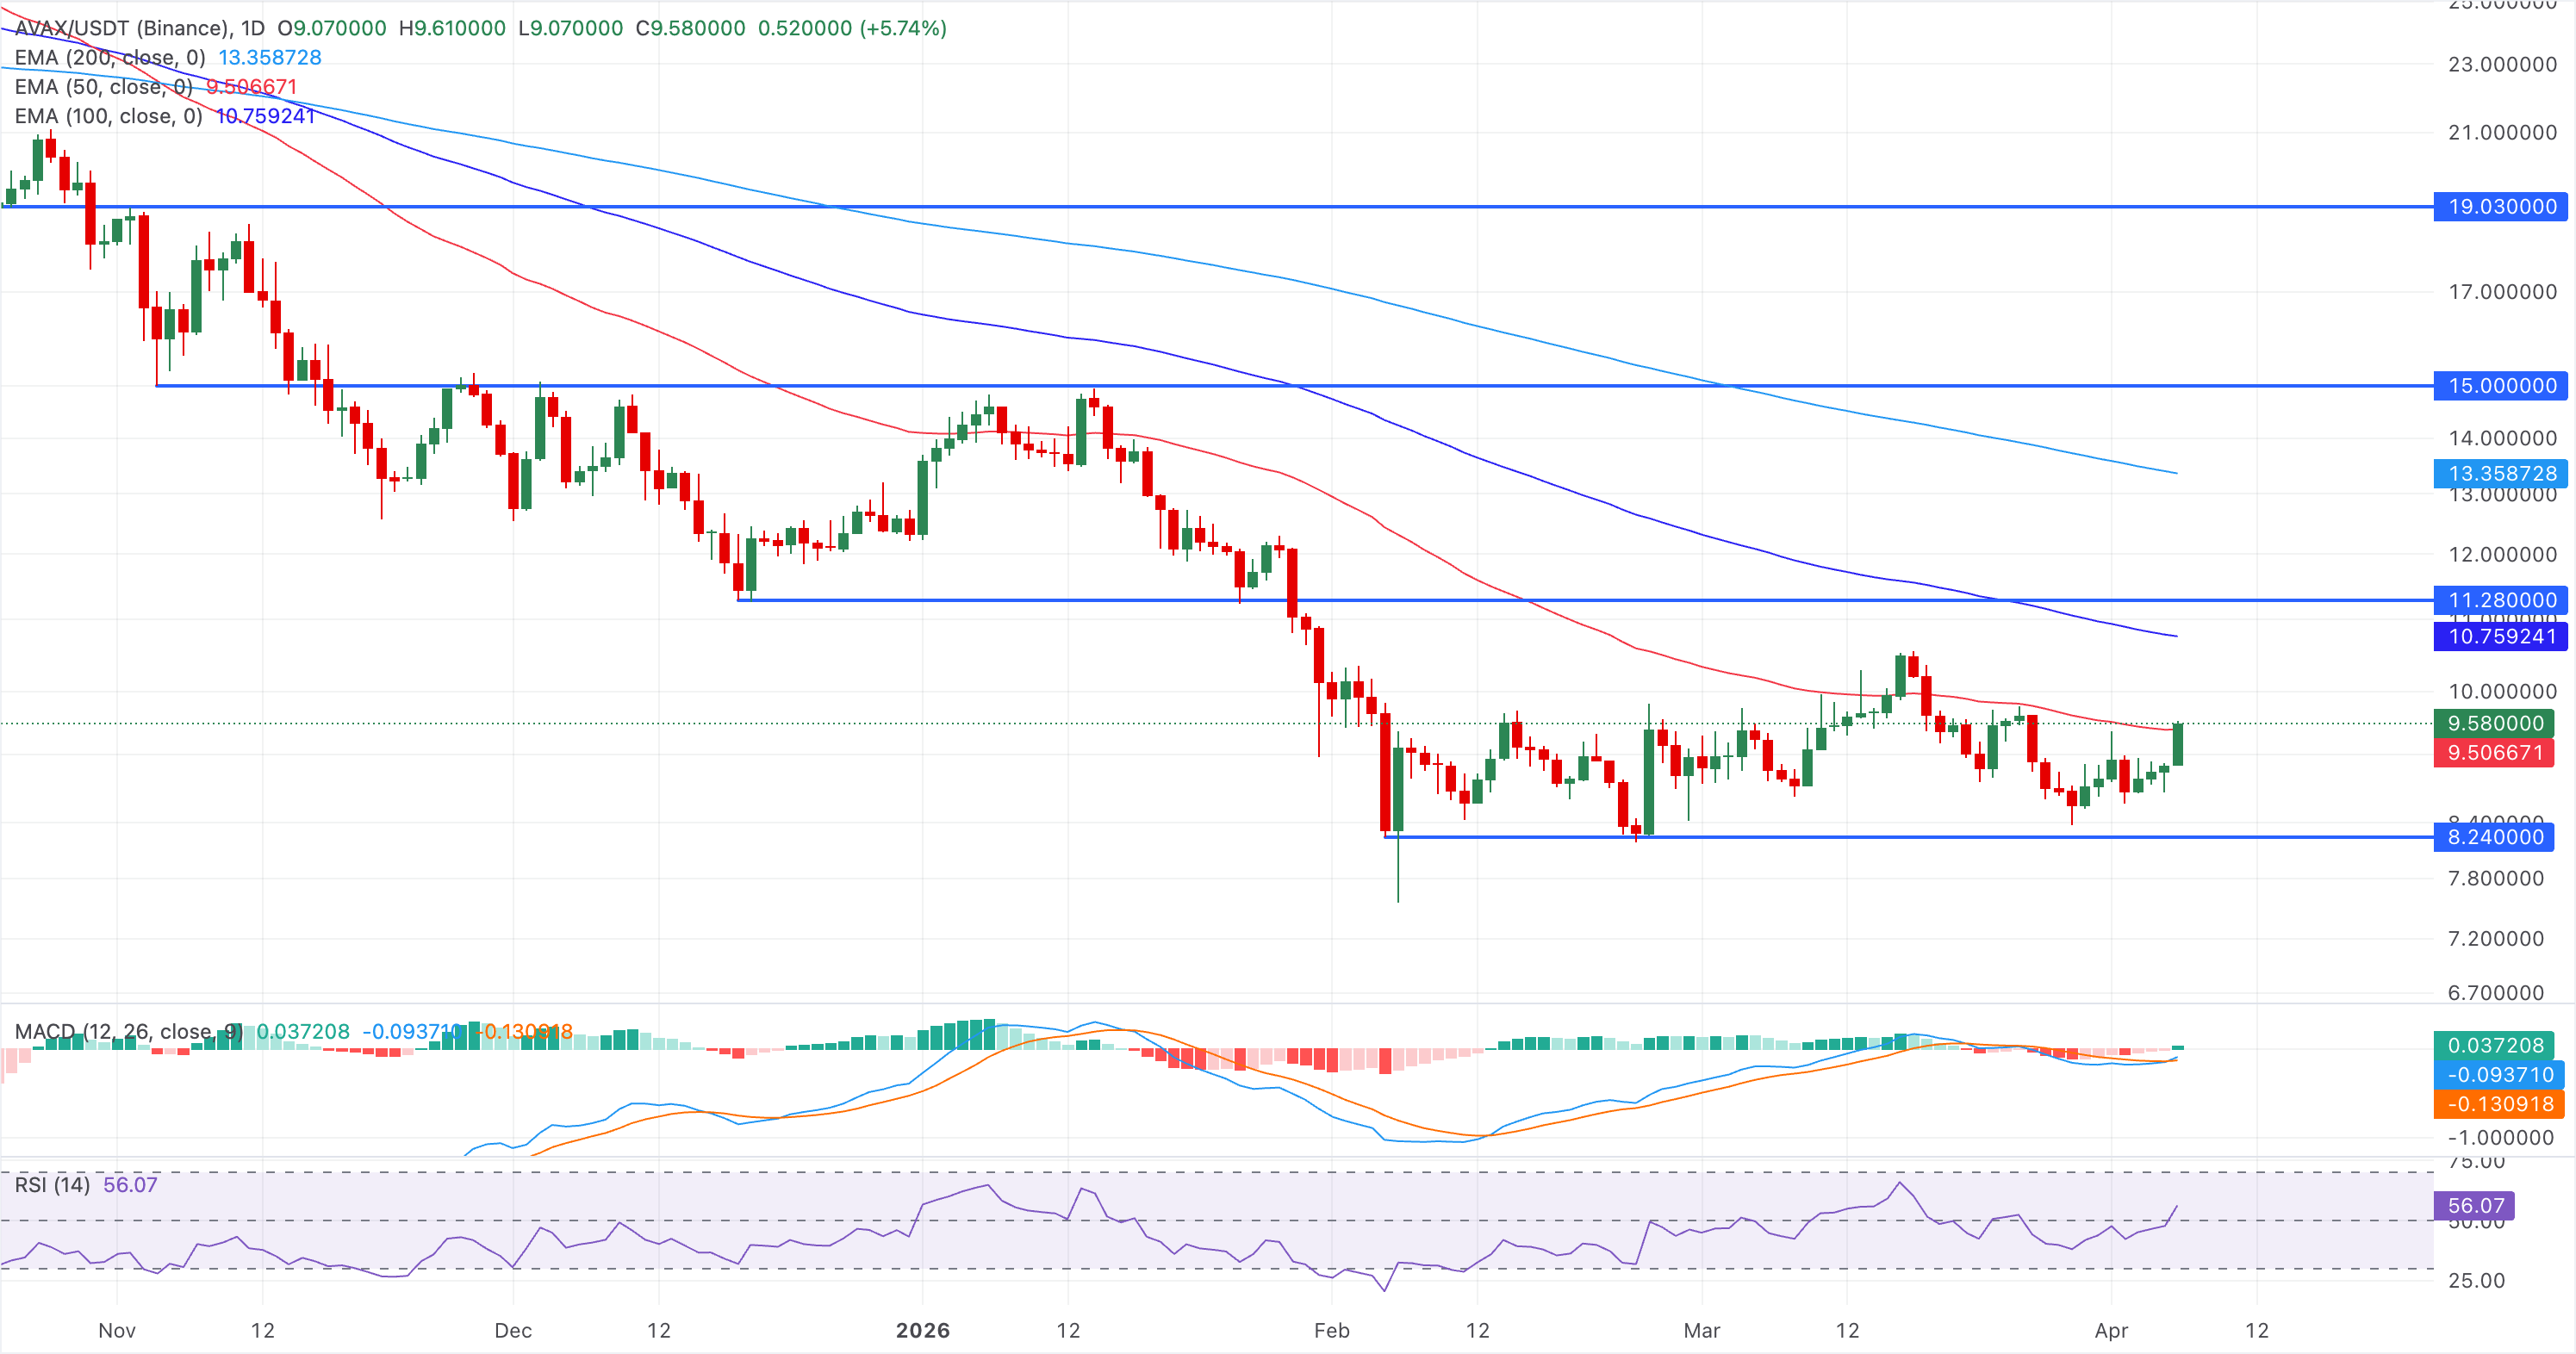
Looking down, the key support for AVAX lies at the $8.24 support level marked by the February 5 low.
(The technical analysis of this story was written with the help of an AI tool.)

超过一百万用户依赖 FXStreet 获取实时市场数据、图表工具、专家洞见和外汇新闻。其全面的经济日历和教育网络研讨会帮助交易者保持信息领先、做出审慎决策。FXStreet 拥有约 60 人的团队,分布在巴塞罗那总部及全球各地区。
阅读更多


