
Crypto Market Overview: Resilient despite Iran tanker strikes – ICP, HYPE, RENDER lead gains
作者 Vishal Dixit
发布日期: 12 Mar 2026 | 修改日期: 12 Mar 2026


热门文章

Bitcoin (BTC) remains resilient near $70,000 amid ongoing Middle East tensions, which are driving oil prices and inflation risks.
- Bitcoin holds steady near $70,000 amid rising tensions in the Strait of Hormuz as Iran strikes two oil tankers.
- Crypto market stability holds as 24-hour liquidations remain under $200 million, while Open Interest rises.
- Internet Computer, Hyperliquid, and Render are leading gains over the last 24 hours.
Bitcoin (BTC) remains resilient near $70,000 amid ongoing Middle East tensions, which are driving oil prices and inflation risks. Derivatives data shows strong retail interest, with a rise in positional buildup, while Internet Computer (ICP), Hyperliquid (HYPE), and Render (RENDER) emerge as top gainers over the last 24 hours.
Crypto market holds firm despite volatile oil prices weighing it down
West Texas Intermediate (WTI) crude oil prices are up 7% on Thursday, trading at $92, after Iran struck two oil-carrying tankers in Iraqi waters on Wednesday. In an attempt to ease the oil price surge, the International Energy Agency (IEA) approved releasing 400 million barrels from its emergency oil reserve, while the US offered 172 million barrels from its reserve.
Additionally, US President Donald Trump has given the green light to oil production off the coast of Southern California. Meanwhile, Trump continues to reaffirm that the US would quickly complete its campaign against Iran.
The global financial markets face downside pressure from the energy crisis, raising concerns of increased inflation, while the crypto market broadly holds firm. Bitcoin trades near $70,000 at press time on Thursday, holding over 5% gains so far this week.
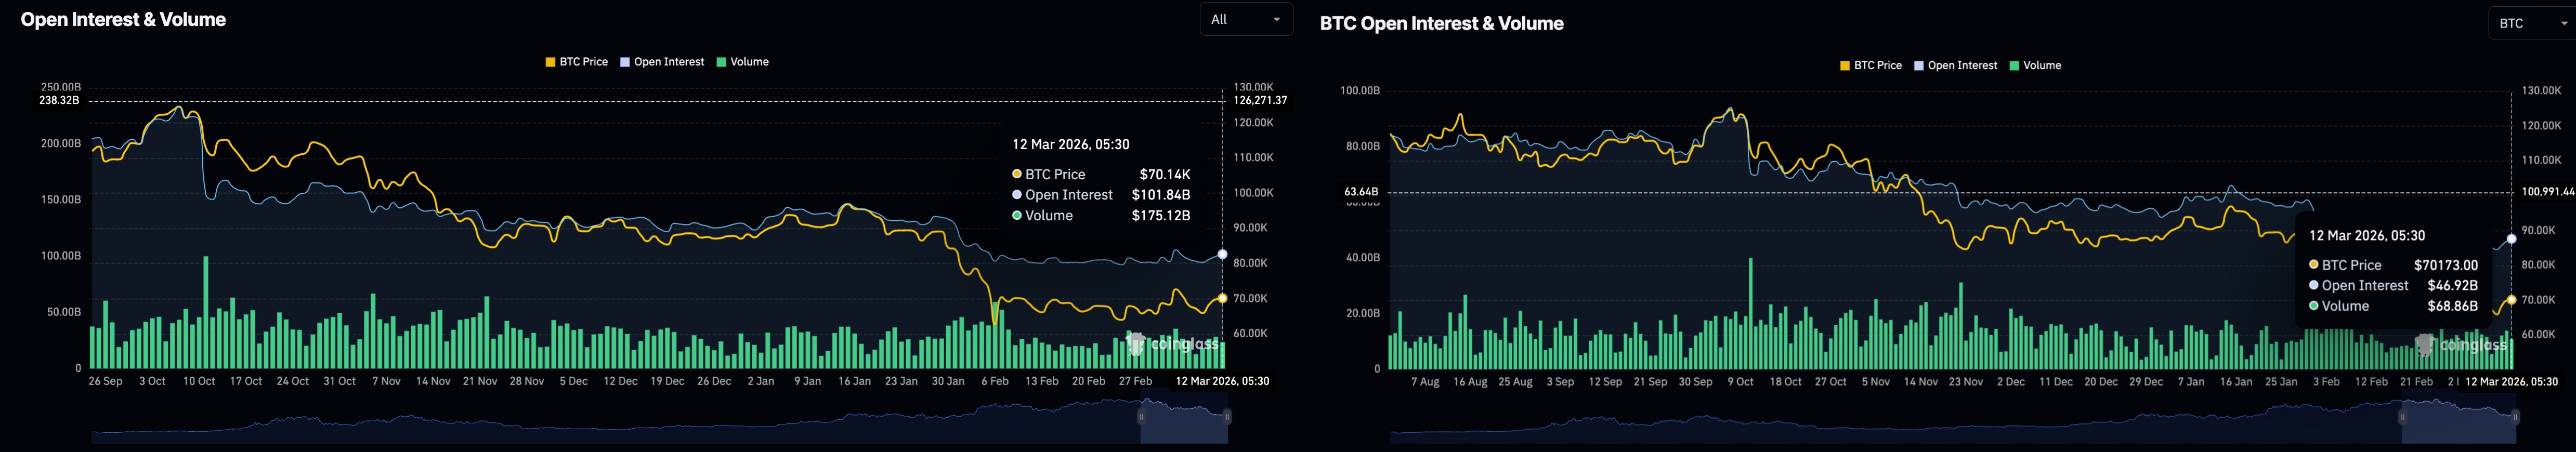
On the derivatives side, the broader crypto market Open Interest (OI) is at $101.84 billion, up from $99.88 billion on Wednesday, supported by $175.12 billion in trading volume. Meanwhile, Bitcoin futures OI rose to $46.92 billion, up from $46.06 billion the previous day.
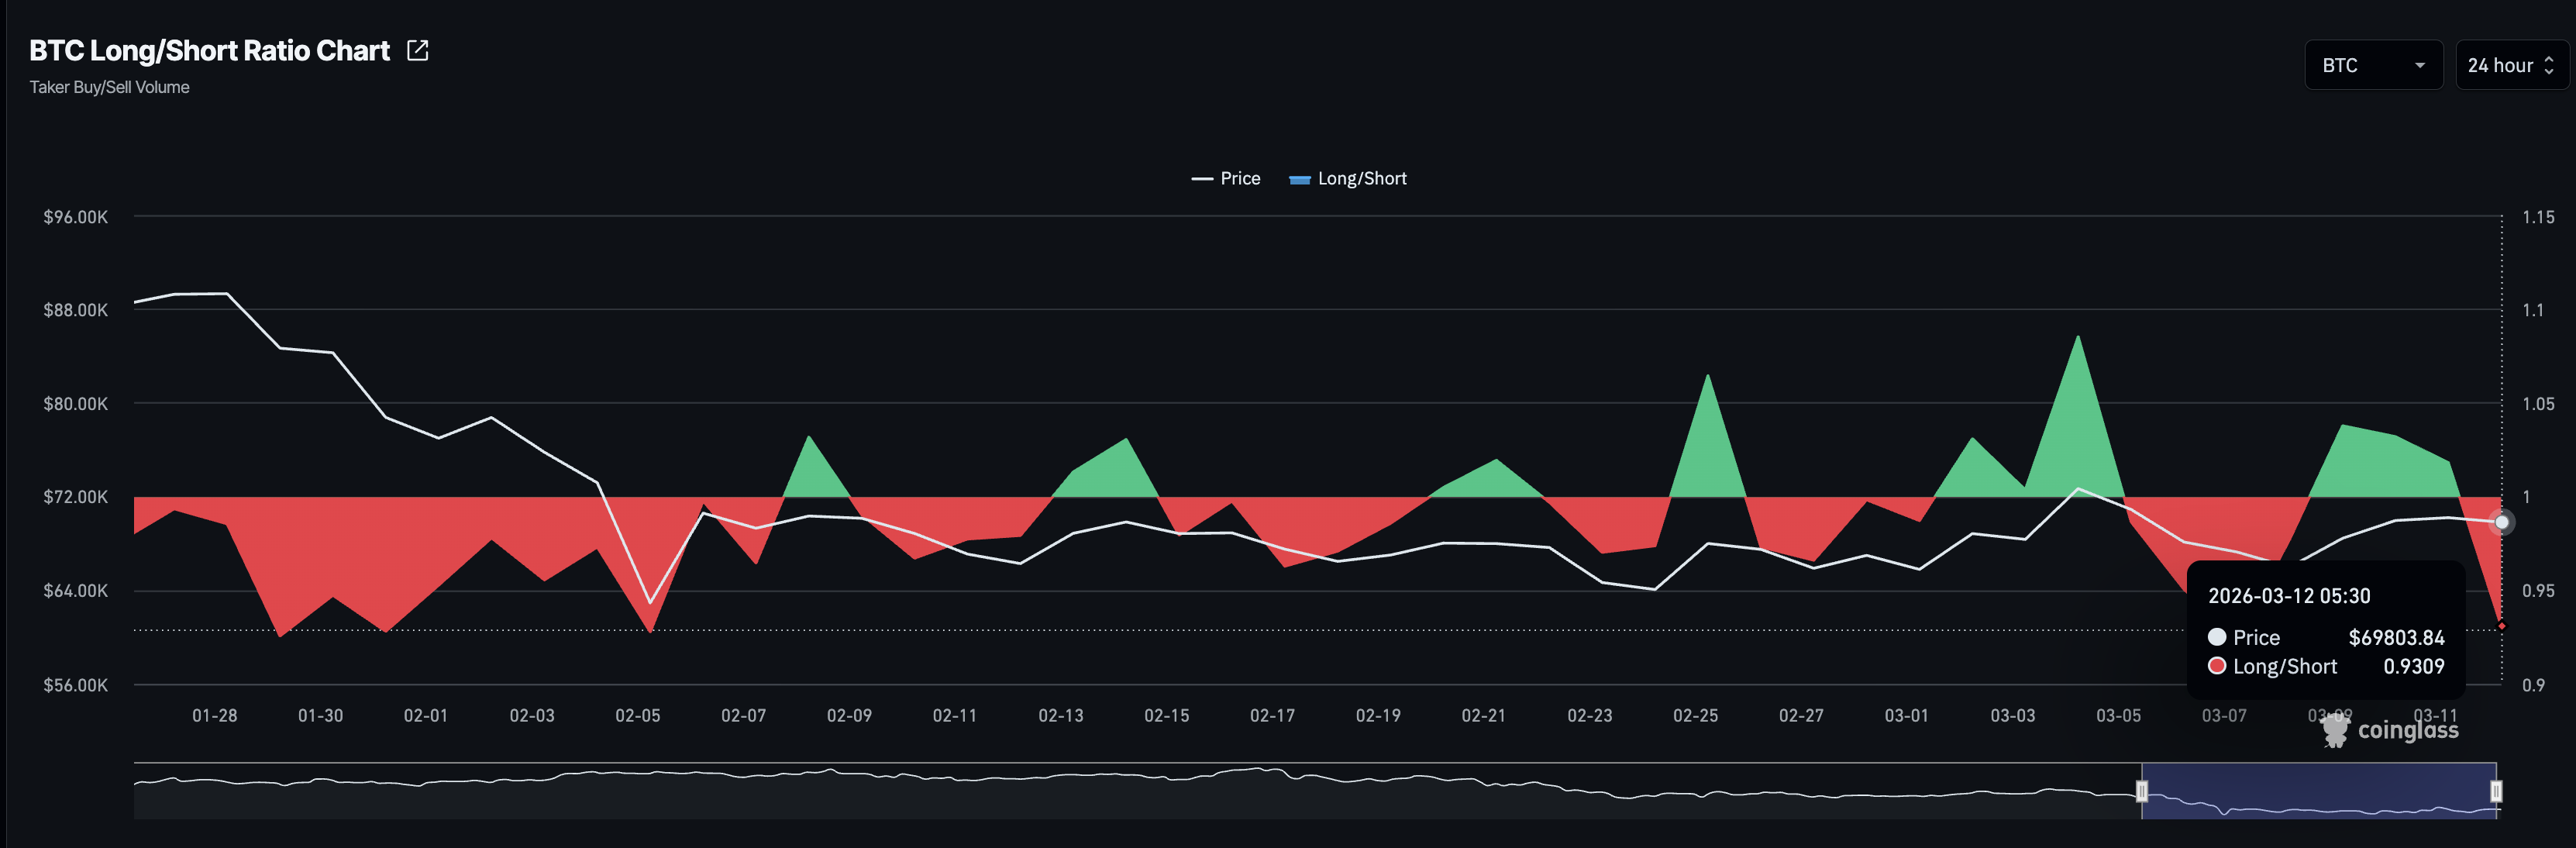
However, the Bitcoin long-to-short ratio dropped to 0.9713, reflecting a bearish shift among traders.
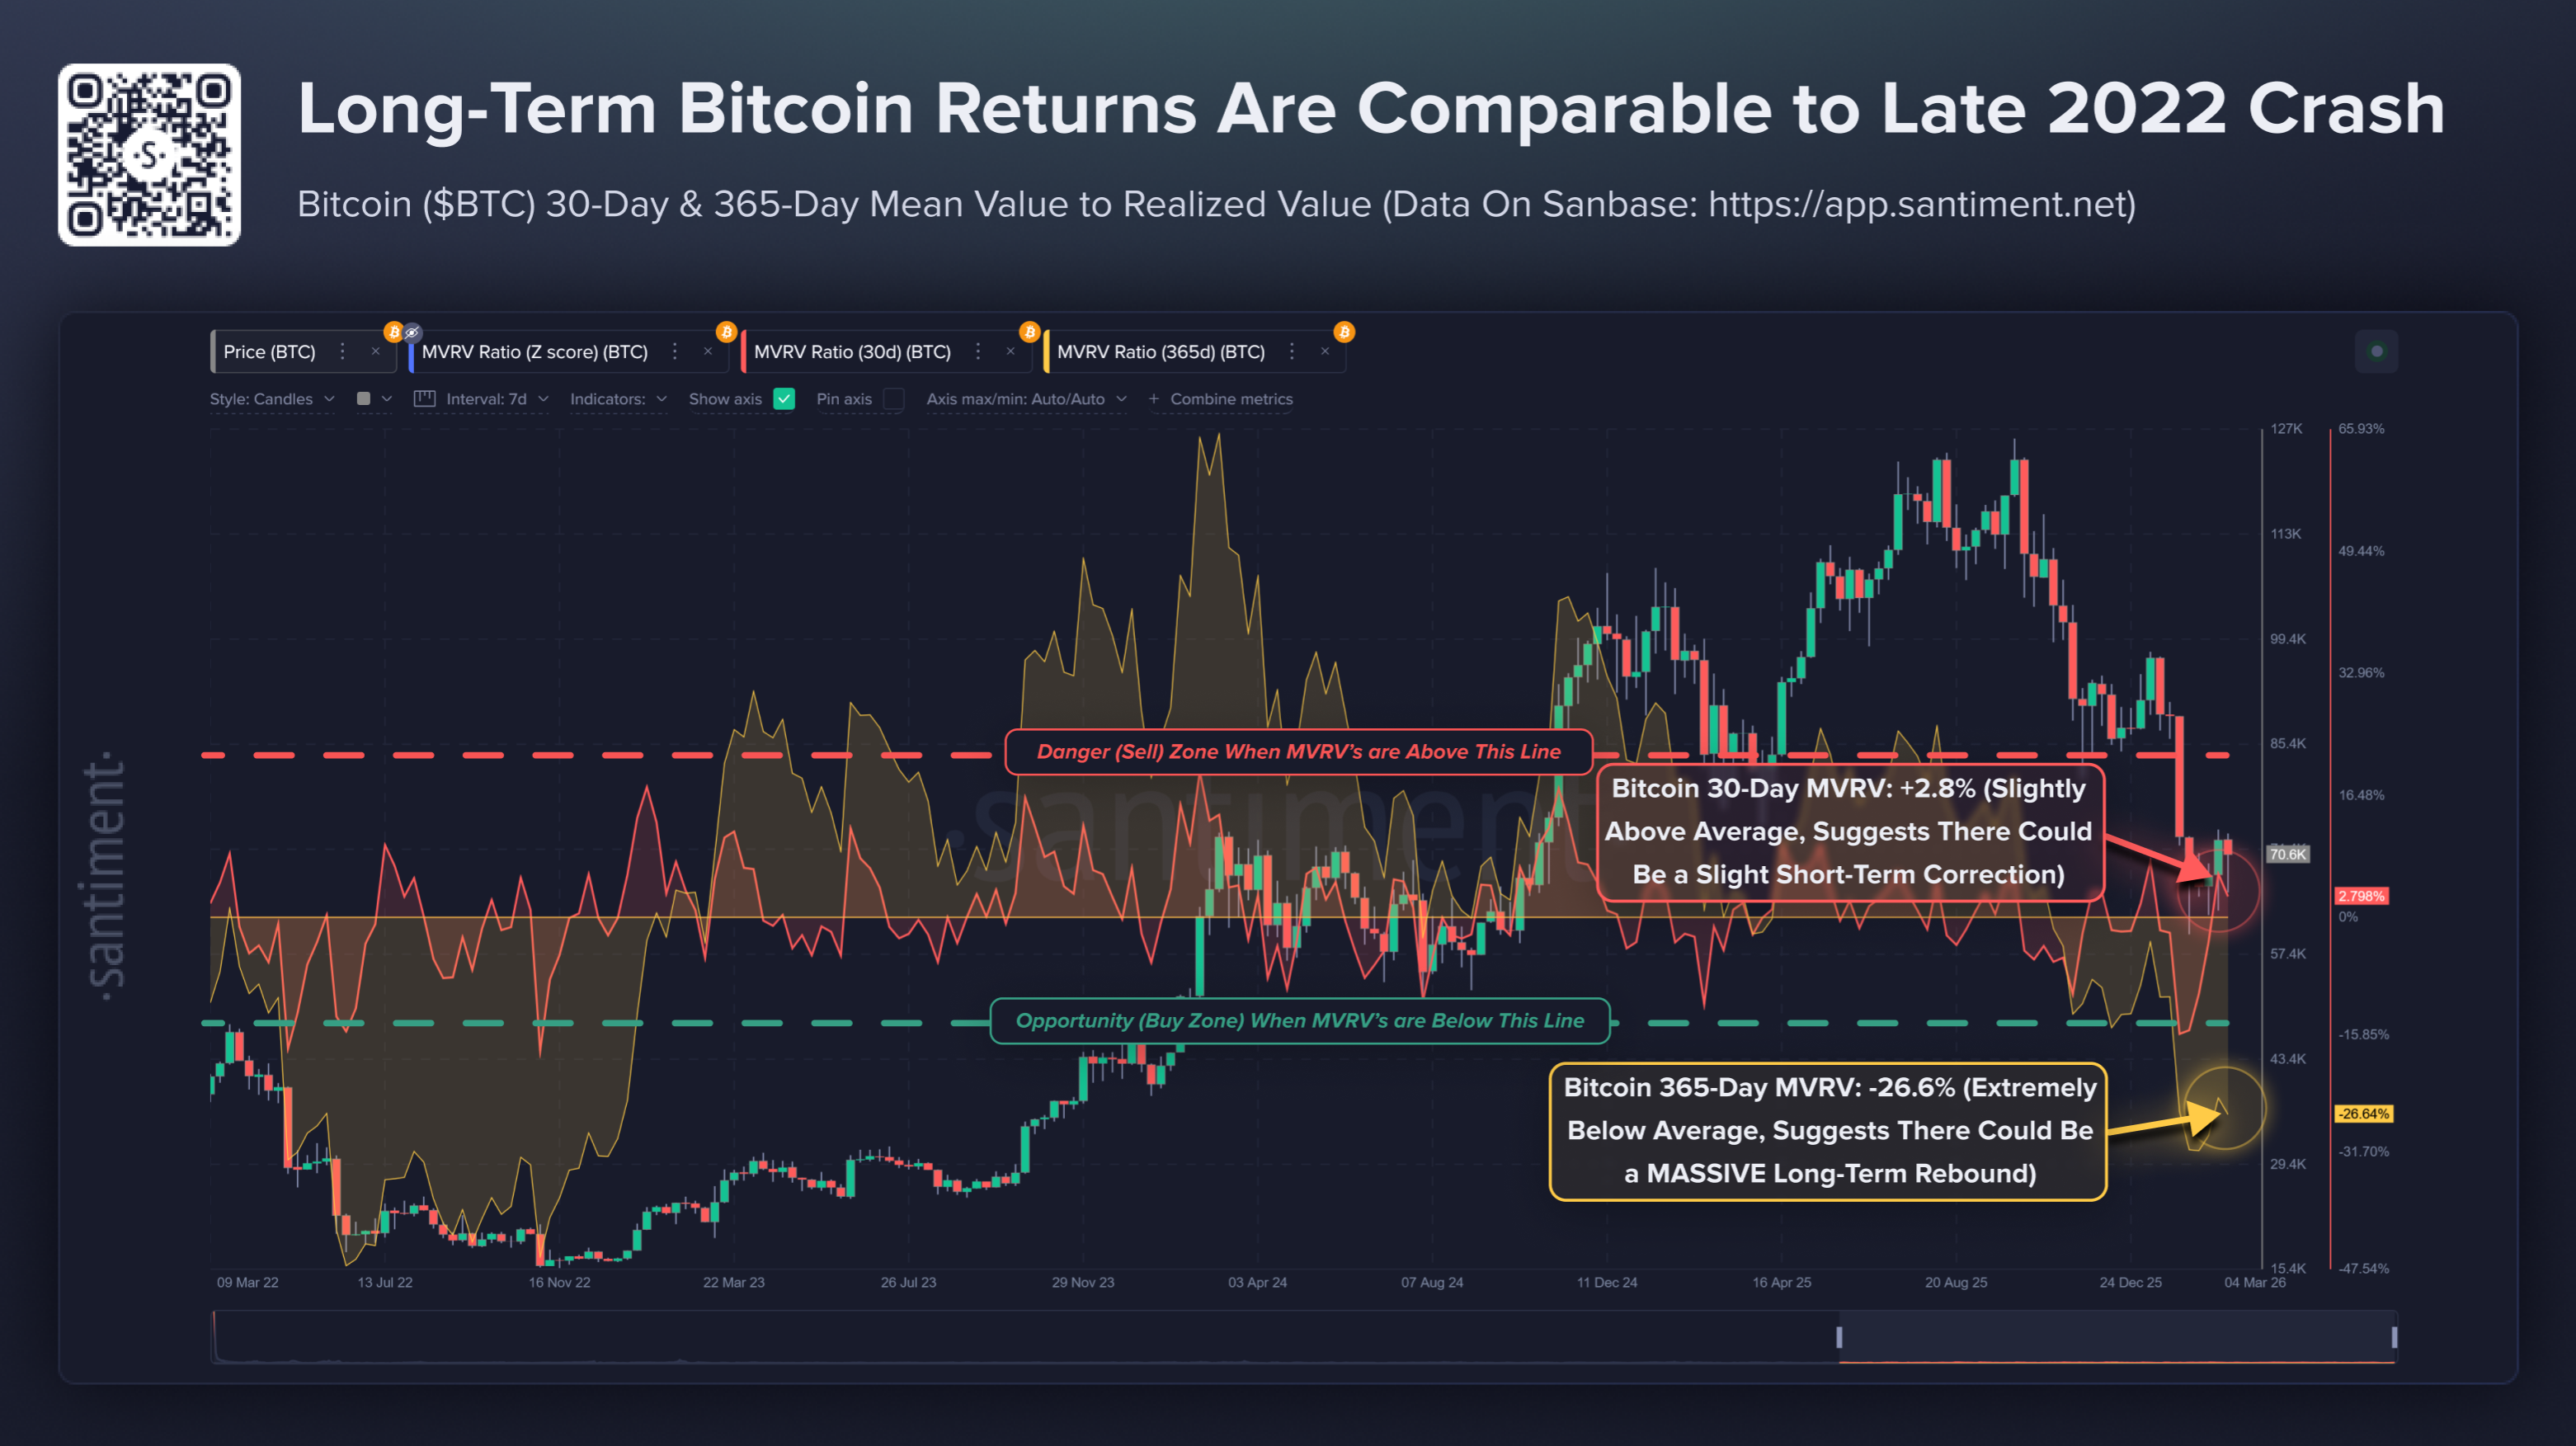
On the on-chain side, Santiment data shows that the BTC 365-day Market Value to Real Value (MVRV) ratio is significantly below average (oversold), suggesting upside potential in the long-term. The 30-day MVRV is near its average, flagging short-term risk.
Top crypto gainers: ICP, HYPE and RENDER leading the gains
Internet Computer is down 4% at press time on Thursday, following a 12% jump the previous day. The near-term bias stays mildly bullish after the pair rebounded from the mid-2.30s and pressed above the recent range, while the Moving Average Convergence Divergence (MACD) line holds above its signal and the zero line, suggesting strengthening upside momentum. The Relative Strength Index (RSI) around 54 backs this positive tone without yet signaling overbought conditions.
However, ICP remains well below the clustered 50-, 100-, and 200-day Exponential Moving Averages (EMAs), keeping the broader structure bearish and framing current gains as a recovery within a longer-term downtrend.
On the upside, immediate resistance appears at 2.68, the recent swing high, with further barriers at 2.80 near the projected break level of the descending trend line.
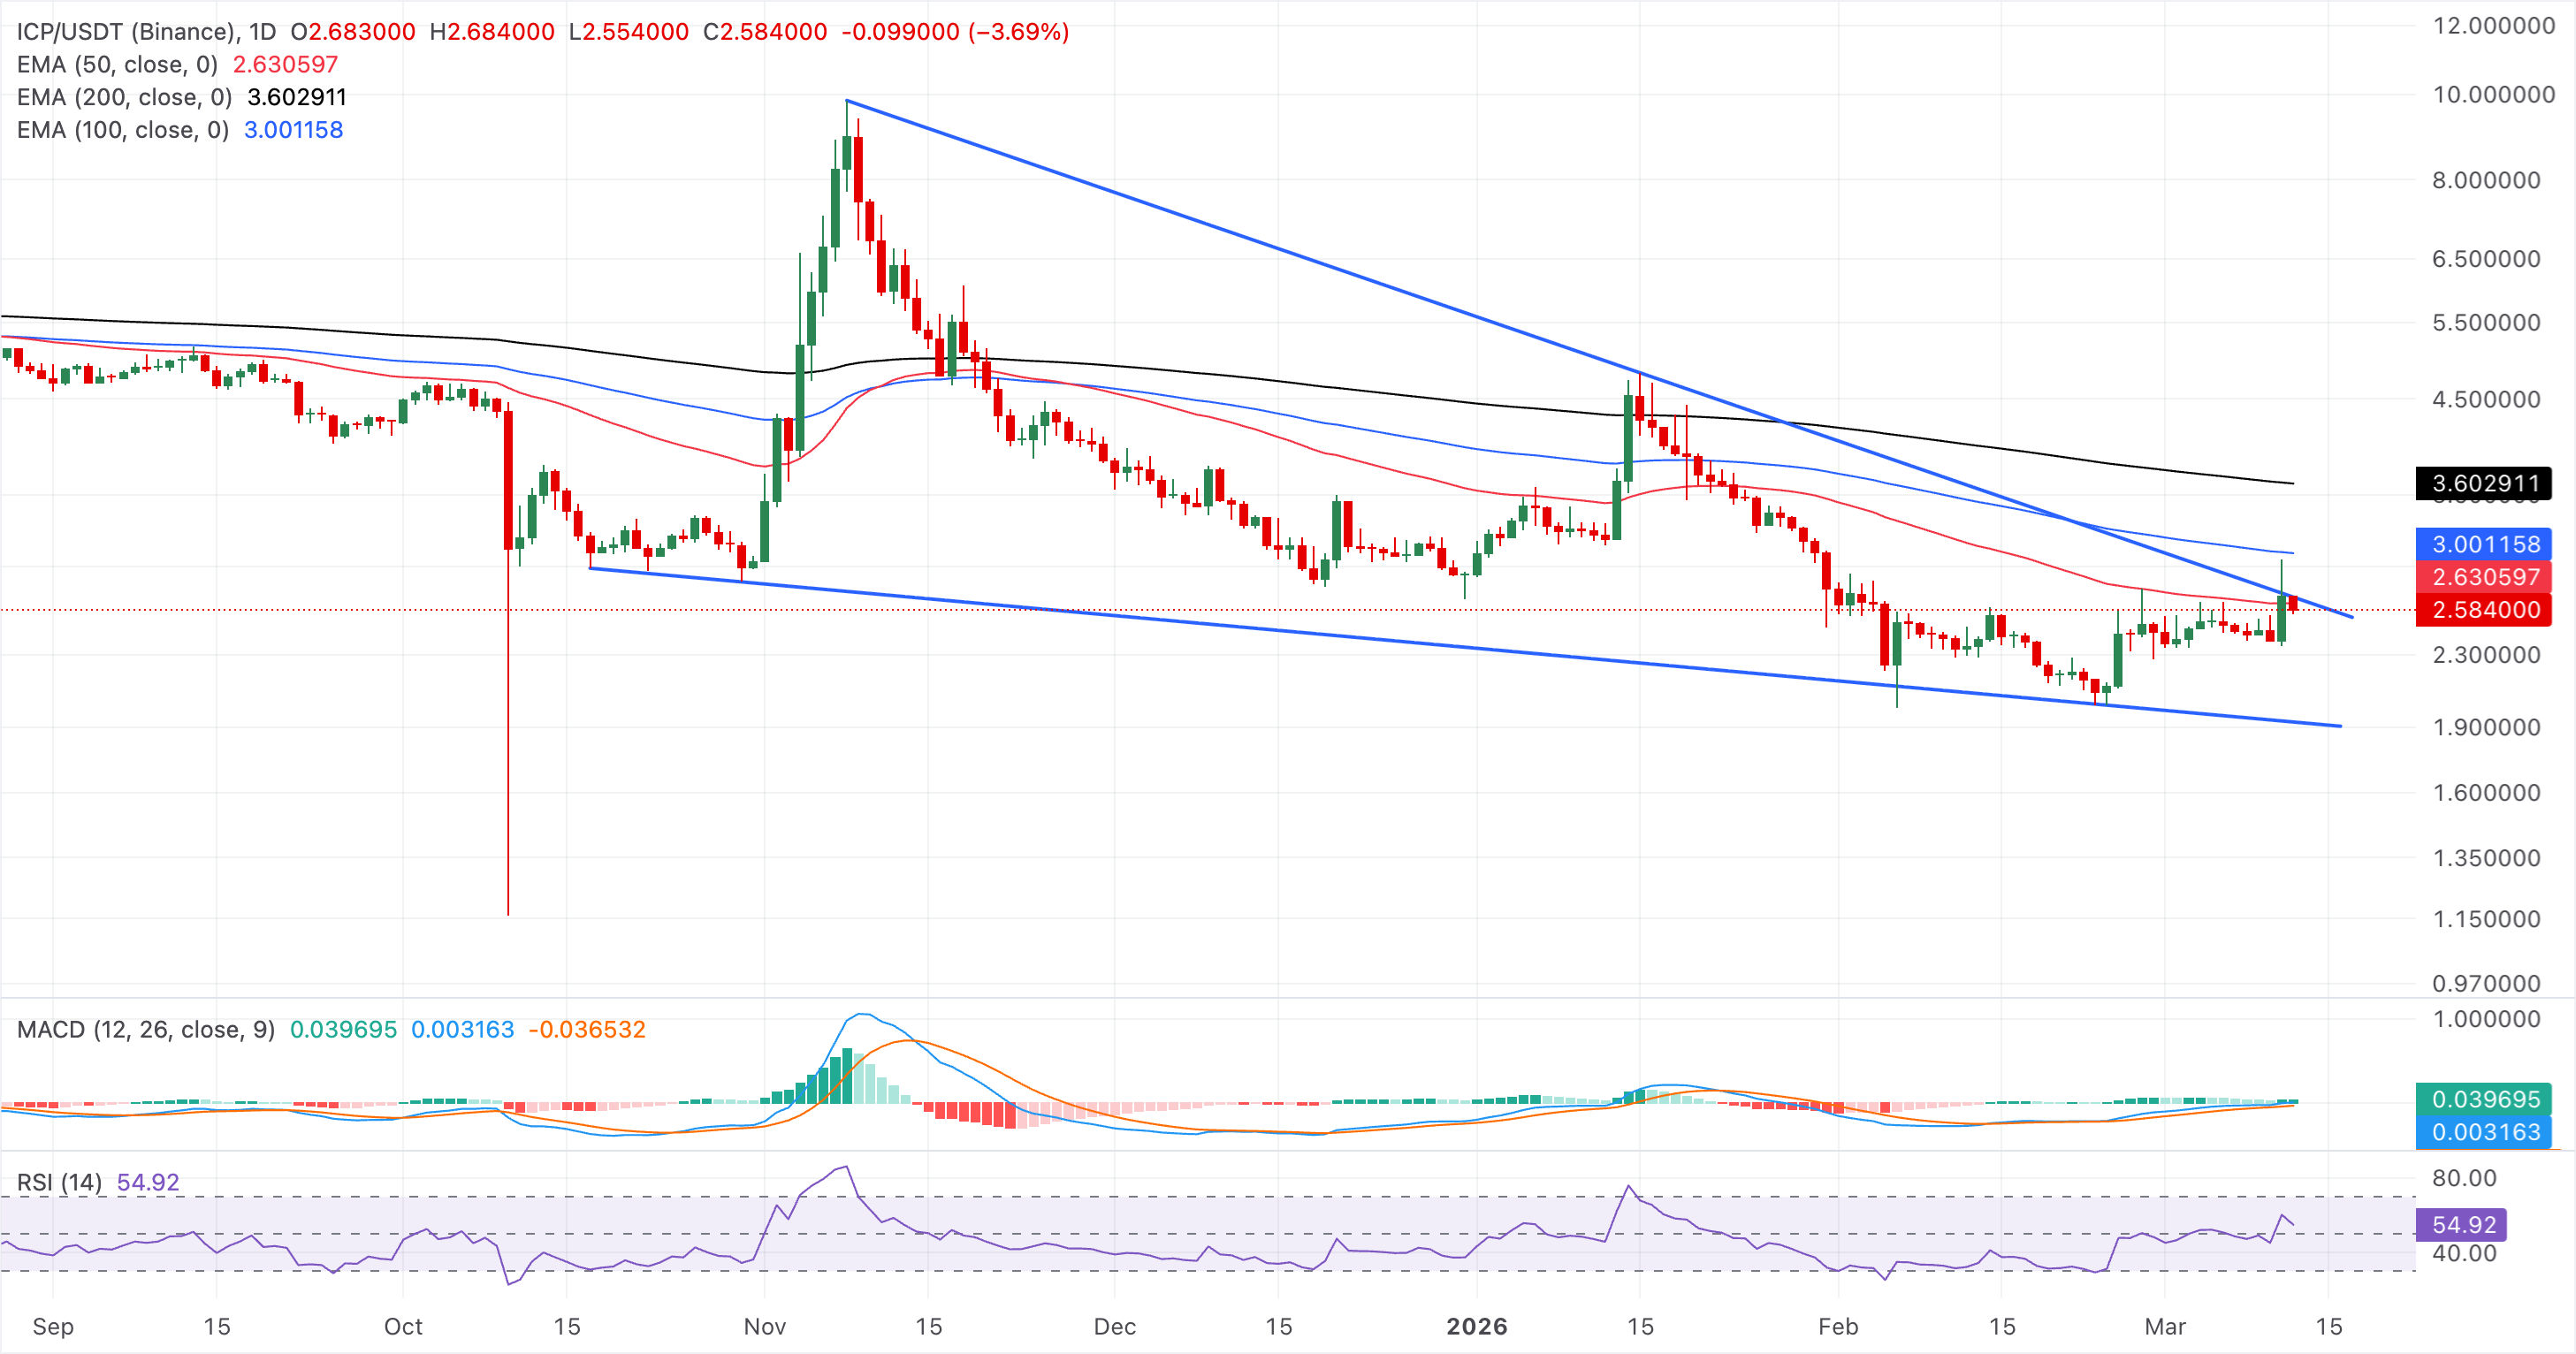
Initial support emerges at 2.45, where the latest breakout area and nearby intraday lows converge, followed by 2.30, which guarded the market during the recent consolidation phase. A deeper pullback would expose 2.20 as the next downside level.
On the other hand, Hyperliquid inches closer to $40 after a 6% surge on Wednesday. At the time of writing, HYPE is trading at $38 on Thursday, holding above the 50-, 100-, and 200-day EMAs, shifting the broader backdrop away from the prior downside phase.
On the upside, initial resistance is located just below $36.25, the recent peak above the breakout, followed by a higher barrier at $40.00. A decisive close above this level could open the path toward the $50.00 psychological level.
Momentum confirms the upside tilt, as the MACD line remains above its signal and both indicators hold in positive territory, with an expanding histogram, while the RSI at 64 stays below overbought but indicates firm buying pressure.
Immediate support emerges at the former resistance band around $32.80–$32.20, where the broken trend line converges with the 200-day EMA and the recent swing high.
Meanwhile, Render mid-week recovery faces a key resistance near its 50-day EMA at $1.51. A daily close above this area would expose the next upside hurdle in the 1.60 region ahead of stronger supply near the $1.70 band aligned with the 100-day EMA.
The near-term bias is mildly bullish, as the MACD line holds above its signal line in positive territory and its histogram widens, suggesting strengthening upside momentum. The RSI around 55 leans bullish above the midline, aligning with ongoing recovery pressure rather than overbought conditions.
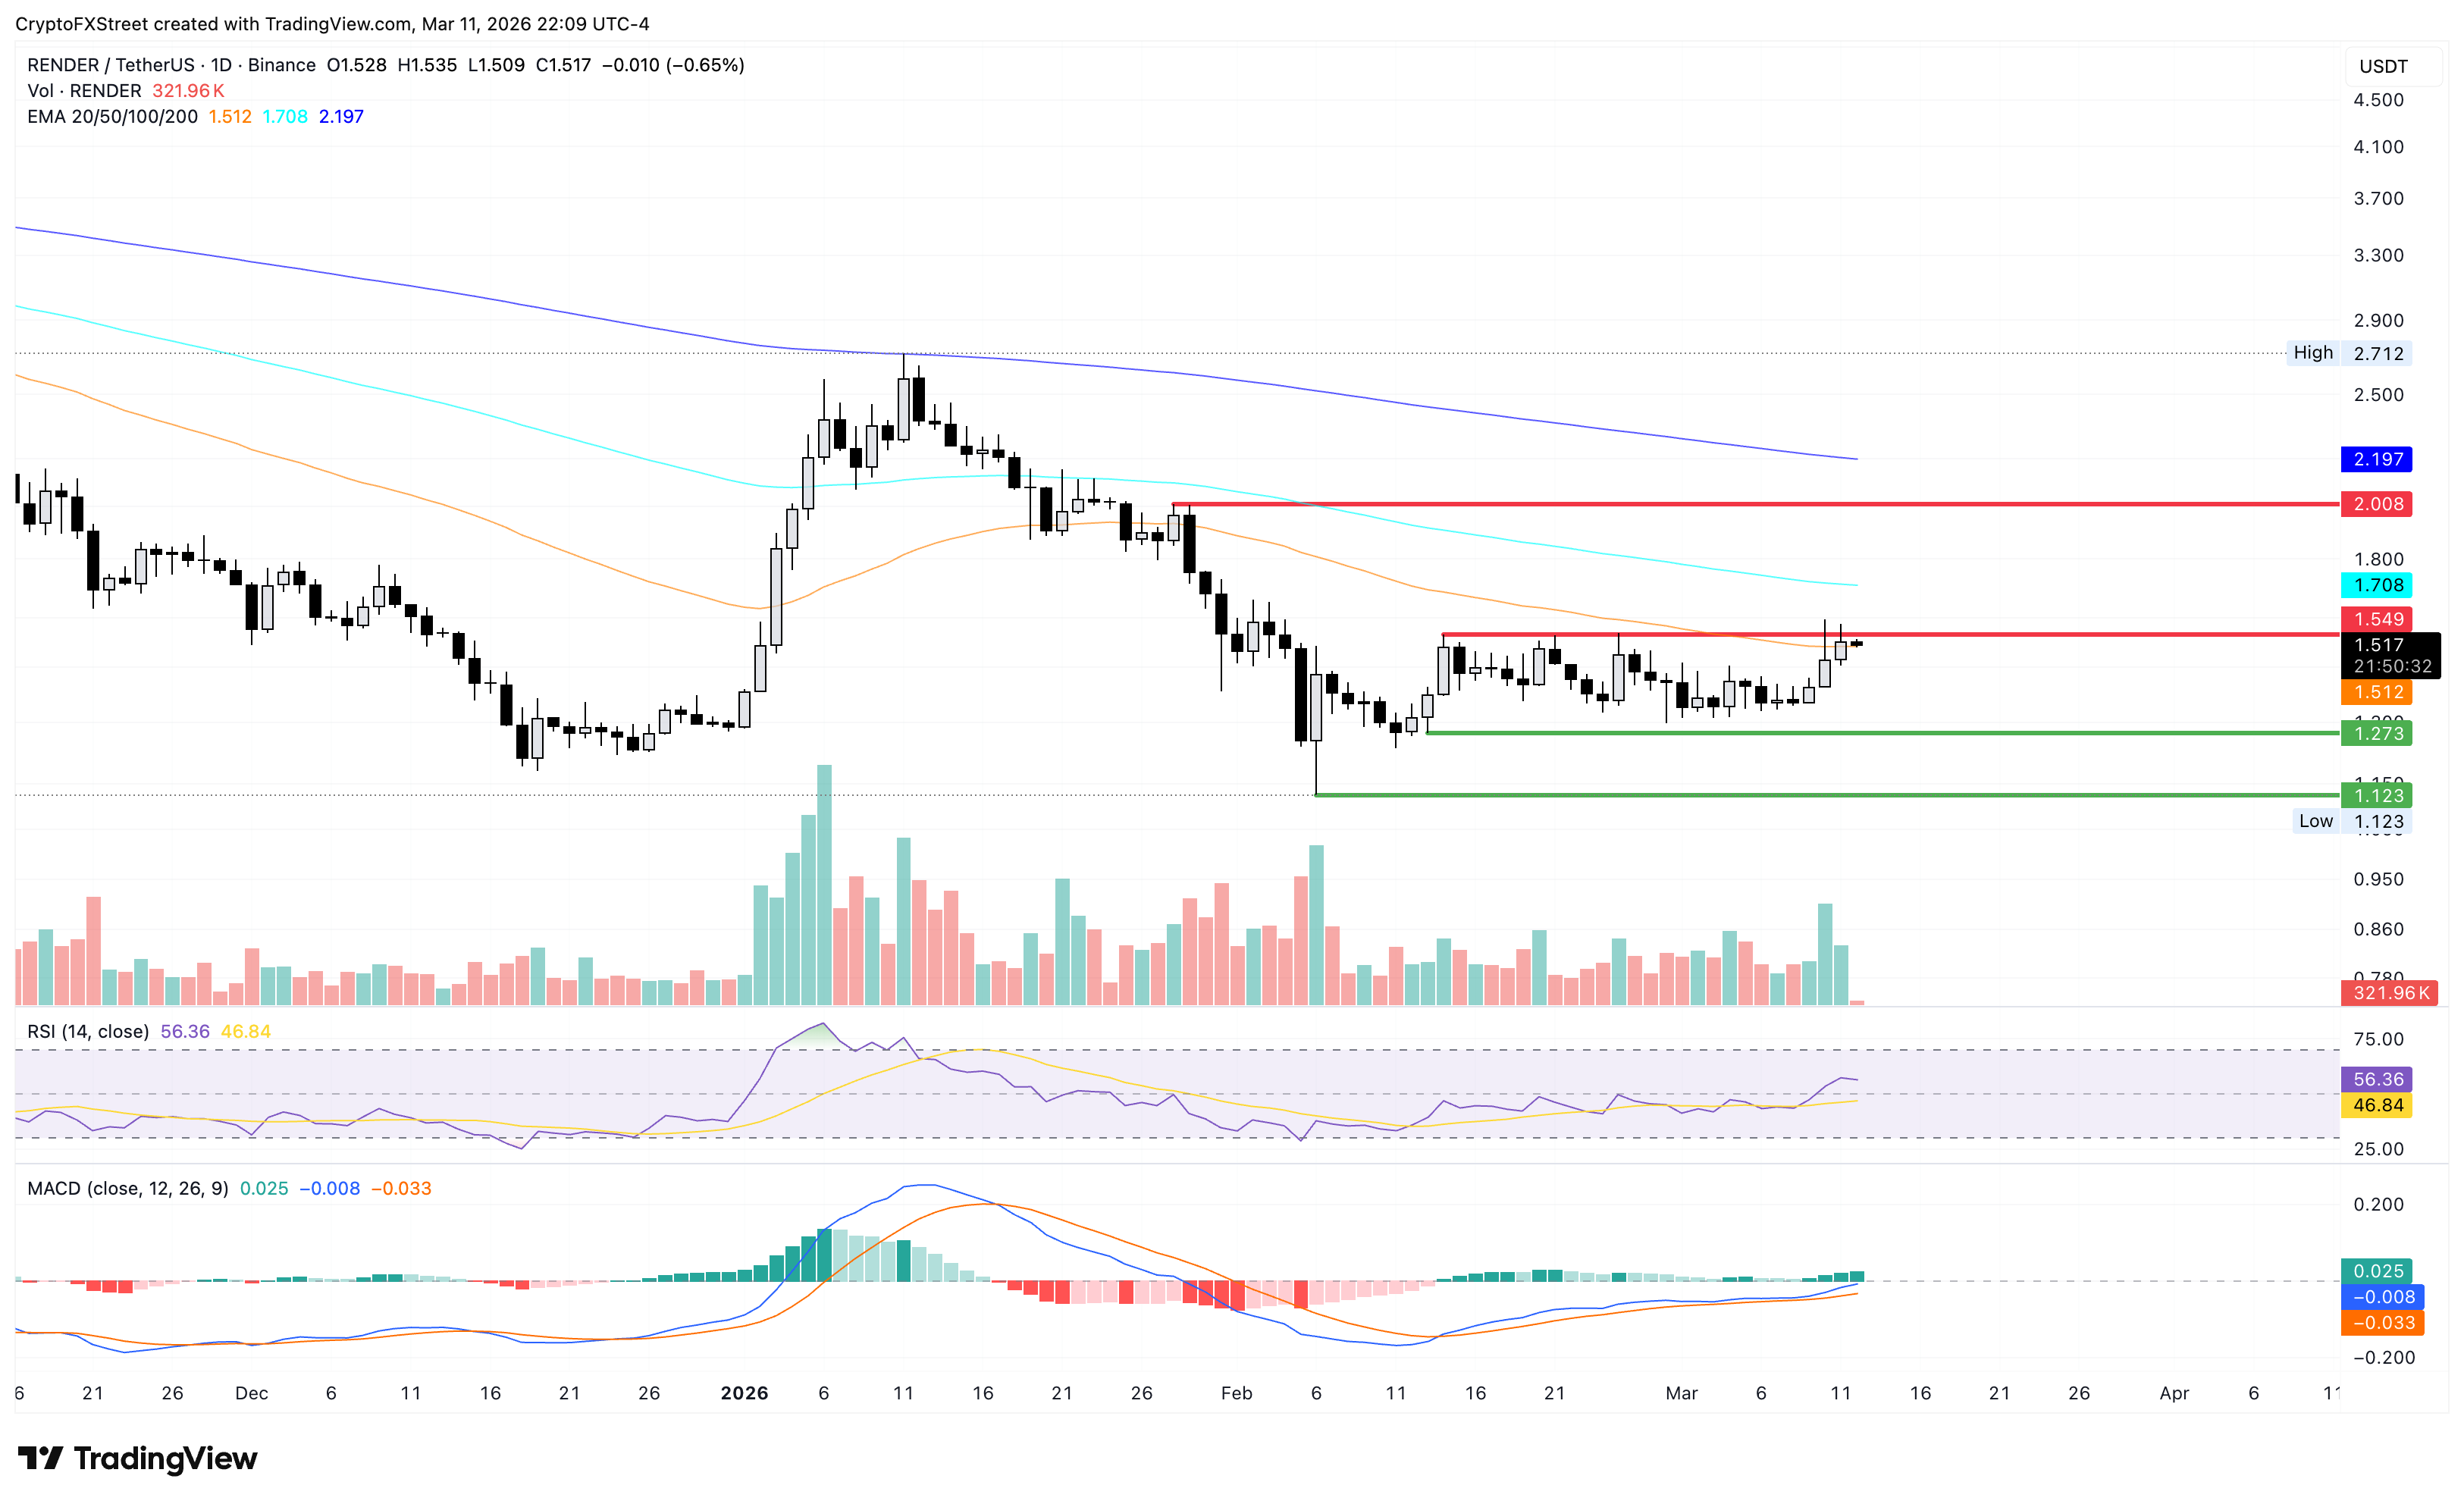
On the downside, immediate support stands at $1.47, guarding last session’s breakout area, with further protection at $1.43 followed by $1.36, which marks the latest swing low cluster.
(The technical analysis of this story was written with the help of an AI tool.)

超过一百万用户依赖 FXStreet 获取实时市场数据、图表工具、专家洞见和外汇新闻。其全面的经济日历和教育网络研讨会帮助交易者保持信息领先、做出审慎决策。FXStreet 拥有约 60 人的团队,分布在巴塞罗那总部及全球各地区。
阅读更多


