
Crypto Overview: Bitcoin hits the 200-day EMA wall as the Bank of Japan mulls over a rate hike
作者 Vishal Dixit
更新: 12 May 2026


热门文章

Bitcoin (BTC) hovers above $81,000 on Monday amid prolonged Middle East tensions and the possibility that the Bank of Japan (BOJ) could raise interest rates. Meanwhile, altcoins extend recovery with Cronos (CRO) and Injective (INJ) emerging as top performers over the last 24 hours.
- Bitcoin holds steady above $81,000 on Tuesday while the US casts doubt on the Iran ceasefire.
- The Bank of Japan is considering a rate hike amid concerns about prolonged tensions in the Middle East.
- Cronos and Injective extend gains over the last 24 hours, emerging as top performers.
Bitcoin (BTC) hovers above $81,000 on Monday amid prolonged Middle East tensions and the possibility that the Bank of Japan (BOJ) could raise interest rates. Meanwhile, altcoins extend recovery with Cronos (CRO) and Injective (INJ) emerging as top performers over the last 24 hours.
Bank of Japan weighs rate hike decision amid delayed US-Iran peace deal
US President Donald Trump rejected Iran’s peace proposal, saying “Iran's proposal is a stupid proposal,” as previously reported by FXStreet. The rejection fueled Brent Oil prices to $103 and West Texas Intermediate Oil prices to $95 on Tuesday, sustaining the risk of high oil prices and global inflation.
To address the uncertainties and impacts of the global oil crisis, the Bank of Japan could consider raising its interest rate from 0.75% to 1%. The last BOJ rate hike to 0.75% from 0.50% on December 18 preceded Bitcoin's combined 25% decline across January and February.
According to the BOJ’s Summary of Opinions from the April monetary policy meeting, multiple members weighed the option of a rate hike to address the negative real rate, prevent the risk of inflation, address the economic slowdown, and address upside risks to prices.
Bitcoin takes the 200-day EMA head-on
Bitcoin extends losses on Tuesday but remains above $81,000 at press time, maintaining a constructive bullish bias as it holds well above the 50-day and 100-day Exponential Moving Averages (EMAs), setting up a bullish crossover, while still trading below the longer-term 200-day EMA at roughly $82,894, which acts as the next cap.
The Relative Strength Index (RSI) around 62 and a mildly positive Moving Average Convergence Divergence (MACD) reading suggest buyers retain the upper hand, though upside momentum has moderated as price consolidates just under the 200-day barrier.
On the topside, immediate resistance is seen at the 200-day EMA near $82,894, and a clear daily close above this level would confirm the overhead rising resistance trendline and open the way for another leg higher in the broader uptrend.
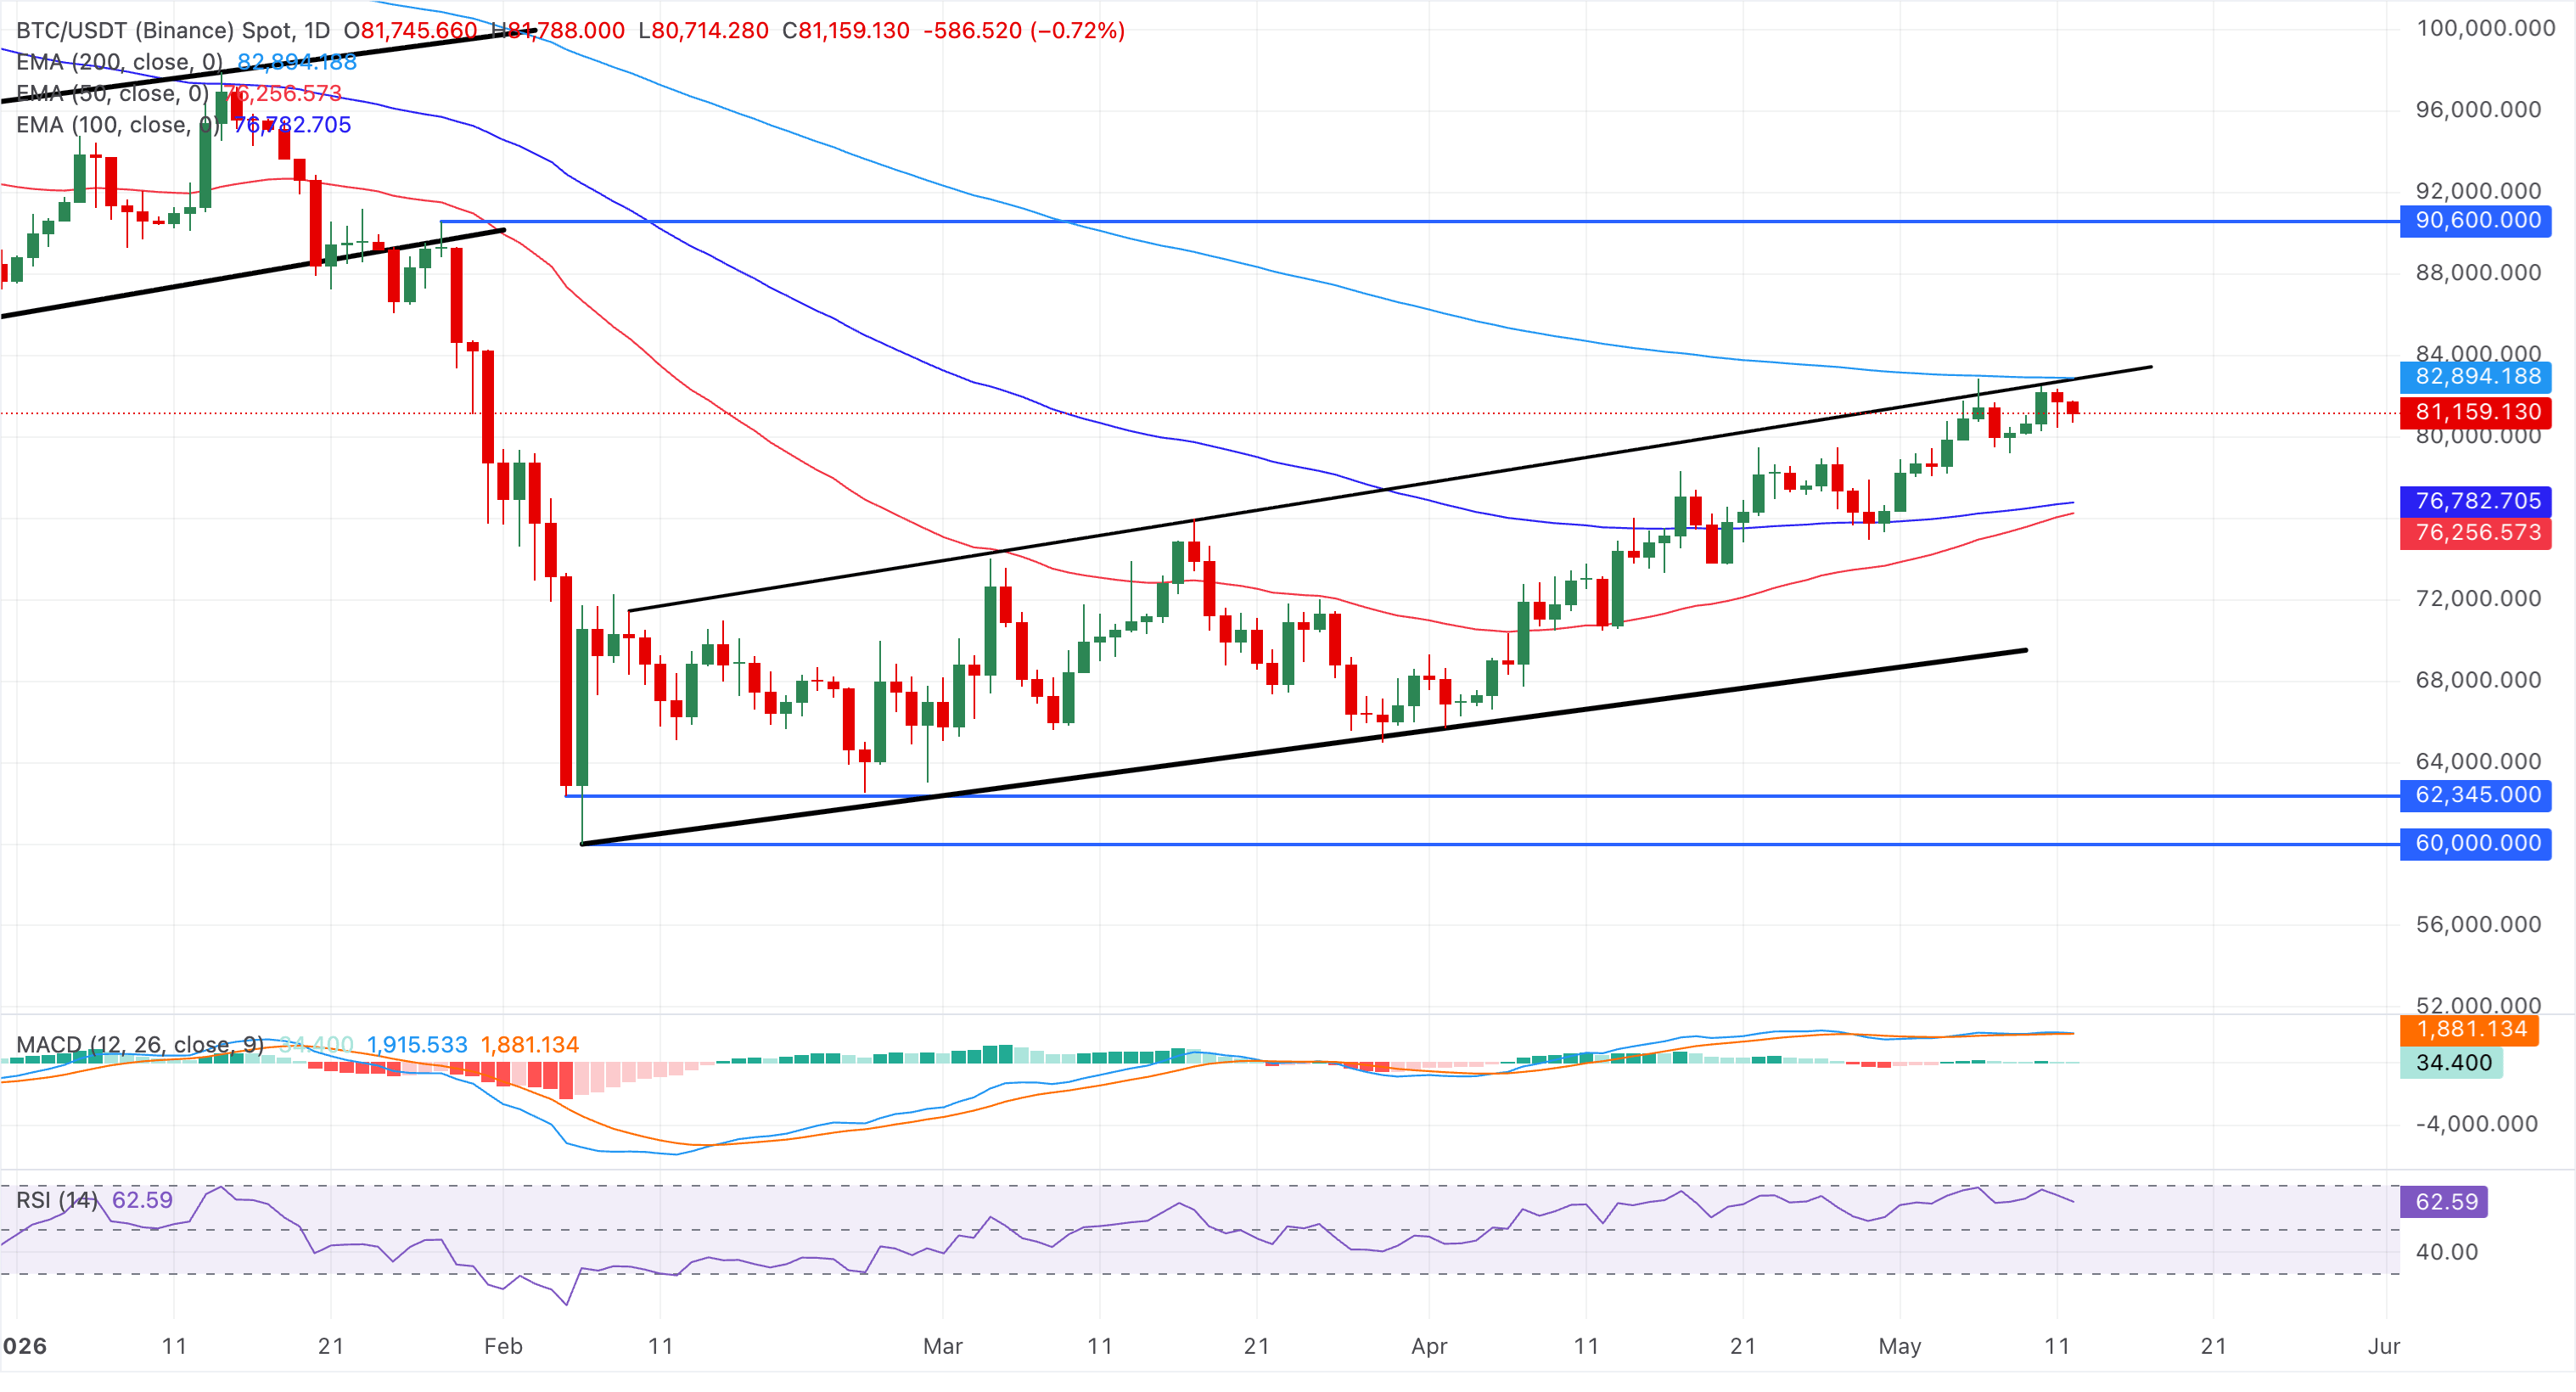
On the downside, initial support is located near the 100-day EMA at $76,782 and the 50-day EMA at $76,256, while the prior trendline break zone around $69,847 serves as a more distant but important structural floor if a sharper correction unfolds.
Top Crypto Gainers: Cronos and Injective lead the altcoin rally
Cronos trades at $0.0801, holding above the 50-day and 100-day EMAs at around $0.0720 and $0.0778, respectively, which keeps the near-term bias positive. The pair is advancing into overbought territory, with the RSI at 75, while the MACD histogram expands on the positive side, suggesting firm bullish momentum even as price approaches nearby overhead barriers.
Immediate resistance is seen at the 100-day EMA at $0.0778, followed by a tighter band formed by the 200-day EMA at $0.0892, near the 50% retracement at roughly $0.0894, measured over the downside swing from $0.1153 to $0.0673.
Looking down, initial support aligns with the 50-day EMA at $0.0720, providing a deeper floor if a pullback unfolds.
On the other hand, Injective sustains above $4.50 at press time on Tuesday, holding a firm bullish bias as price extends above the 50-day and 100-day EMAs at $3.56 and $3.73 and reclaims the 50% Fibonacci retracement at $4.28 of the downswing from $5.90 to $2.66.
The 200-day EMA at $5.13 and the 78.6% Fibonacci retracement at $5.20 serve as the next key resistance levels.
The RSI at 74 extends a positive trend into the overbought zone while the upward-moving MACD and signal lines expand histogram bars above the zero line, suggesting strong but stretched upside momentum.
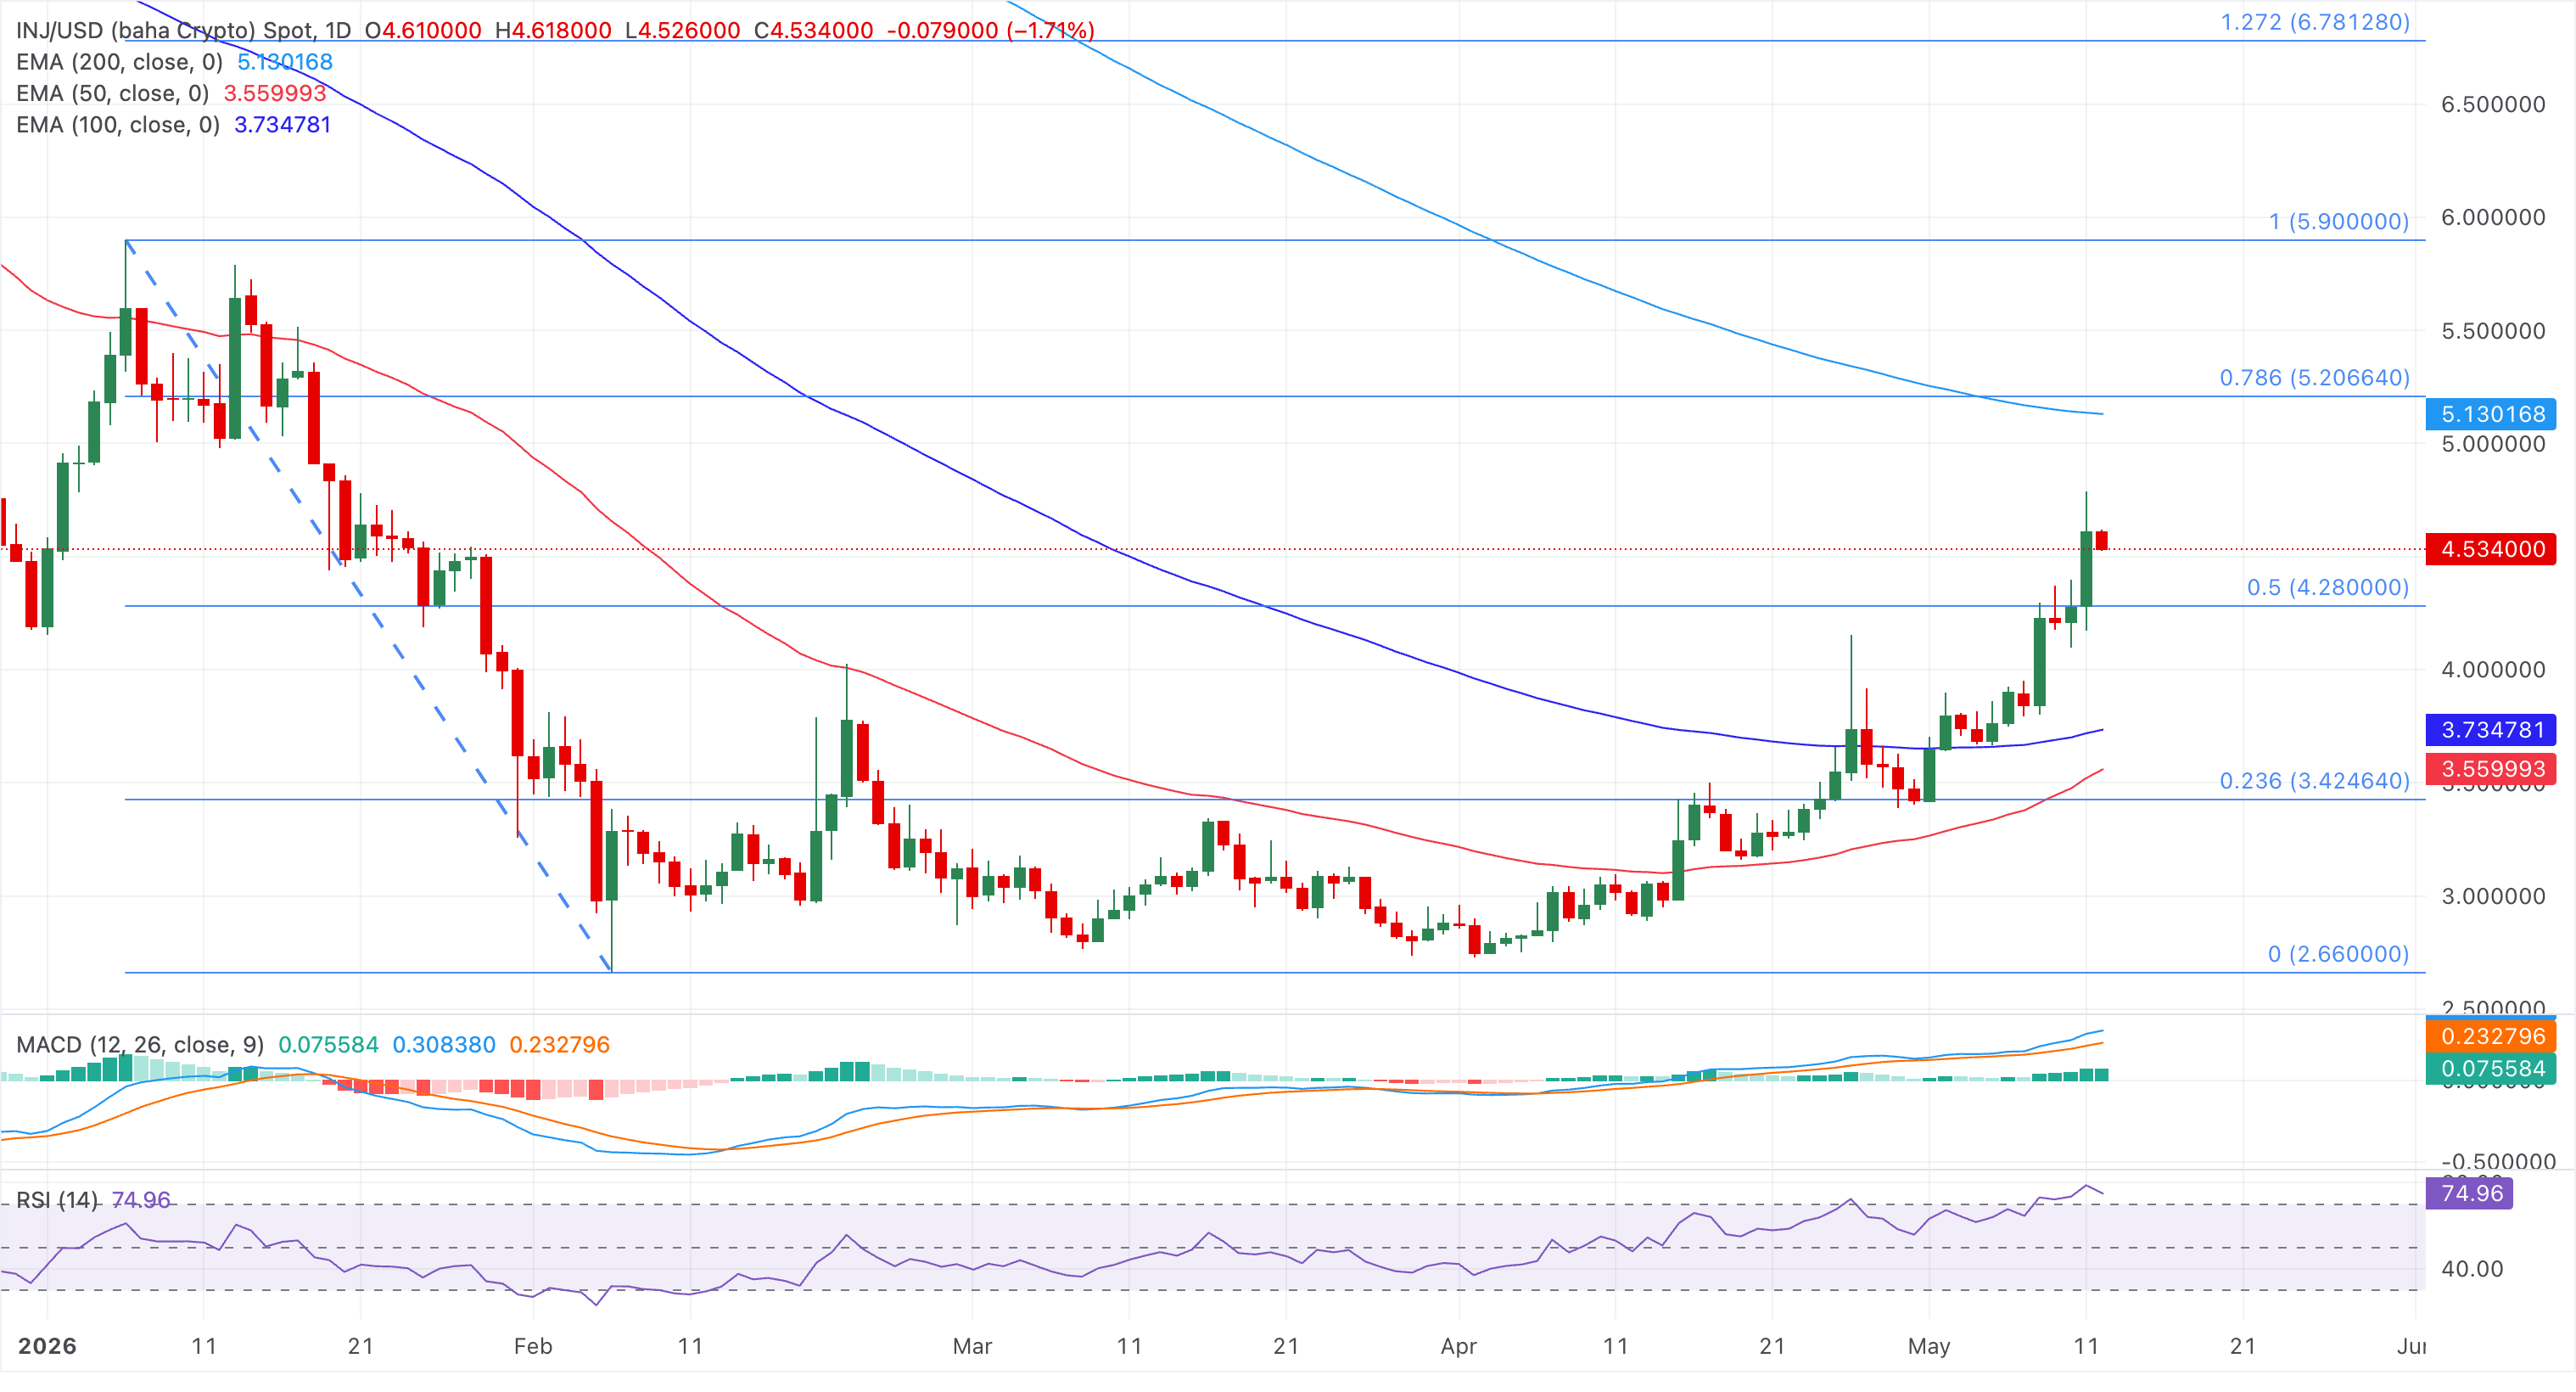
The immediate support is seen at the 50% retracement near $4.28, ahead of the 100-day EMA at $3.73, with the 50-day EMA at $3.56 reinforcing broader trend support further below.
(The technical analysis of this story was written with the help of an AI tool.)

超过一百万用户依赖 FXStreet 获取实时市场数据、图表工具、专家洞见和外汇新闻。其全面的经济日历和教育网络研讨会帮助交易者保持信息领先、做出审慎决策。FXStreet 拥有约 60 人的团队,分布在巴塞罗那总部及全球各地区。
阅读更多


