
Crypto Overview: Stellar, Pyth Network extend rebound amid broader market stress
作者 Vishal Dixit
更新: 1 Jul 2026


热门文章

The broader cryptocurrency market remains heavy, with Bitcoin (BTC) trading below $59,000 at press time on Wednesday, as US President Donald Trump weighs an all-out war with Iran but opts for diplomatic talks.
- Bitcoin hovers below $59,000 on Wednesday, after roughly 3% losses the previous day.
- Market sentiment remains heavy as US President Trump weighs all-out war on Iran.
- Stellar and Pyth Network emerge as top gainers over the last 24 hours.
The broader cryptocurrency market remains heavy, with Bitcoin (BTC) trading below $59,000 at press time on Wednesday, as US President Donald Trump weighs an all-out war with Iran but opts for diplomatic talks. Meanwhile, Stellar (XLM) and Pyth Network (PYTH) emerge as bullish outliers over the last 24 hours.
Crypto investors stick to the sidelines
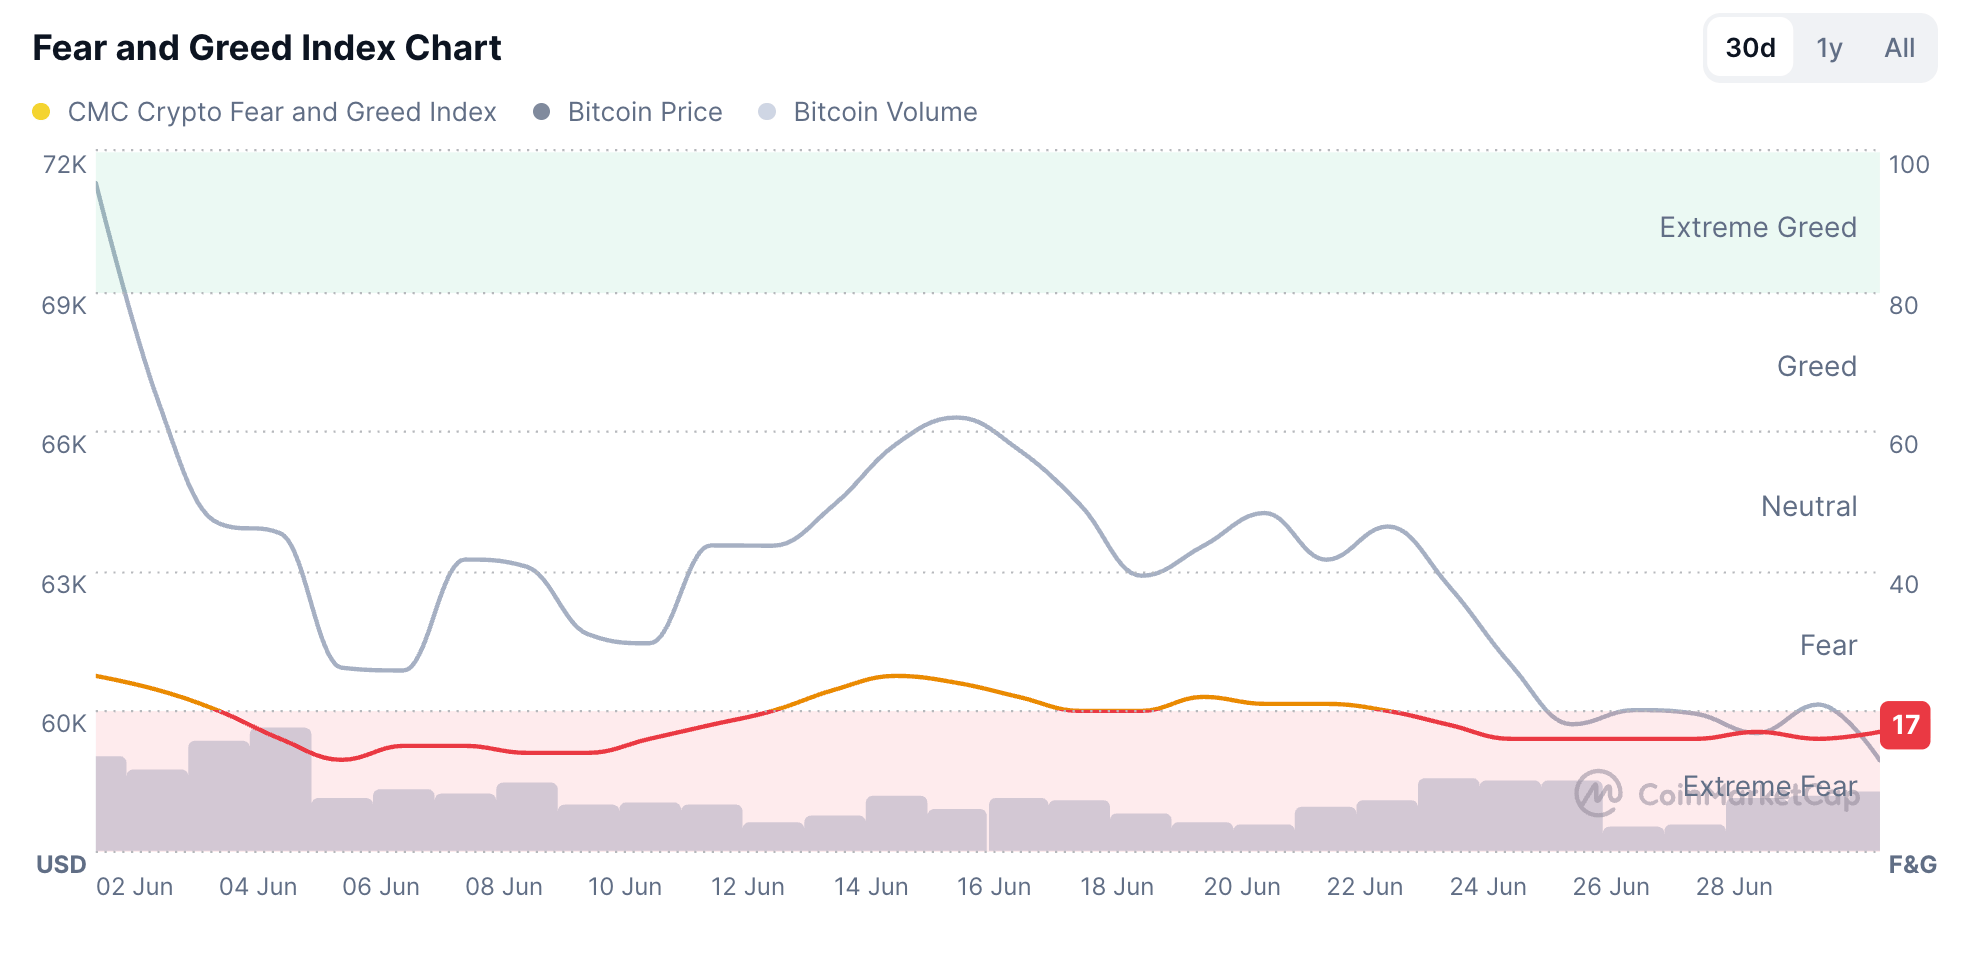
The broader crypto market sustains a risk-off sentiment as Bitcoin remains below $60,000 amid emerging hints of a renewed US-Iran war. CoinMarketCap’s Fear and Greed Index hovers near 17, maintaining its Extreme Fear signal.
US President Donald Trump held multiple meetings with Defense Secretary Pete Hegseth and Chairman of the Joint Chiefs of Staff Gen. Dan Caine about a return to all-out war with Iran, as previously reported by FXStreet. However, Trump has decided to stick with the diplomatic route for now, keeping the 60-day ceasefire over the Strait of Hormuz intact.
Bitcoin vulnerable to deeper losses
Bitcoin hovers above the June 25 low of $58,115, maintaining a bearish bias with roughly a 3% decline the previous day. Momentum stays fragile, with the Moving Average Convergence Divergence (MACD) and signal line moving flat, while the Relative Strength Index (RSI) at 31 hovers just above oversold territory, suggesting that any rebound would initially be corrective within a broader bearish context.
A decisive close below $58,115 could extend Bitcoin's decline toward the July 5, 2024 support level of $53,485.
On the topside, immediate resistance appears at the $60,000 horizontal level, followed by the 50-day Exponential Moving Average (EMA) at about $66,343, which reinforces the broader cap on recovery attempts.
Stellar and Pyth Network regain strength
Stellar edges higher by 6% at press time on Wednesday, extending its 8% gains from the previous day. XLM crosses above the 50- and 200-day EMAs at $0.1897 and $0.1974, respectively, keeping the near-term bias mildly bullish.
The RSI near 54 suggests constructive but not overextended momentum, while an uptick in the MACD line indicates a possible bullish crossover with the signal line, hinting that upside traction is improving but not yet impulsive.
A decisive close above the 200-day EMA at $0.1974 could extend the XLM rally toward the $0.2500 round figure, which capped gains on June 18.
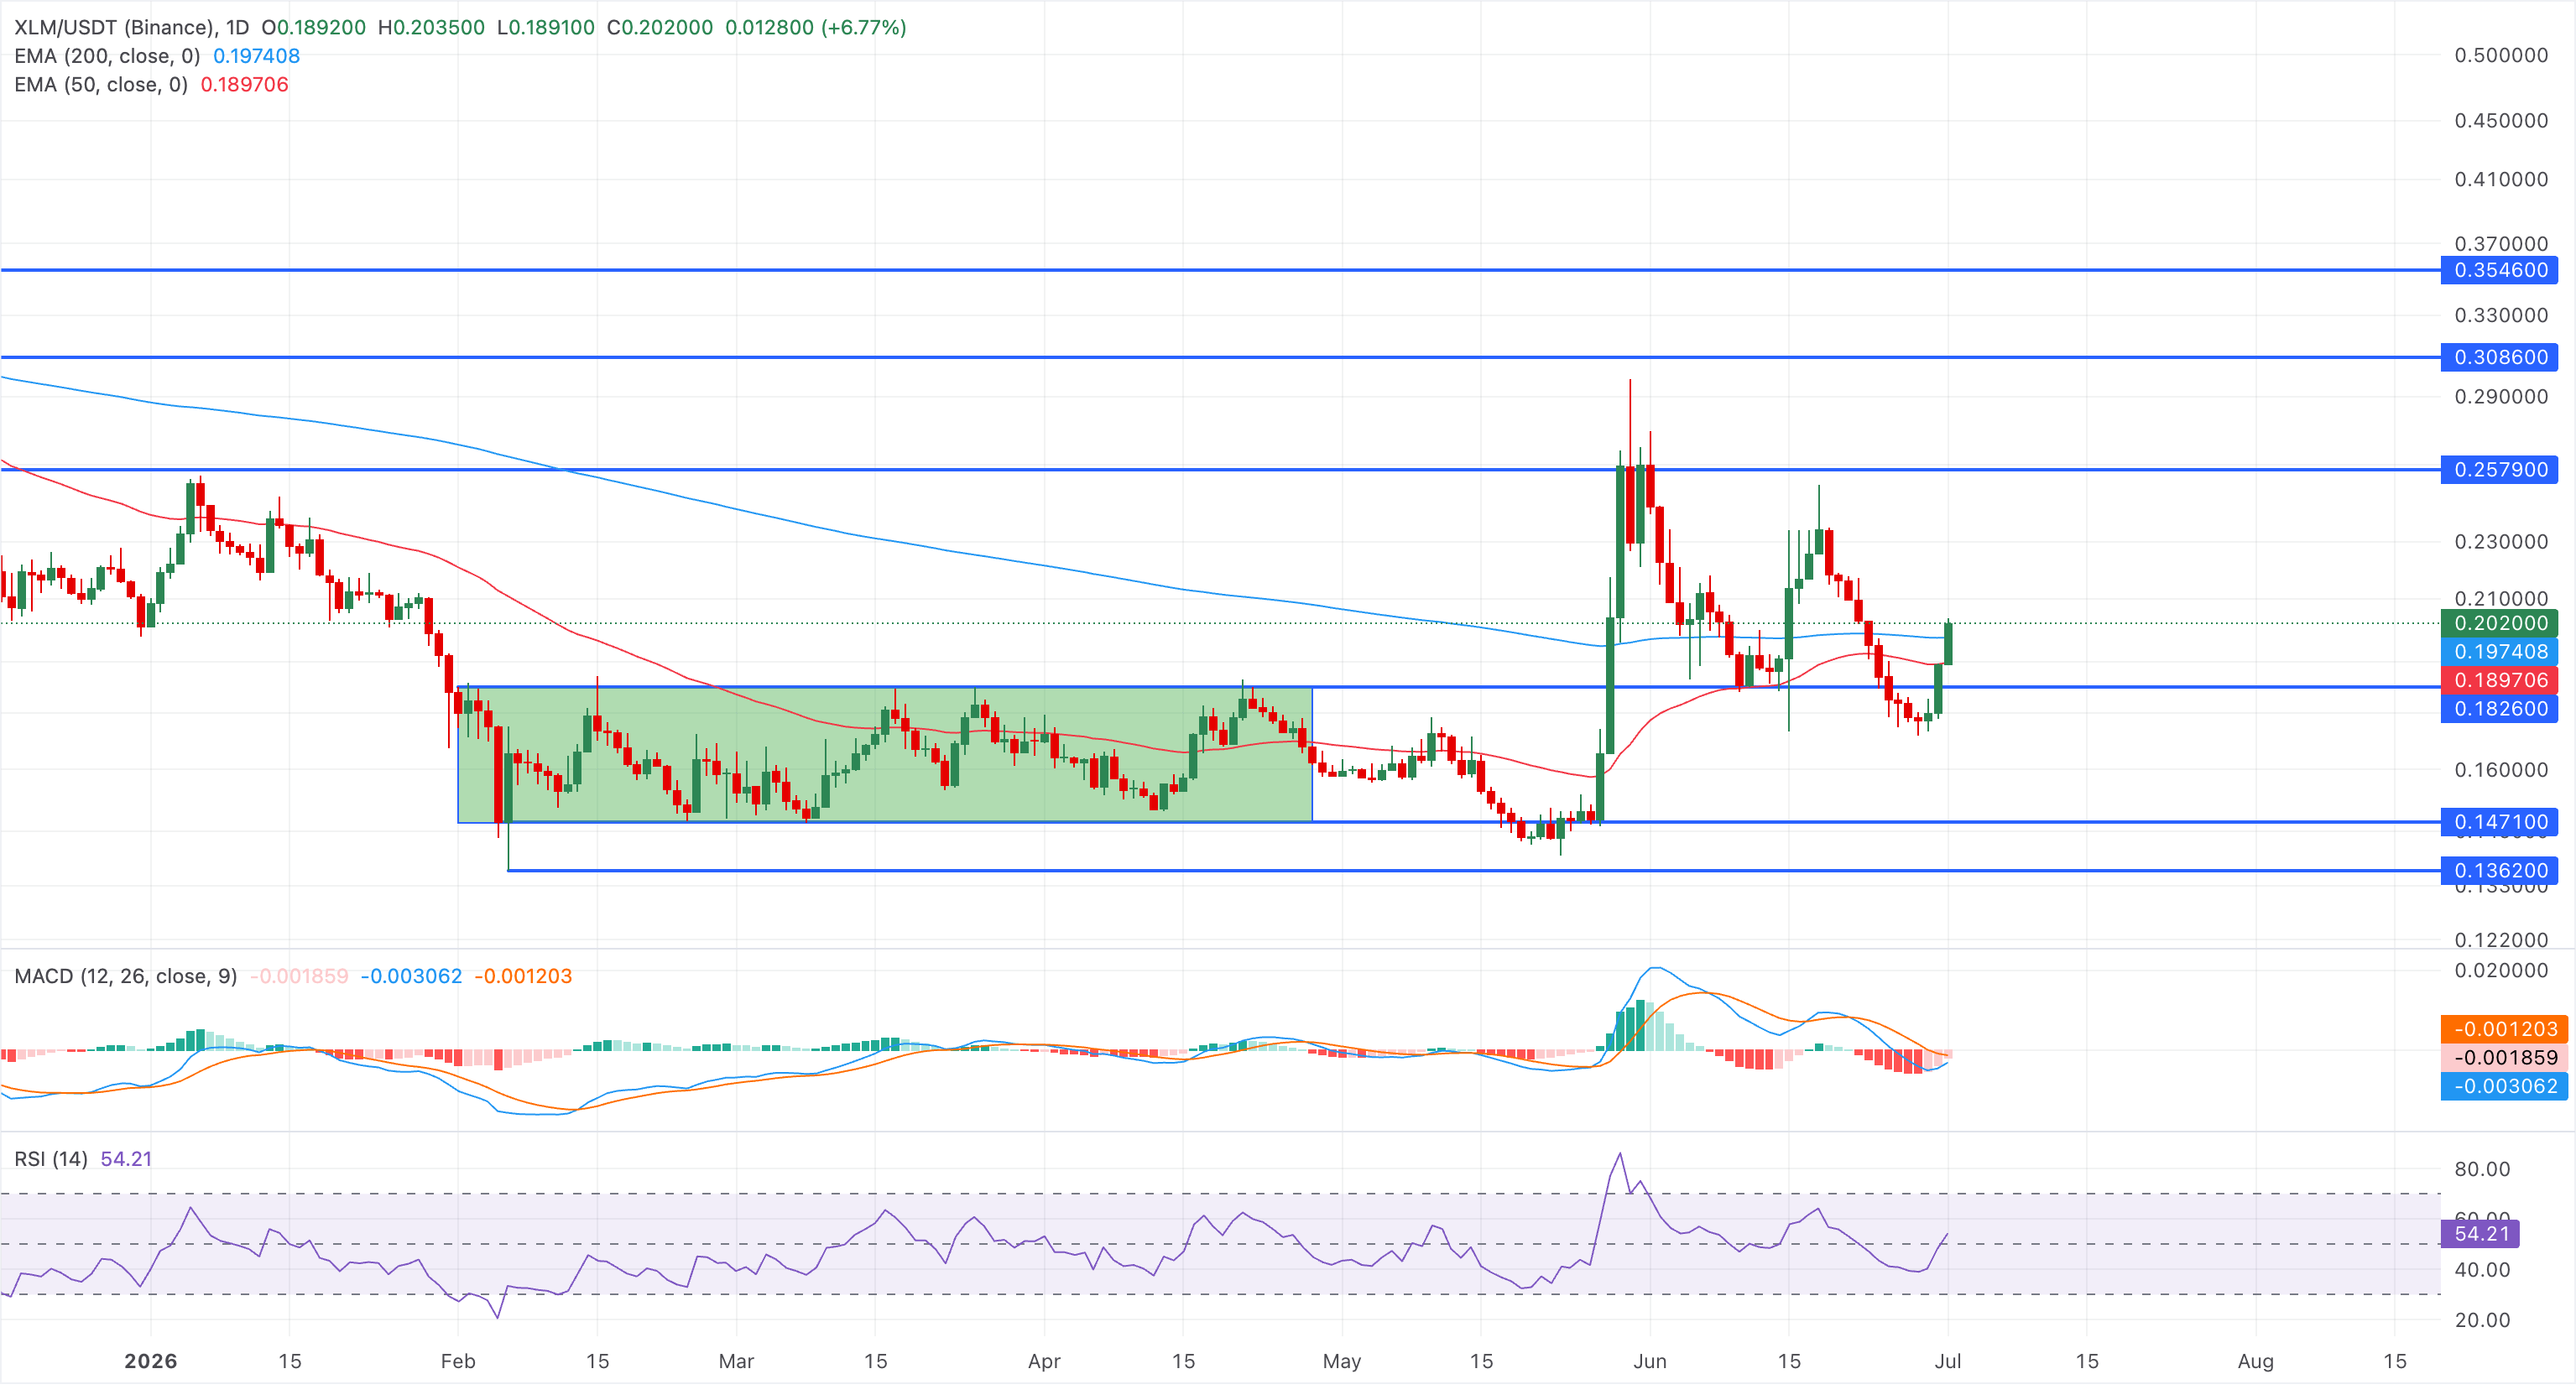
Looking down, immediate support is seen at the $0.1974 area defined by the 200-day EMA, followed by the $0.1897 region where the 50-day EMA converges as a deeper demand zone.
Pyth Network shows a steadier recovery with the third consecutive day of gains testing the 50-day EMA at $0.03854. At the time of writing, PYTH extends gains above the 23.6% Fibonacci retracement level at $0.03529, measured over the downswing from $0.06310 to $0.02950.
The MACD and signal line rise again as positive histograms expand, while the RSI at 54 suggests mildly improving momentum.
On the topside, immediate resistance appears at the 50-day EMA near $0.0385, with the 50% retracement of the latest swing at $0.04314 acting as the next barrier.
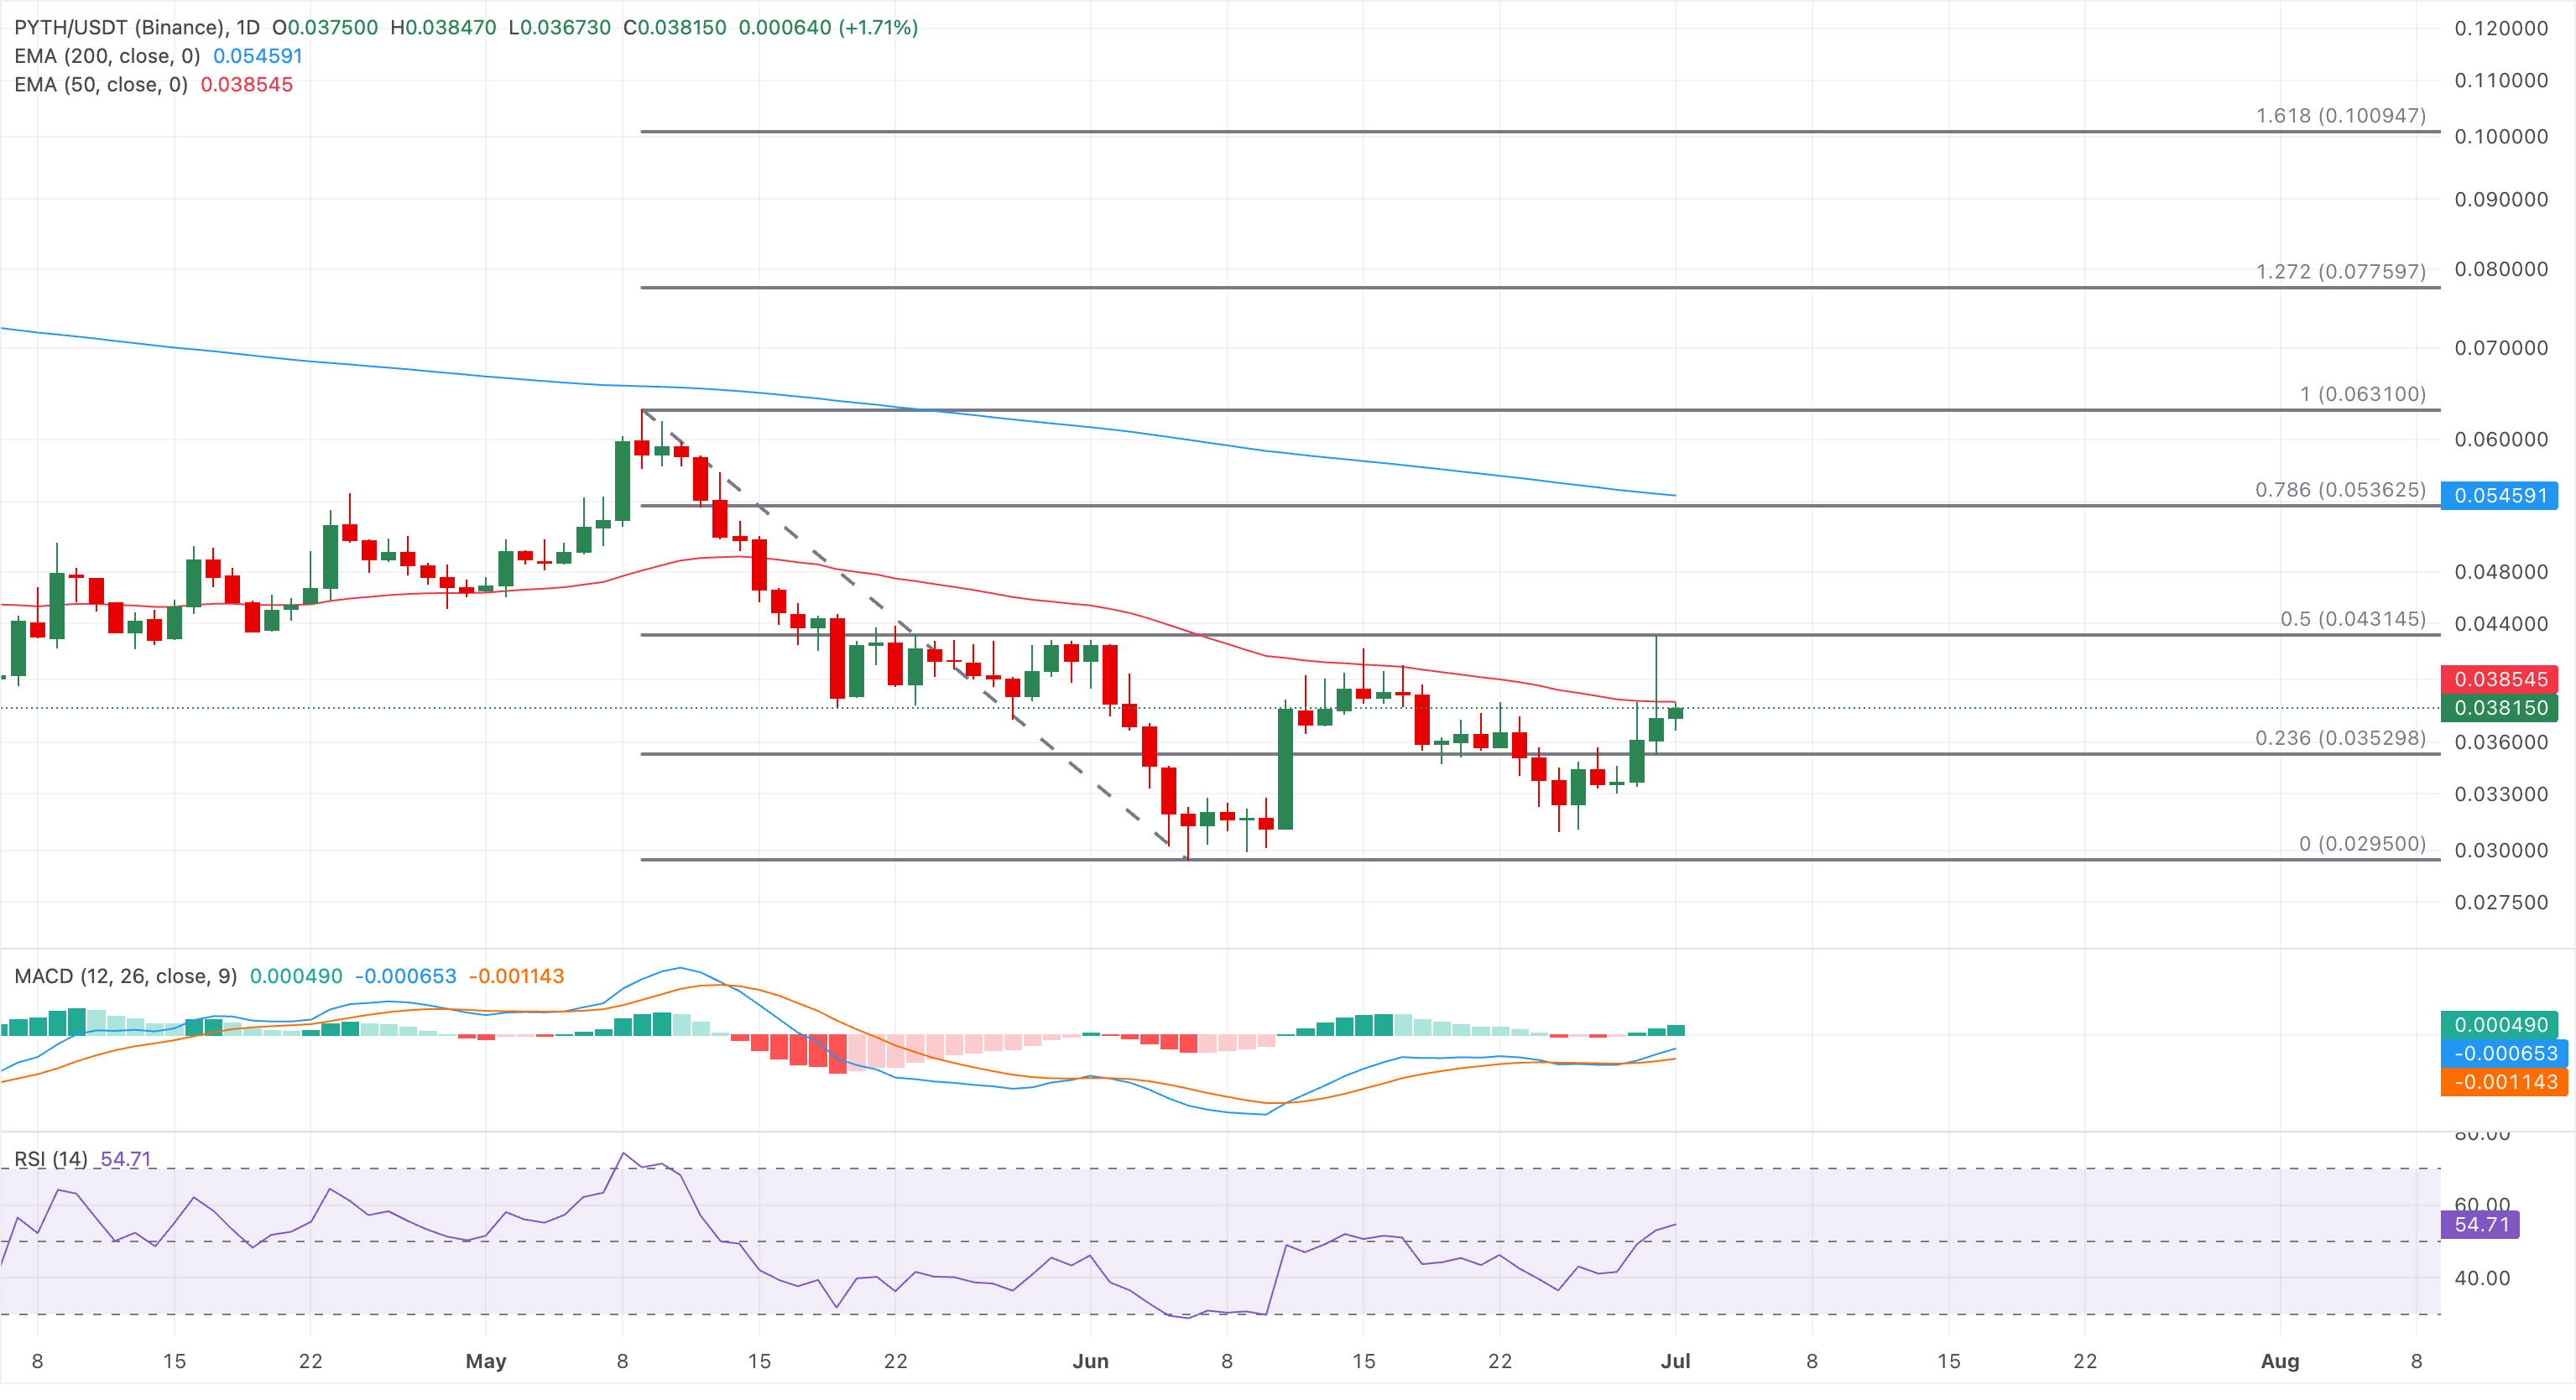
On the downside, initial support aligns with the 23.6% Fibonacci retracement at $0.03529, while a deeper slide would expose the swing-low anchor at $0.02950 as the next significant demand area.
(The technical analysis of this story was written with the help of an AI tool.)

超过一百万用户依赖 FXStreet 获取实时市场数据、图表工具、专家洞见和外汇新闻。其全面的经济日历和教育网络研讨会帮助交易者保持信息领先、做出审慎决策。FXStreet 拥有约 60 人的团队,分布在巴塞罗那总部及全球各地区。
阅读更多


