
Crypto Today: Bitcoin, Ethereum, XRP plunge as risk-off sentiment persists, liquidations soar
作者 John Isige
发布日期: 30 Jan 2026 | 修改日期: 30 Jan 2026


热门文章

Bitcoin (BTC) is extending its downside momentum at the time of writing on Friday, slipping below the critical $84,450 support level as a confluence of macroeconomic headwinds and risk-off sentiment grips global markets.
- Bitcoin trades under pressure, triggering nearly $405 million in long liquidations amid geopolitical tensions and macroeconomic risks.
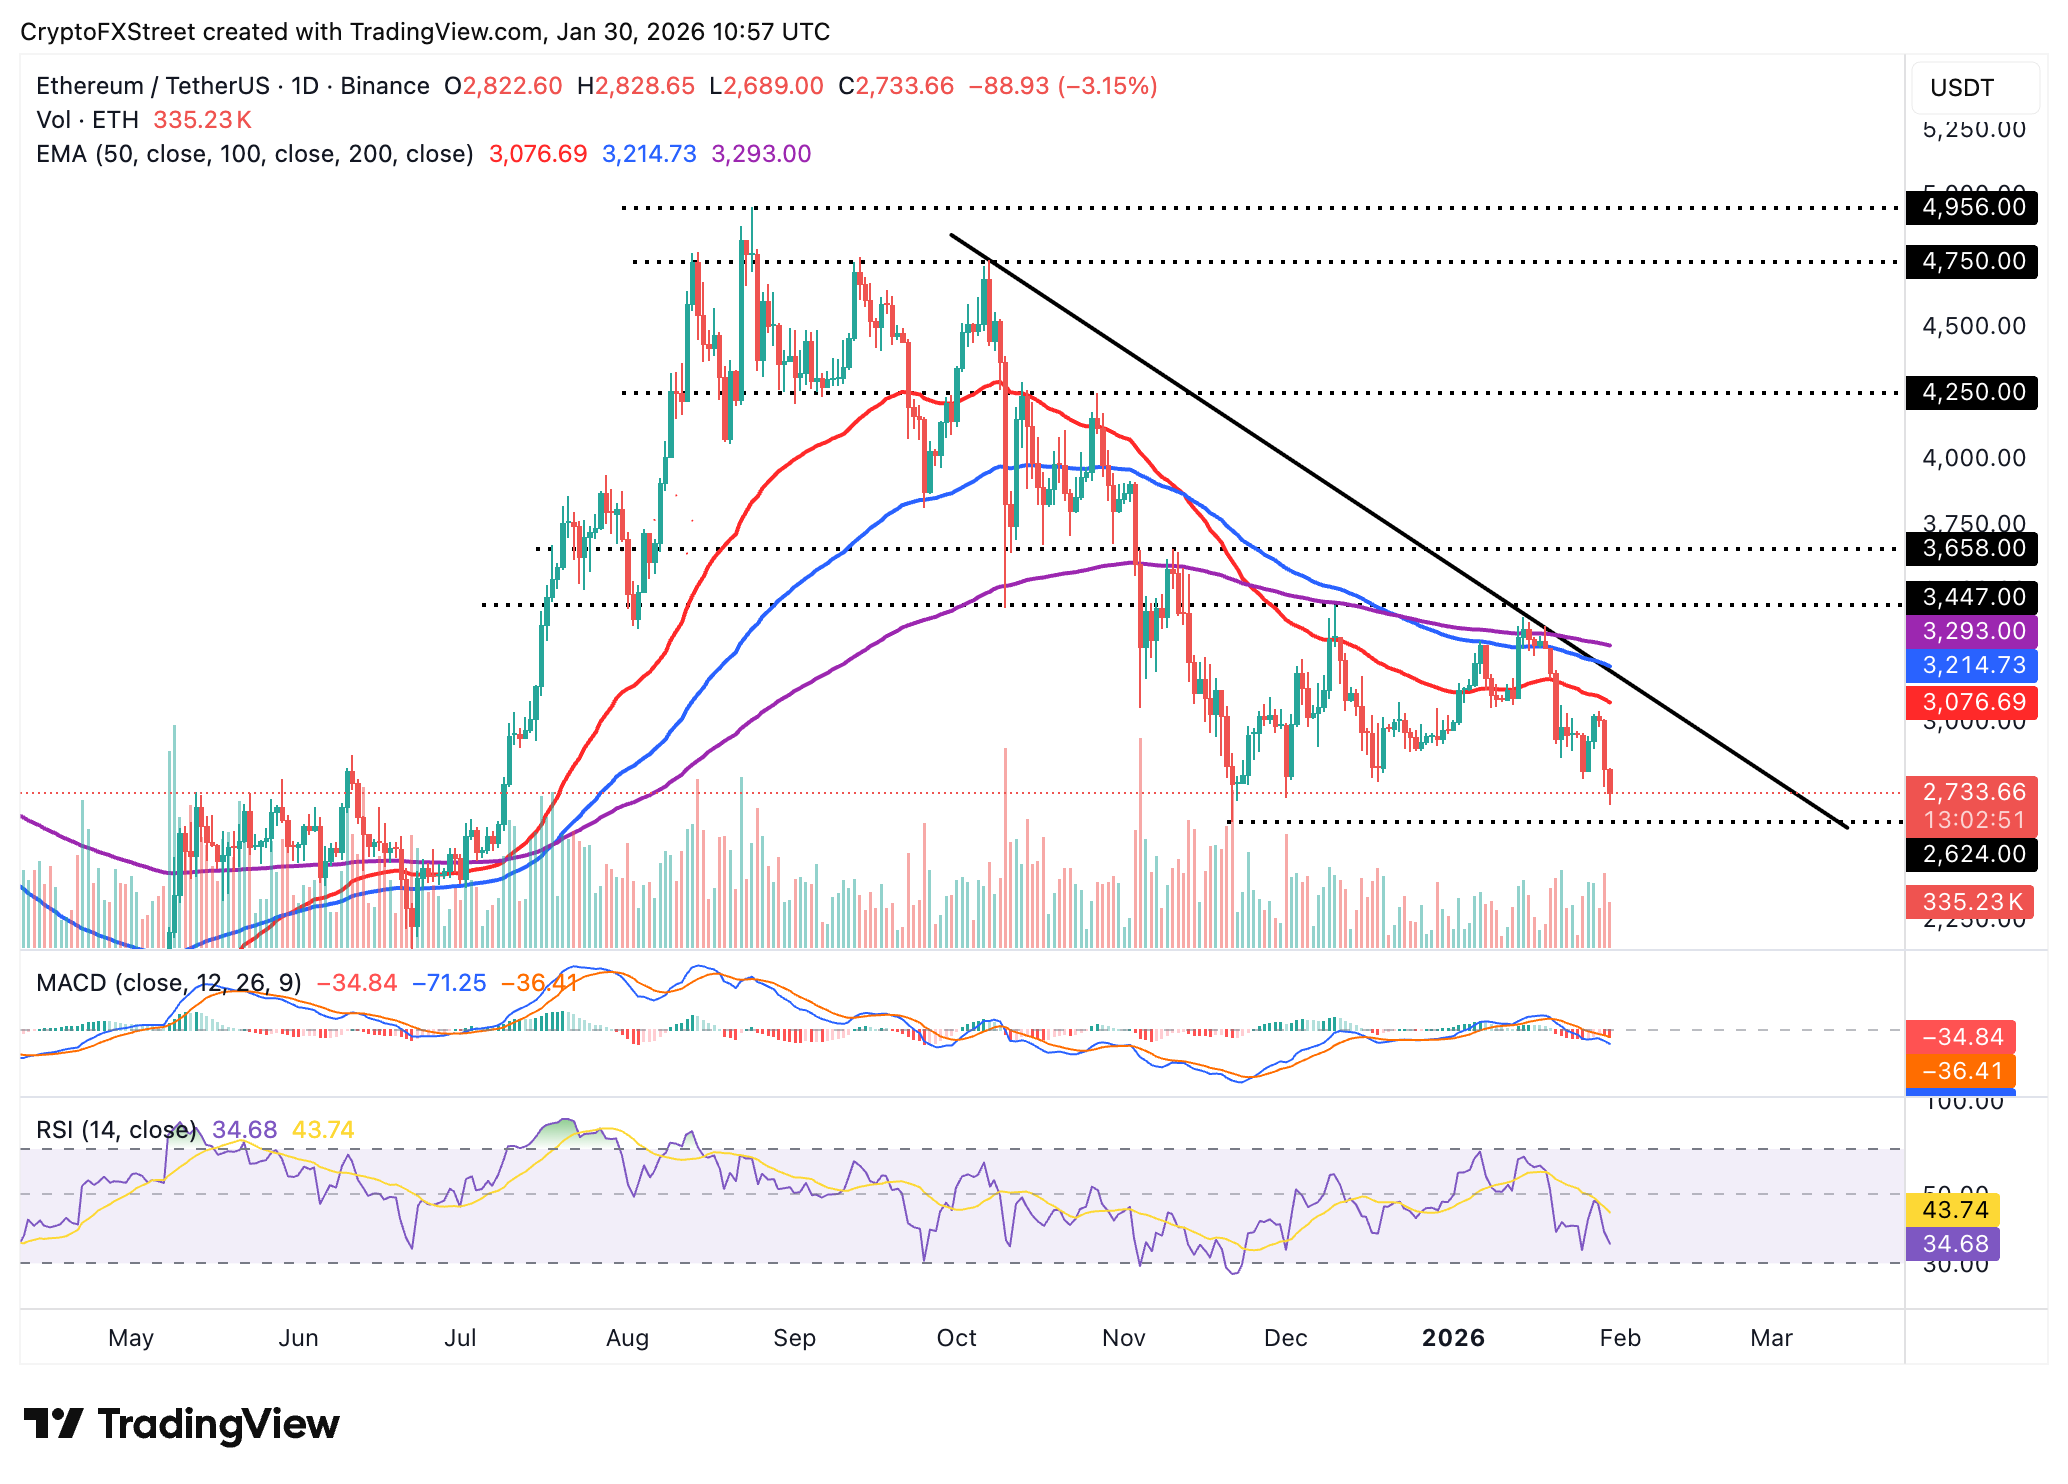
- Ethereum grinds toward November lows at $2,624, weighed down by retail investors’ exodus.
- XRP’s April support at $1.61 in focus as market sentiment deteriorates and technicals weaken.
Bitcoin (BTC) is extending its downside momentum at the time of writing on Friday, slipping below the critical $84,450 support level as a confluence of macroeconomic headwinds and risk-off sentiment grips global markets.
The King of Crypto is down over 2% intraday and over 8% from its weekly high at $90,600, triggering a cascade of liquidations across the crypto market. Ethereum (ETH) and Ripple (XRP) mirror BTC’s weakness, with both altcoins surrendering key technical levels amid intense bearish pressure.
BTC, ETH, XRP sell-off amid broader market risk-off sentiment
Bitcoin’s sell-off kicked off on Thursday, as risk-off sentiment spread across global markets after the Federal Reserve (Fed) paused its monetary policy easing cycle, leaving interest rates unchanged on Wednesday. Fed Chair Jerome Powell took a hawkish stance during the post-meeting press conference. The lack of signals for future rate cuts has reduced risk appetite for high-risk assets such as Bitcoin and altcoins.
Geopolitical tensions in the Middle East, speculation over the Fed Chair nomination, and Exchange-Traded Funds (ETFs) outflows are among the factors that exacerbated the sell-off in Bitcoin to $81,118, marking its intraday low.
The headwinds triggered massive long liquidations with leverage traders losing over $405 million on Friday and approximately $433 million on Thursday. With risk-off sentiment still persistent, Bitcoin is at risk of extending its correction below the $80,000 psychological support.
“The move lower is being compounded by leveraged position liquidations as over-leveraged longs get flushed, adding mechanical selling pressure to an already fragile tape,” Chris Newhouse, business development head at Ergonia, told Bloomberg.
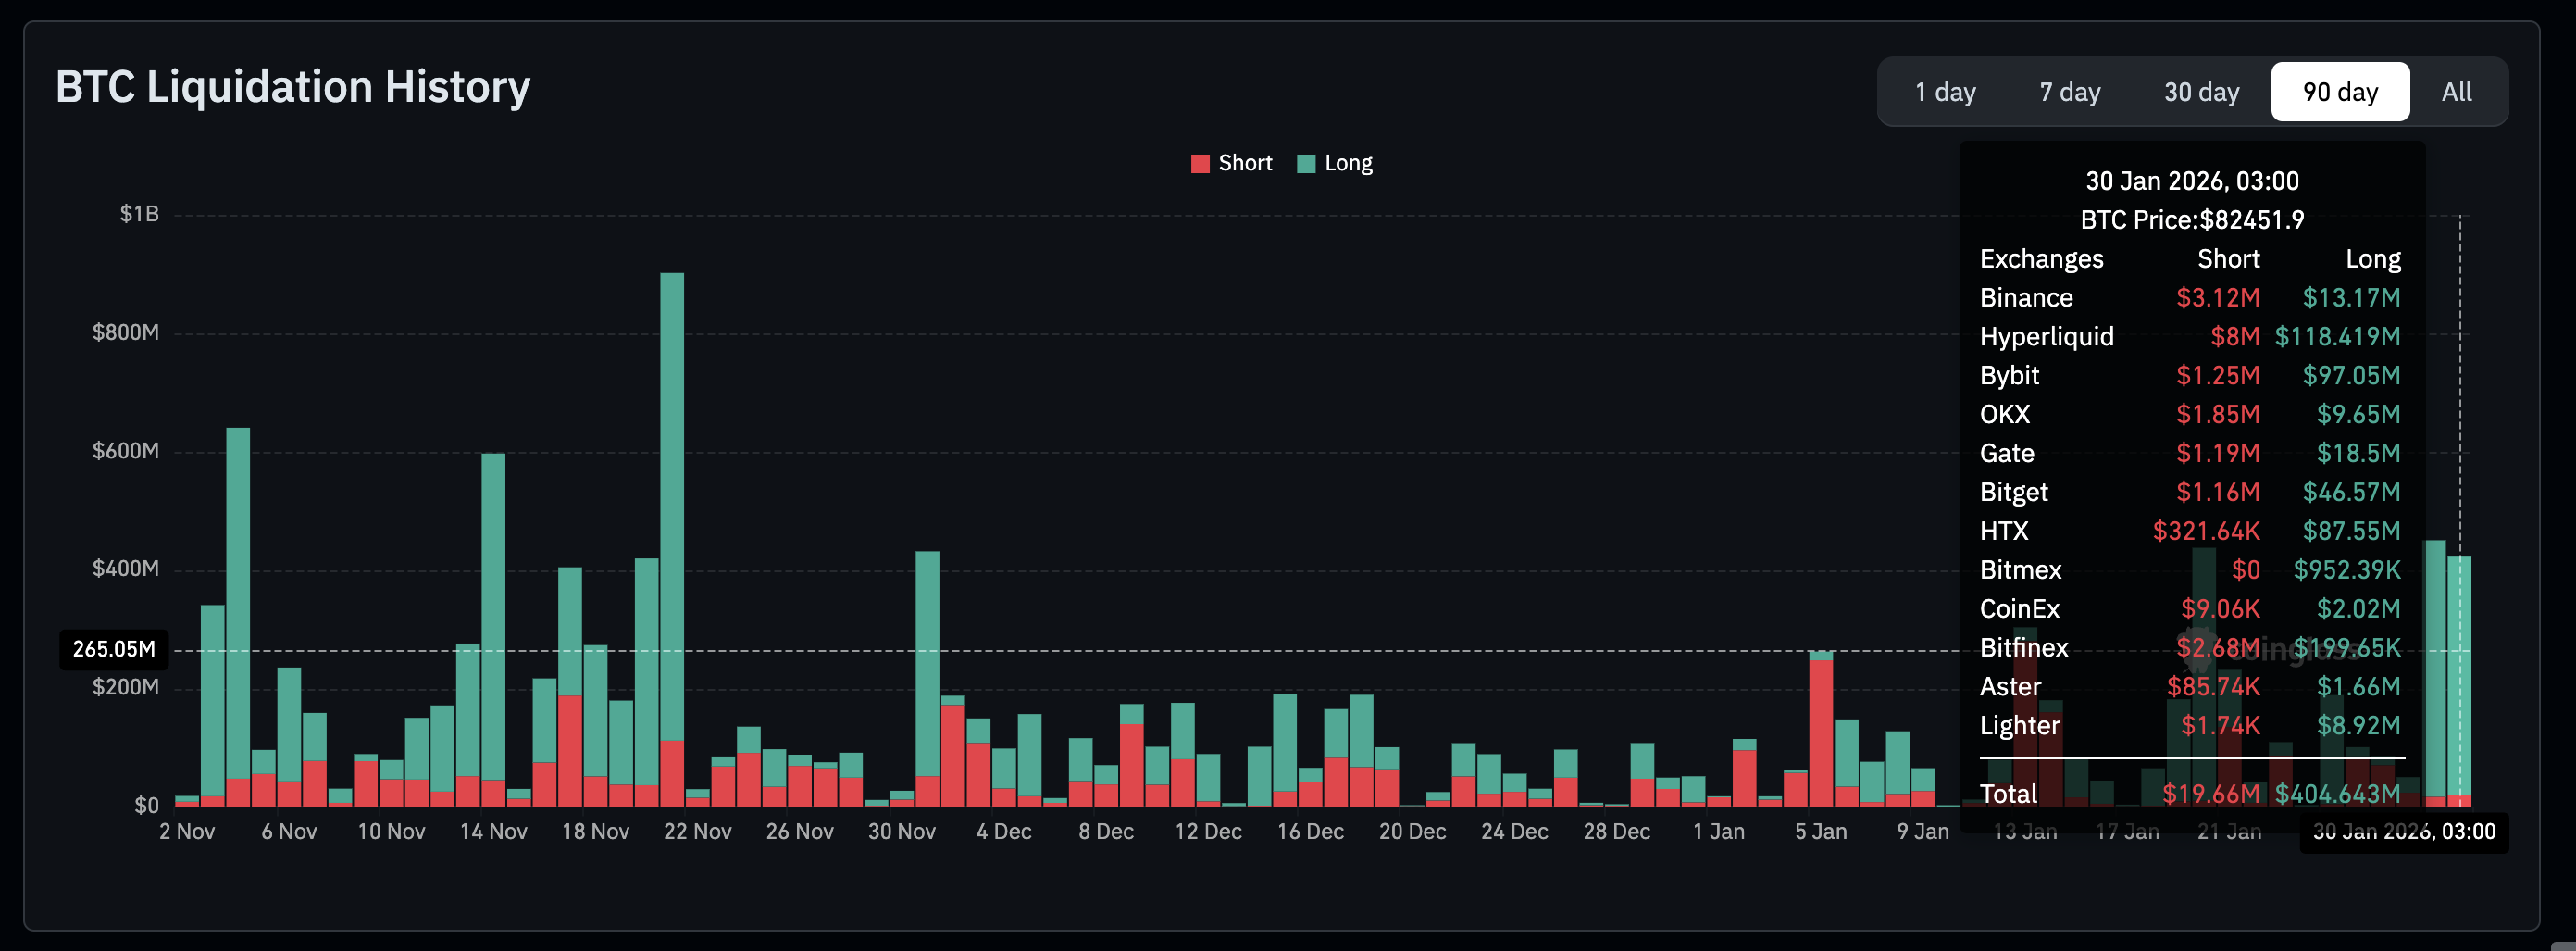
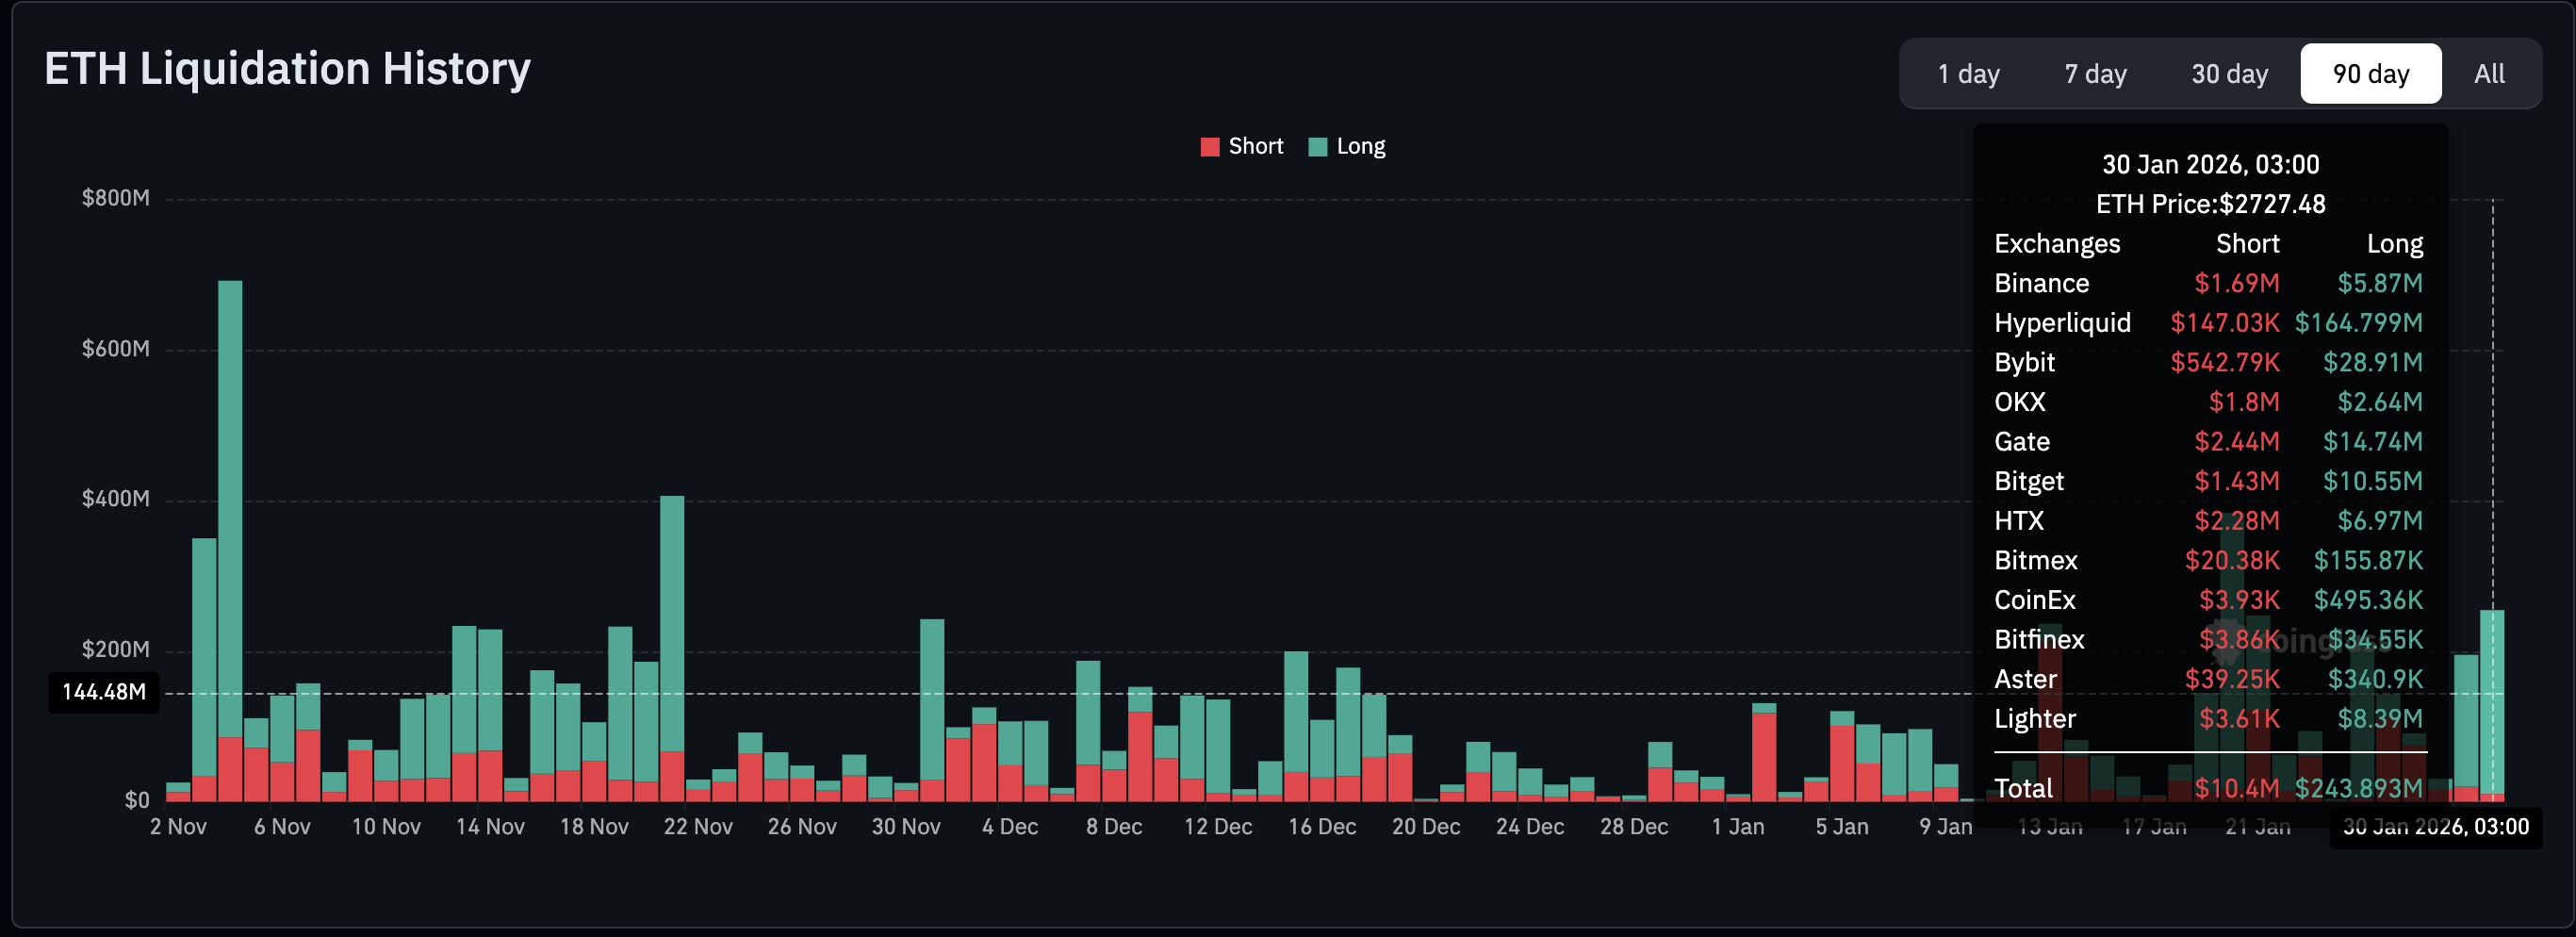
Meanwhile, Ethereum is facing aggressive selling as the price extends the decline below the $3,000 mark and holds above $2,700 at the time of writing on Friday. CoinGlass data shows long liquidations at approximately $244 million on Friday and $175 million on Thursday.
XRP similarly faces ongoing pressure, trading above the April 9 low at $1.72, weighed down by nearly $57 million in long liquidations. If bulls fail to defend the $1.72 support, XRP may extend the decline below the April 7 low at $1.61, potentially liquidating more leverage traders.
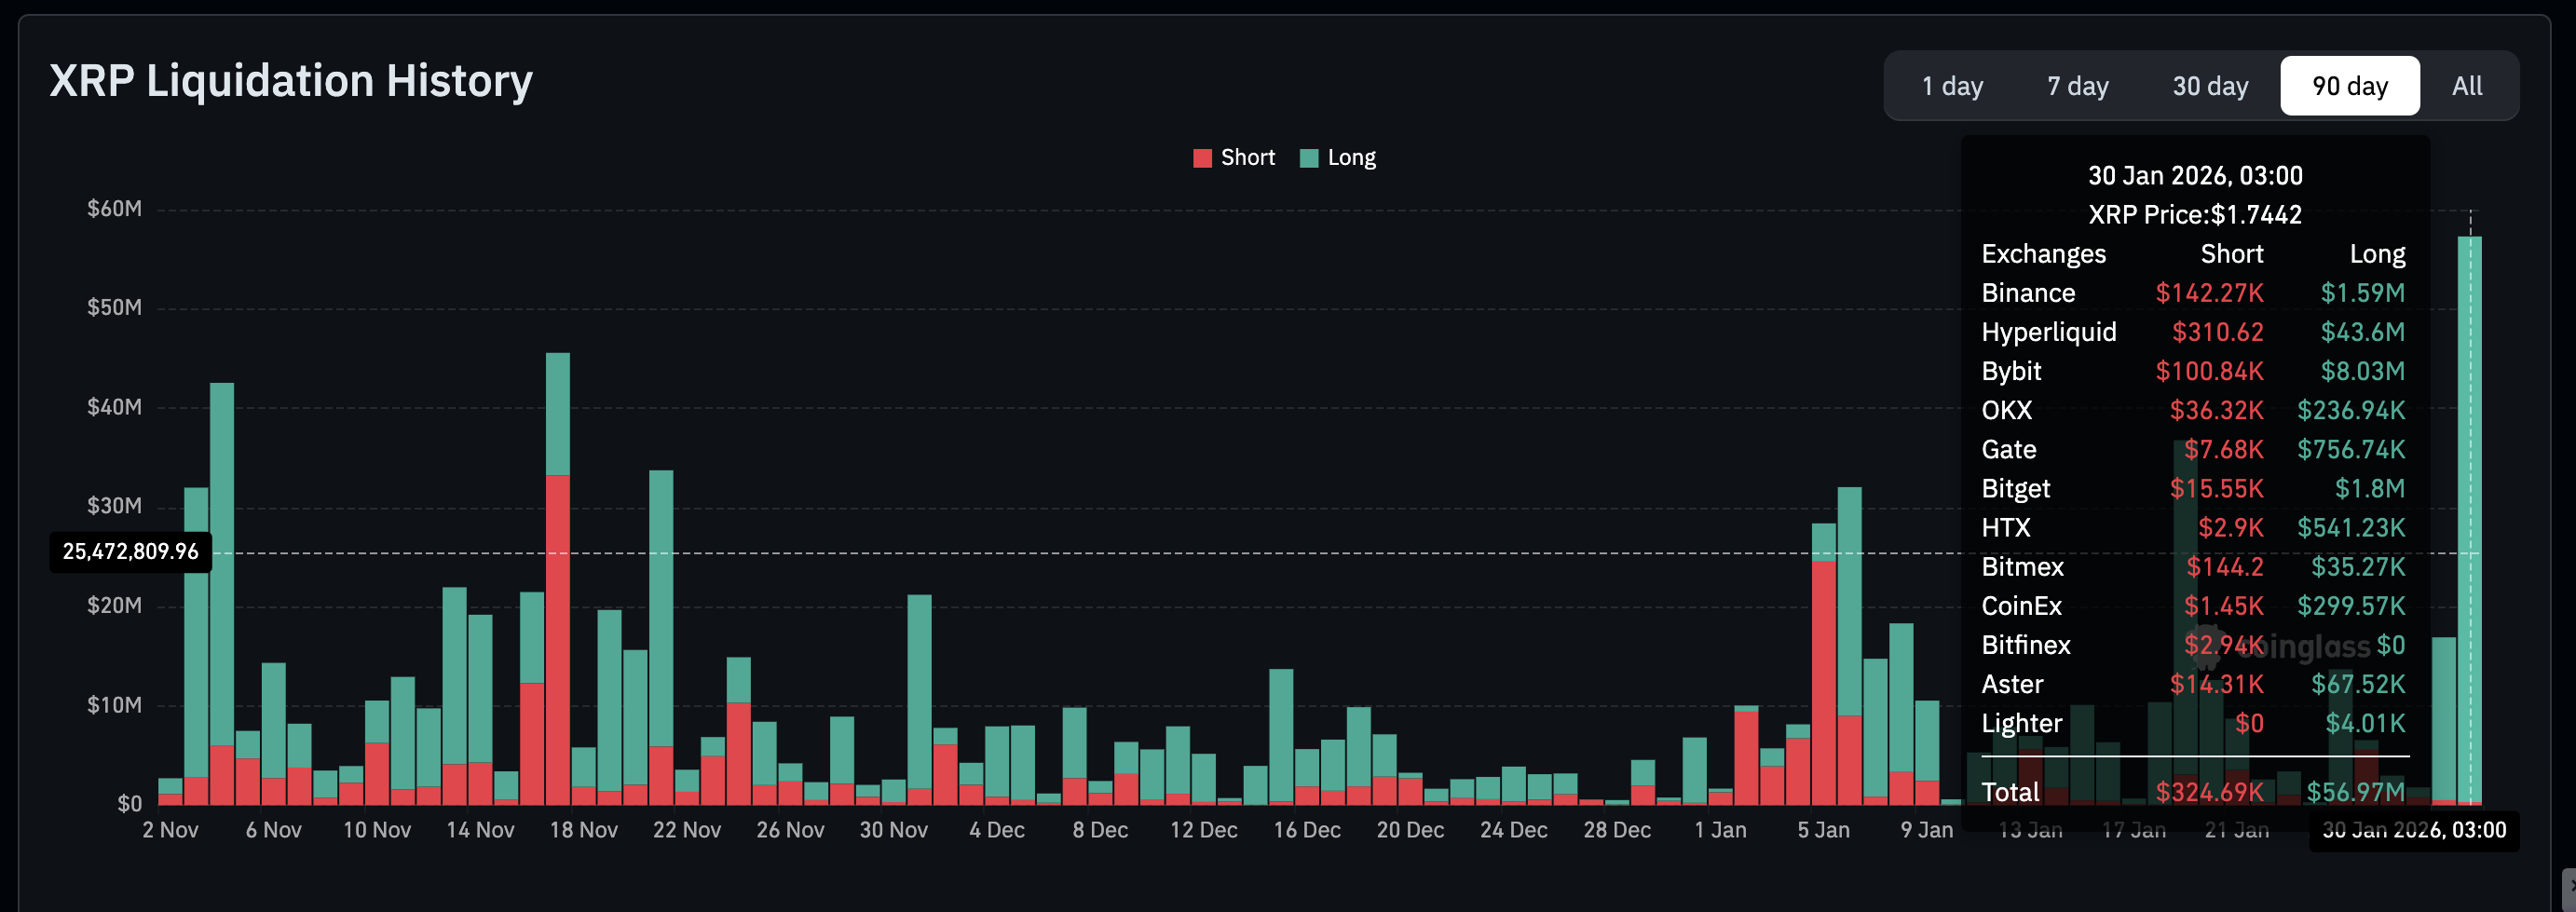
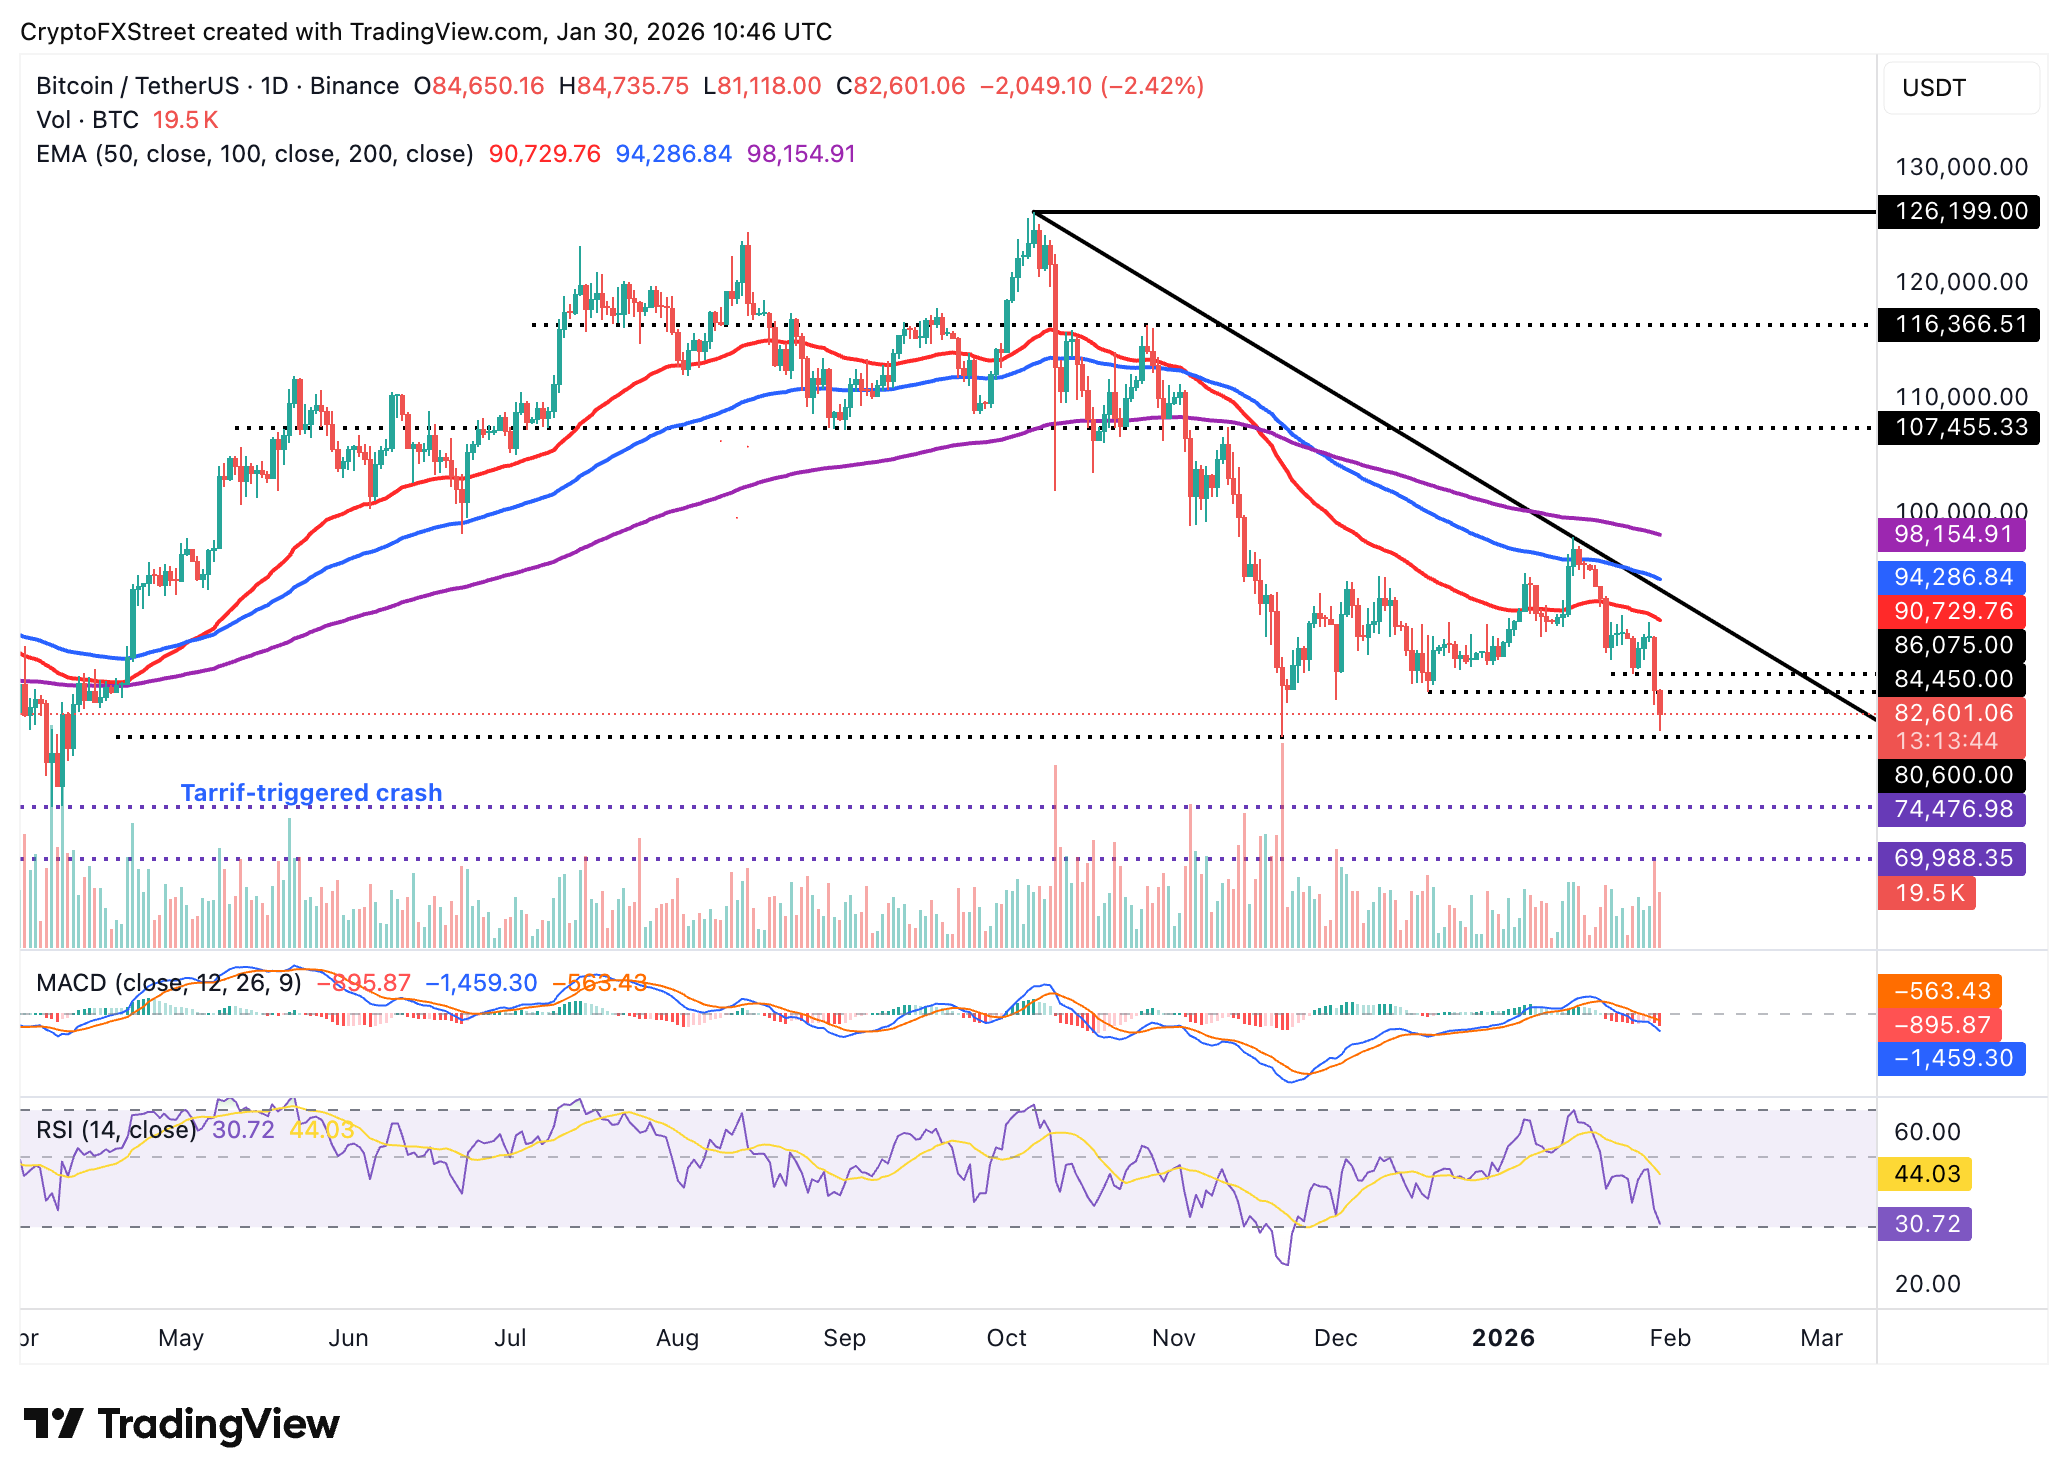
Chart of the day: Bitcoin eyes $80,000 support
Bitcoin is trading downward amid bearish technical signals, reflecting the risk-off mood across the crypto market. The leading cryptocurrency hovers significantly below the 50-day Exponential Moving Average (EMA) at $90,730, the 100-day EMA at $94,287 and the 200-day EMA at $98,155, preserving the bearish momentum.
Selling pressure is unlikely to ease as the Moving Average Convergence Divergence (MACD) remains below its signal line on the daily chart, which would encourage investors to reduce their exposure.
The Relative Strength Index (RSI) at 31 on the daily chart is poised to extend into oversold territory, confirming the bearish thesis. Still, if sentiment improves and bulls buy the dip, a reversal could push Bitcoin above the support-turned resistance at $84,450.
Altcoins technical outlook: Sellers tighten grip as Ethereum and XRP tumble
Ethereum’s short-term outlook remains bearish, trading below the down-trending 50-day EMA at $3,077, the 100-day EMA at $3,215 and the 200-day EMA at $3,293.
The MACD indicator’s position below its signal line on the daily chart shows that bears have the upper hand. Investors may continue to retreat to the sidelines, effectively reducing their risk exposure, as histogram bars expand further below the zero line.
At the same time, the RSI at 35 on the same chart is grinding lower toward oversold territory, underscoring the intense bearish momentum. Ethereum needs to defend the immediate support at $2,700 to prevent extended losses toward its November low of $2,624. Still, sellers could stay in control unless the price rebounds above the pivotal $3,000 level and reclaims the 50-day EMA at $3,077 as support.
XRP, on the other hand, holds above support at $1.72, last tested on April 9 amid the tariff-triggered sell-off. The cross-border token is largely in bearish hands, as the 50-day EMA at $2.00, the 100-day EMA at $2.13 and the 200-day EMA at $2.27 slope downward.
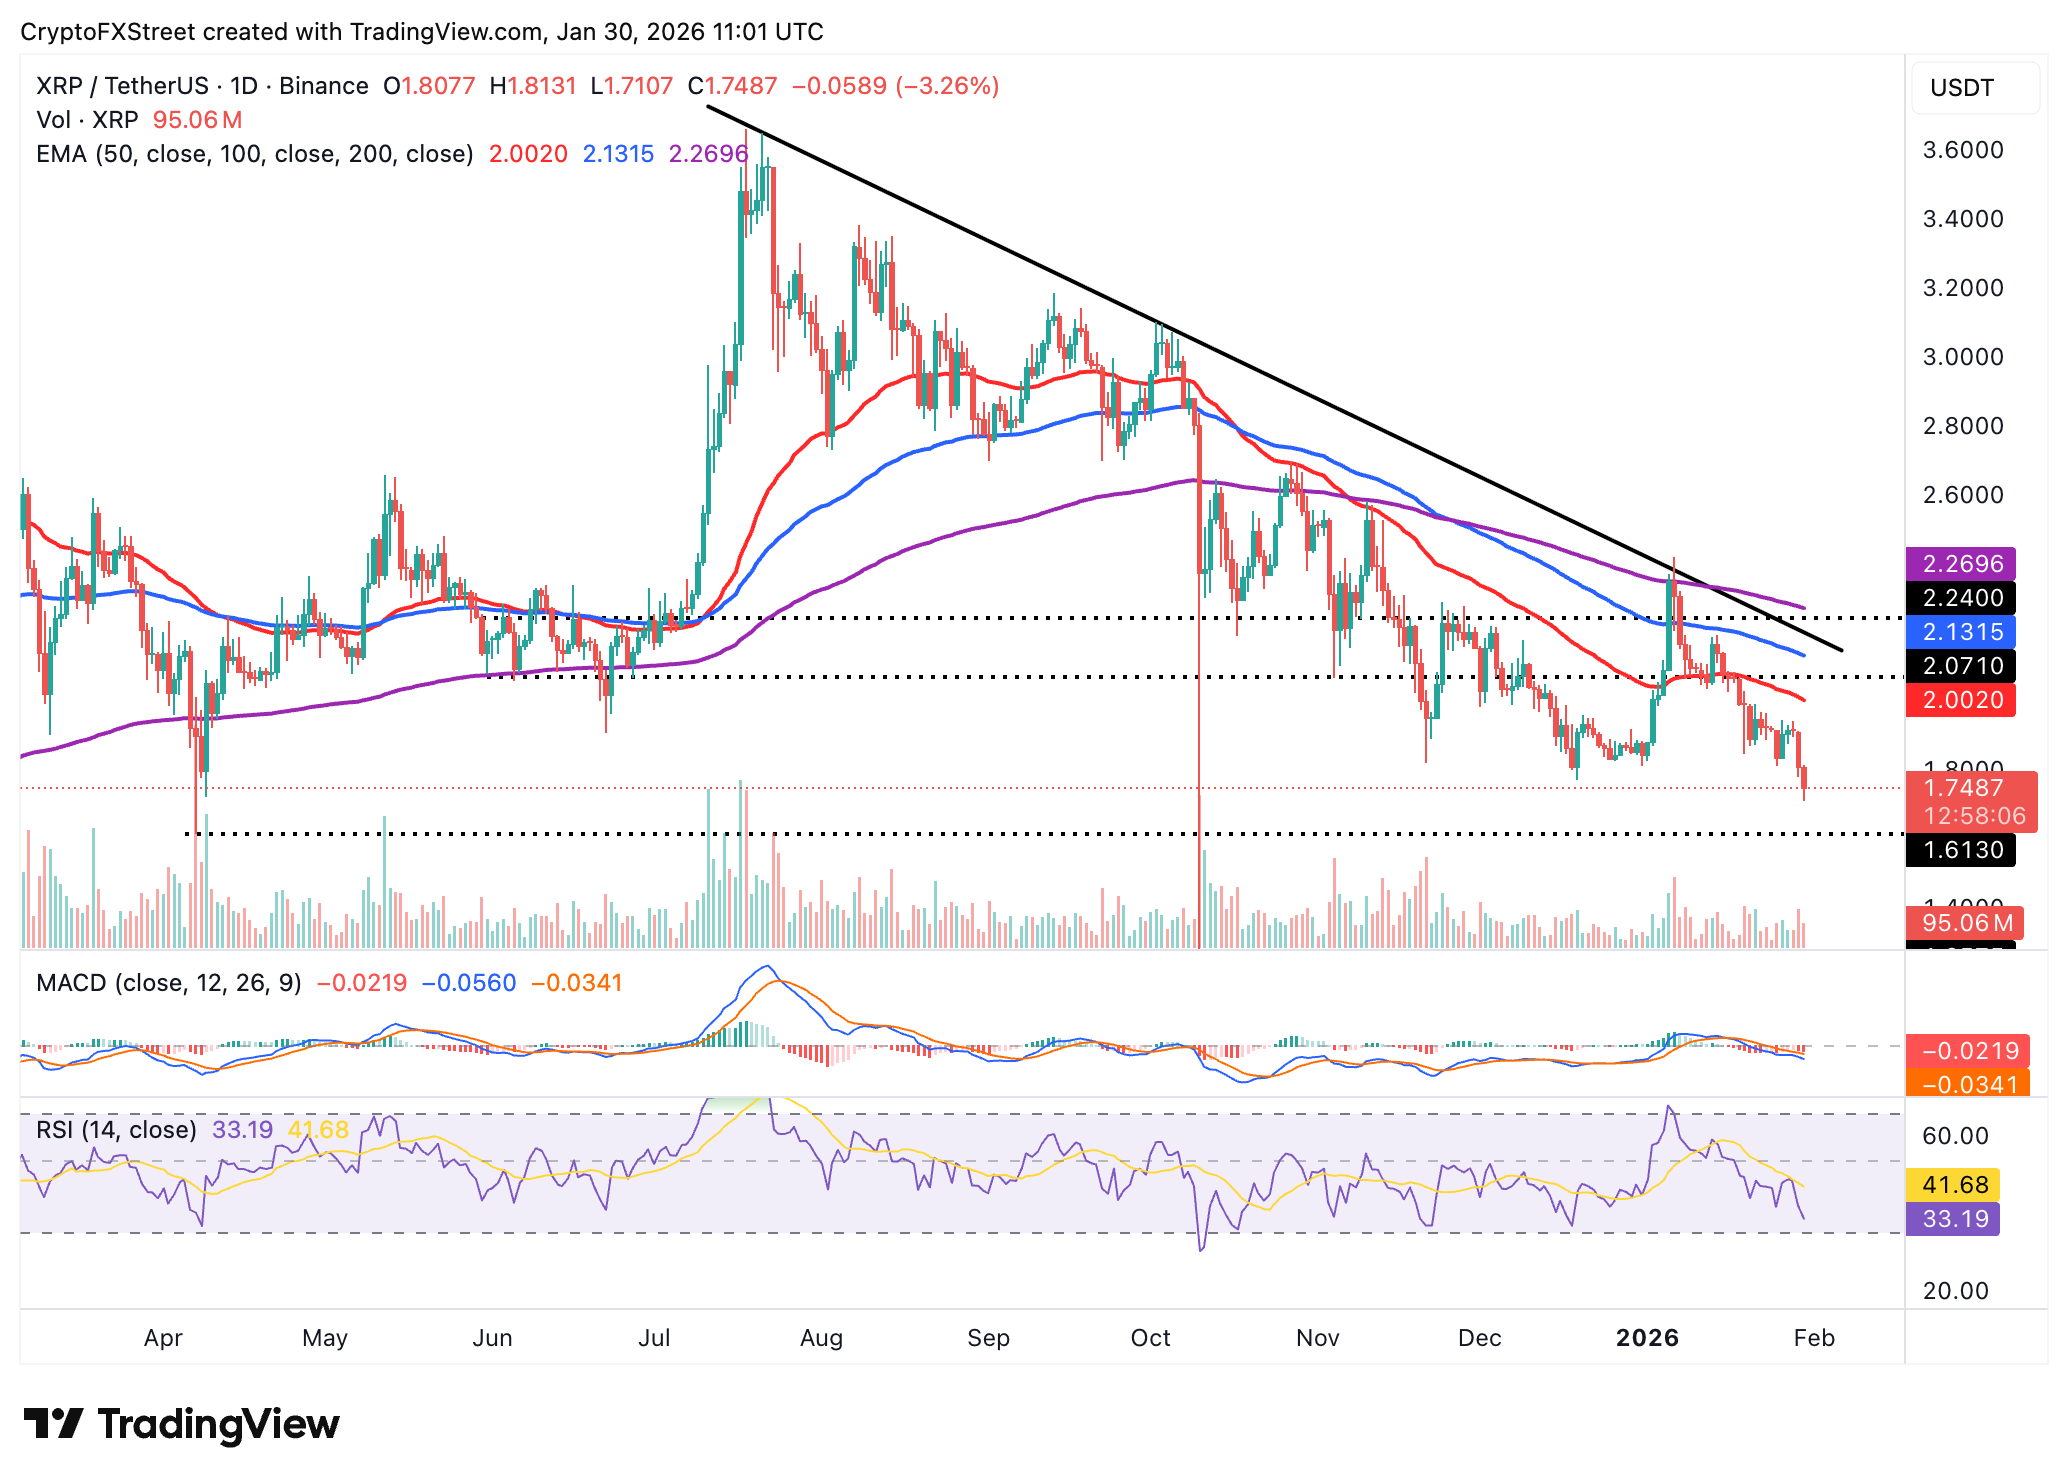
Selling is poised to continue as the RSI at 33 on the daily chart slides into the oversold region. The MACD also underscores bearish momentum, as it remains below its signal line on the daily chart. Beyond the immediate $1.72 support, sellers will target the next demand zone at $1.61.
Open Interest, funding rate FAQs
Higher Open Interest is associated with higher liquidity and new capital inflow to the market. This is considered the equivalent of increase in efficiency and the ongoing trend continues. When Open Interest decreases, it is considered a sign of liquidation in the market, investors are leaving and the overall demand for an asset is on a decline, fueling a bearish sentiment among investors.
Funding fees bridge the difference between spot prices and prices of futures contracts of an asset by increasing liquidation risks faced by traders. A consistently high and positive funding rate implies there is a bullish sentiment among market participants and there is an expectation of a price hike. A consistently negative funding rate for an asset implies a bearish sentiment, indicating that traders expect the cryptocurrency’s price to fall and a bearish trend reversal is likely to occur.

超过一百万用户依赖 FXStreet 获取实时市场数据、图表工具、专家洞见和外汇新闻。其全面的经济日历和教育网络研讨会帮助交易者保持信息领先、做出审慎决策。FXStreet 拥有约 60 人的团队,分布在巴塞罗那总部及全球各地区。
阅读更多


