
Crypto Today: Bitcoin, Ethereum, XRP risk extending pullback amid suppressed market sentiment
作者 John Isige
更新: 7 Apr 2026


热门文章

The cryptocurrency market is sending mixed signals on Tuesday, with some coins like Bitcoin (BTC), Ethereum (ETH), and Ripple (XRP) cooling, while Zcash (ZEC) and SPX6900 (SPX) are breaking out.
- Bitcoin slips below $69,000 after a rejection around $70,000, as weak market sentiment weighs.
- Ethereum’s upside is capped by the 100-day EMA despite the MACD maintaining a buy signal.
- XRP slides for the second consecutive day amid a weakening technical structure, with the RSI falling below 40.
The cryptocurrency market is sending mixed signals on Tuesday, with some coins like Bitcoin (BTC), Ethereum (ETH), and Ripple (XRP) cooling, while Zcash (ZEC) and SPX6900 (SPX) are breaking out.
Sentiment remains weak, weighing on the broader cryptocurrency market, due to the United States (US) and Israel’s war with Iran and the associated macroeconomic uncertainty.
Bitcoin is hovering below $69,000 after a rejection around $70,000 on Monday, while Ethereum holds support at $2,100. Meanwhile, XRP is trading above the $1.30 support level, declining for the second consecutive day.
Market sentiment dampens as US-Iran war rages on
The war in the Middle East continues to pressure global markets as Oil prices remain elevated above $103 for the West Texas Intermediate (WTI). US President Donald Trump has warned of a potential escalation of the war if Iran does not make a deal or open the Strait of Hormuz by this Tuesday, 20:00 PM Eastern Time. The Strait is a critical shipping route as it controls 20% of the world’s Oil and Gas supplies.
Trump said that the US military could strike Iran’s energy infrastructure and bridges if the Strait of Hormuz is not opened before the deadline.
Meanwhile, weak sentiment has remained dominant across the crypto market since the war began in late February. The Fear & Greed Index has steadied at 11 on Monday and Tuesday, indicating extreme fear. According to Alternative data, the index is down from 14 on average last week but slightly up from 10 recorded in March.
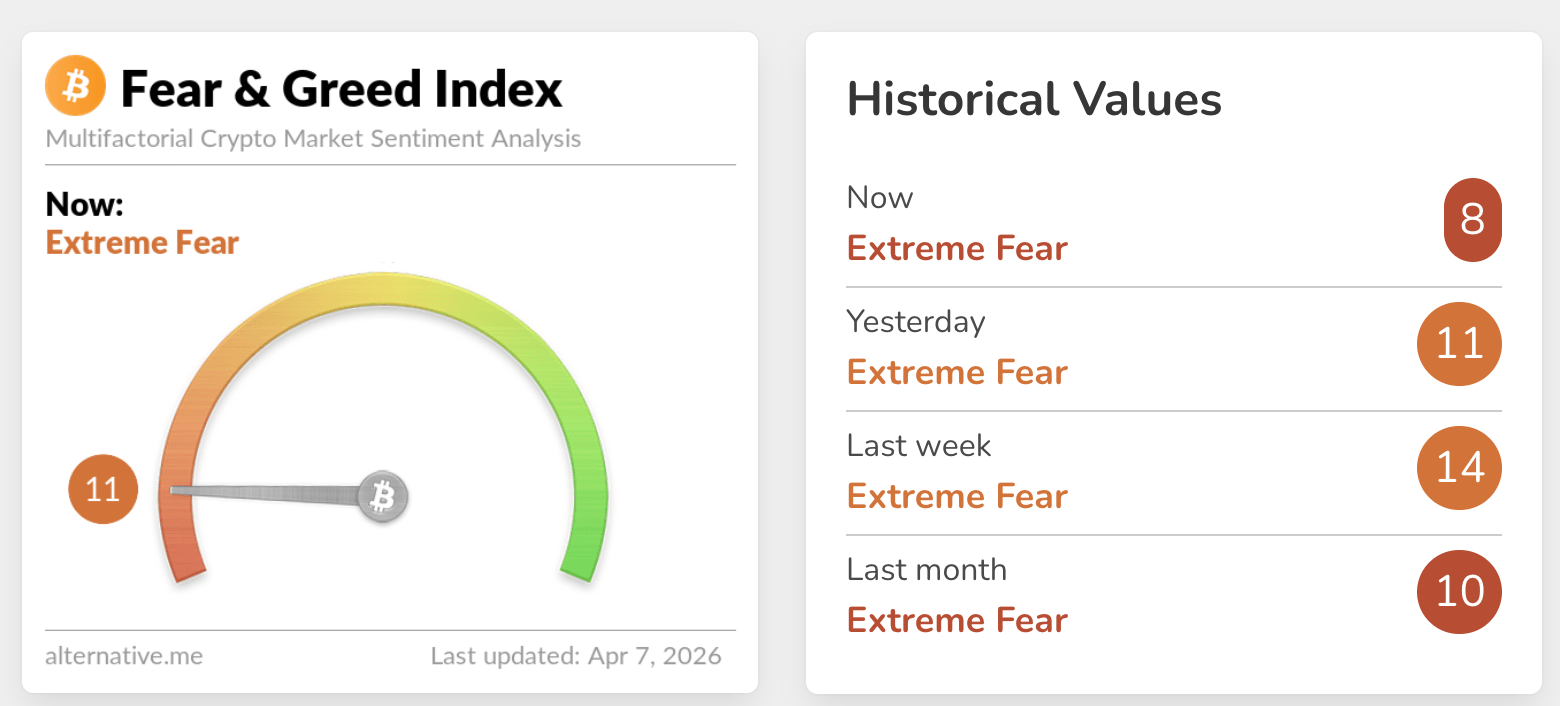
Extreme fear territory suggests that investors remain on edge and unwilling to increase risk exposure, ultimately reducing the buying power required to sustain higher prices.
Chart of the day: Bitcoin upside remains limited under $70,000
Bitcoin (BTC) is trading below $69,000 with support at $68,000 holding. Despite the recent highs above $70,000, the near-term bias is mildly bullish after the coin reclaimed ground above the mid-60,000s. The Moving Average Convergence Divergence (MACD) indicator remains above its signal line on the daily chart, with the histogram improving, suggesting recovering upside momentum.
Meanwhile, the Relative Strength Index (RSI) hovers just below the 50 mark, indicating only modest directional conviction and leaving room for volatility as price stabilizes below recent highs. At the same time, Bitcoin's position below the 50-day, 100-day and 200-day Exponential Moving Averages (EMAs) suggests that sellers have the upper hand.
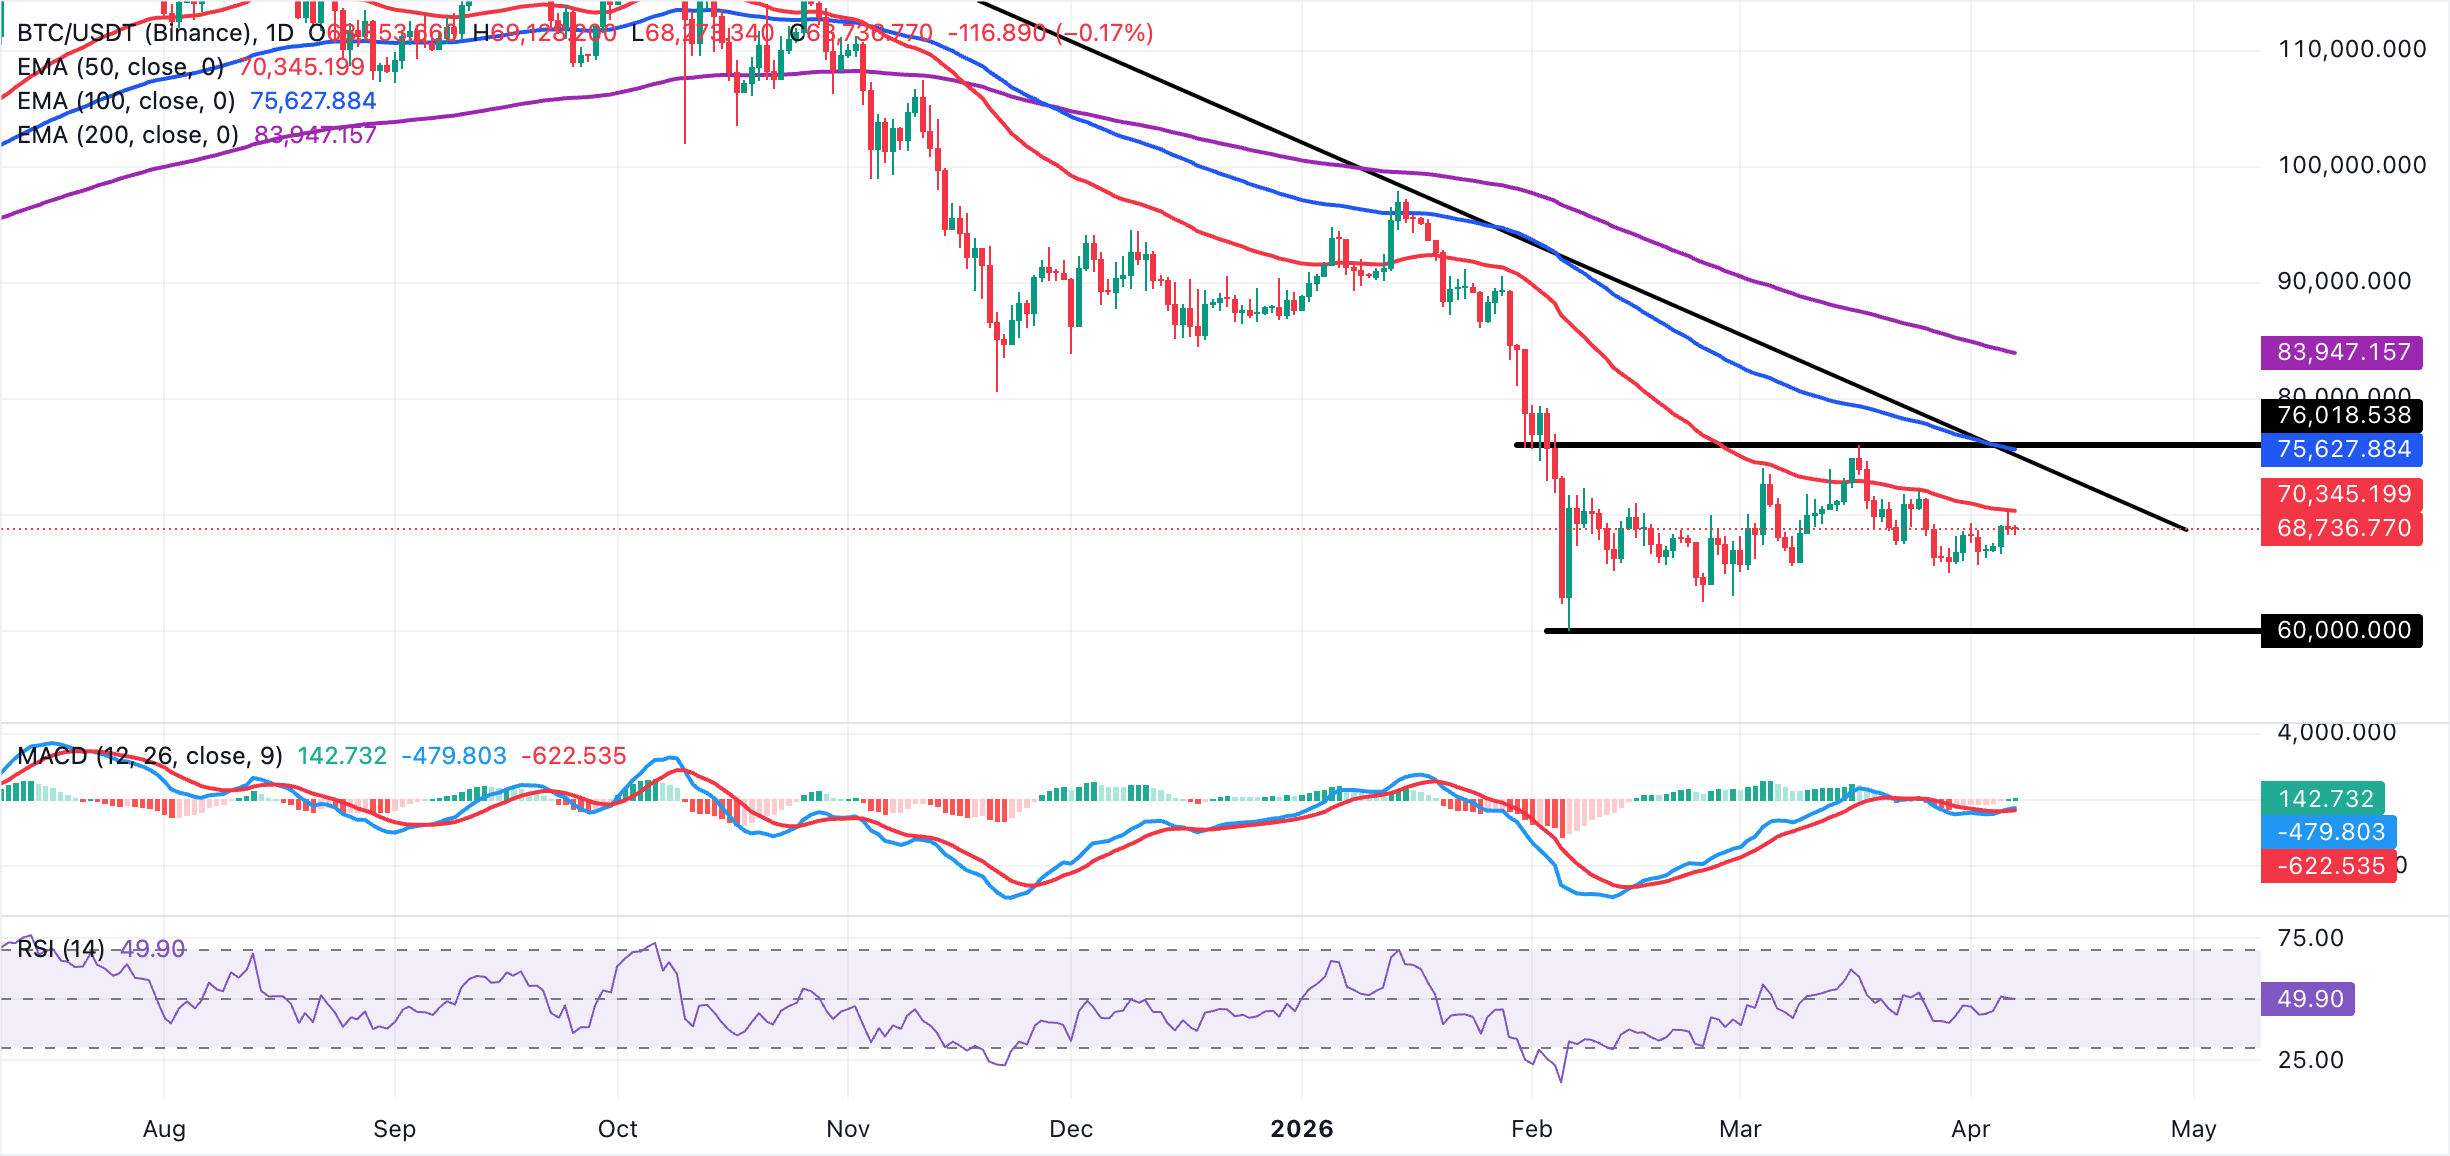
Bitcoin's immediate support emerges near $68,000, aligning with the recent swing low and preceding rebound zone, followed by a deeper floor around $66,000, where prior dips found demand. A break below this latter level would expose the $65,000 region, where buyers would be expected to defend the broader bullish structure.
On the upside, initial resistance stands near $70,000 ahead of the $71,000 area, both levels having capped advances over the past sessions. A daily close above $71,000 would open the way toward the $72,800–$74,900 band, where the descending trendline resistance from the $126,199 area previously rejected rallies and where renewed supply could re-emerge.
Altcoins technical outlook: Ethereum and XRP struggle to break key resistance
Ethereum is trading above the $2,100 support, with its near-term bias remaining neutral and slightly bullish as price holds above the pivotal $2,000 level. A broader outlook of the technical structure points to a bearish scope, as Ethereum's upside is capped by the descending trendline resistance.
The 50-day EMA around $2,144 flattens just above spot and aligns with this indecisive tone, while the 100-day and 200-day EMAs descending at $2,369 and $2,698 reinforce that ETH still trades within a medium-term downtrend. Momentum signals are balanced, with the RSI hovering close to 52 on the daily chart and the MACD line sitting modestly above its signal, suggesting only slight buying pressure after the recent rebound.
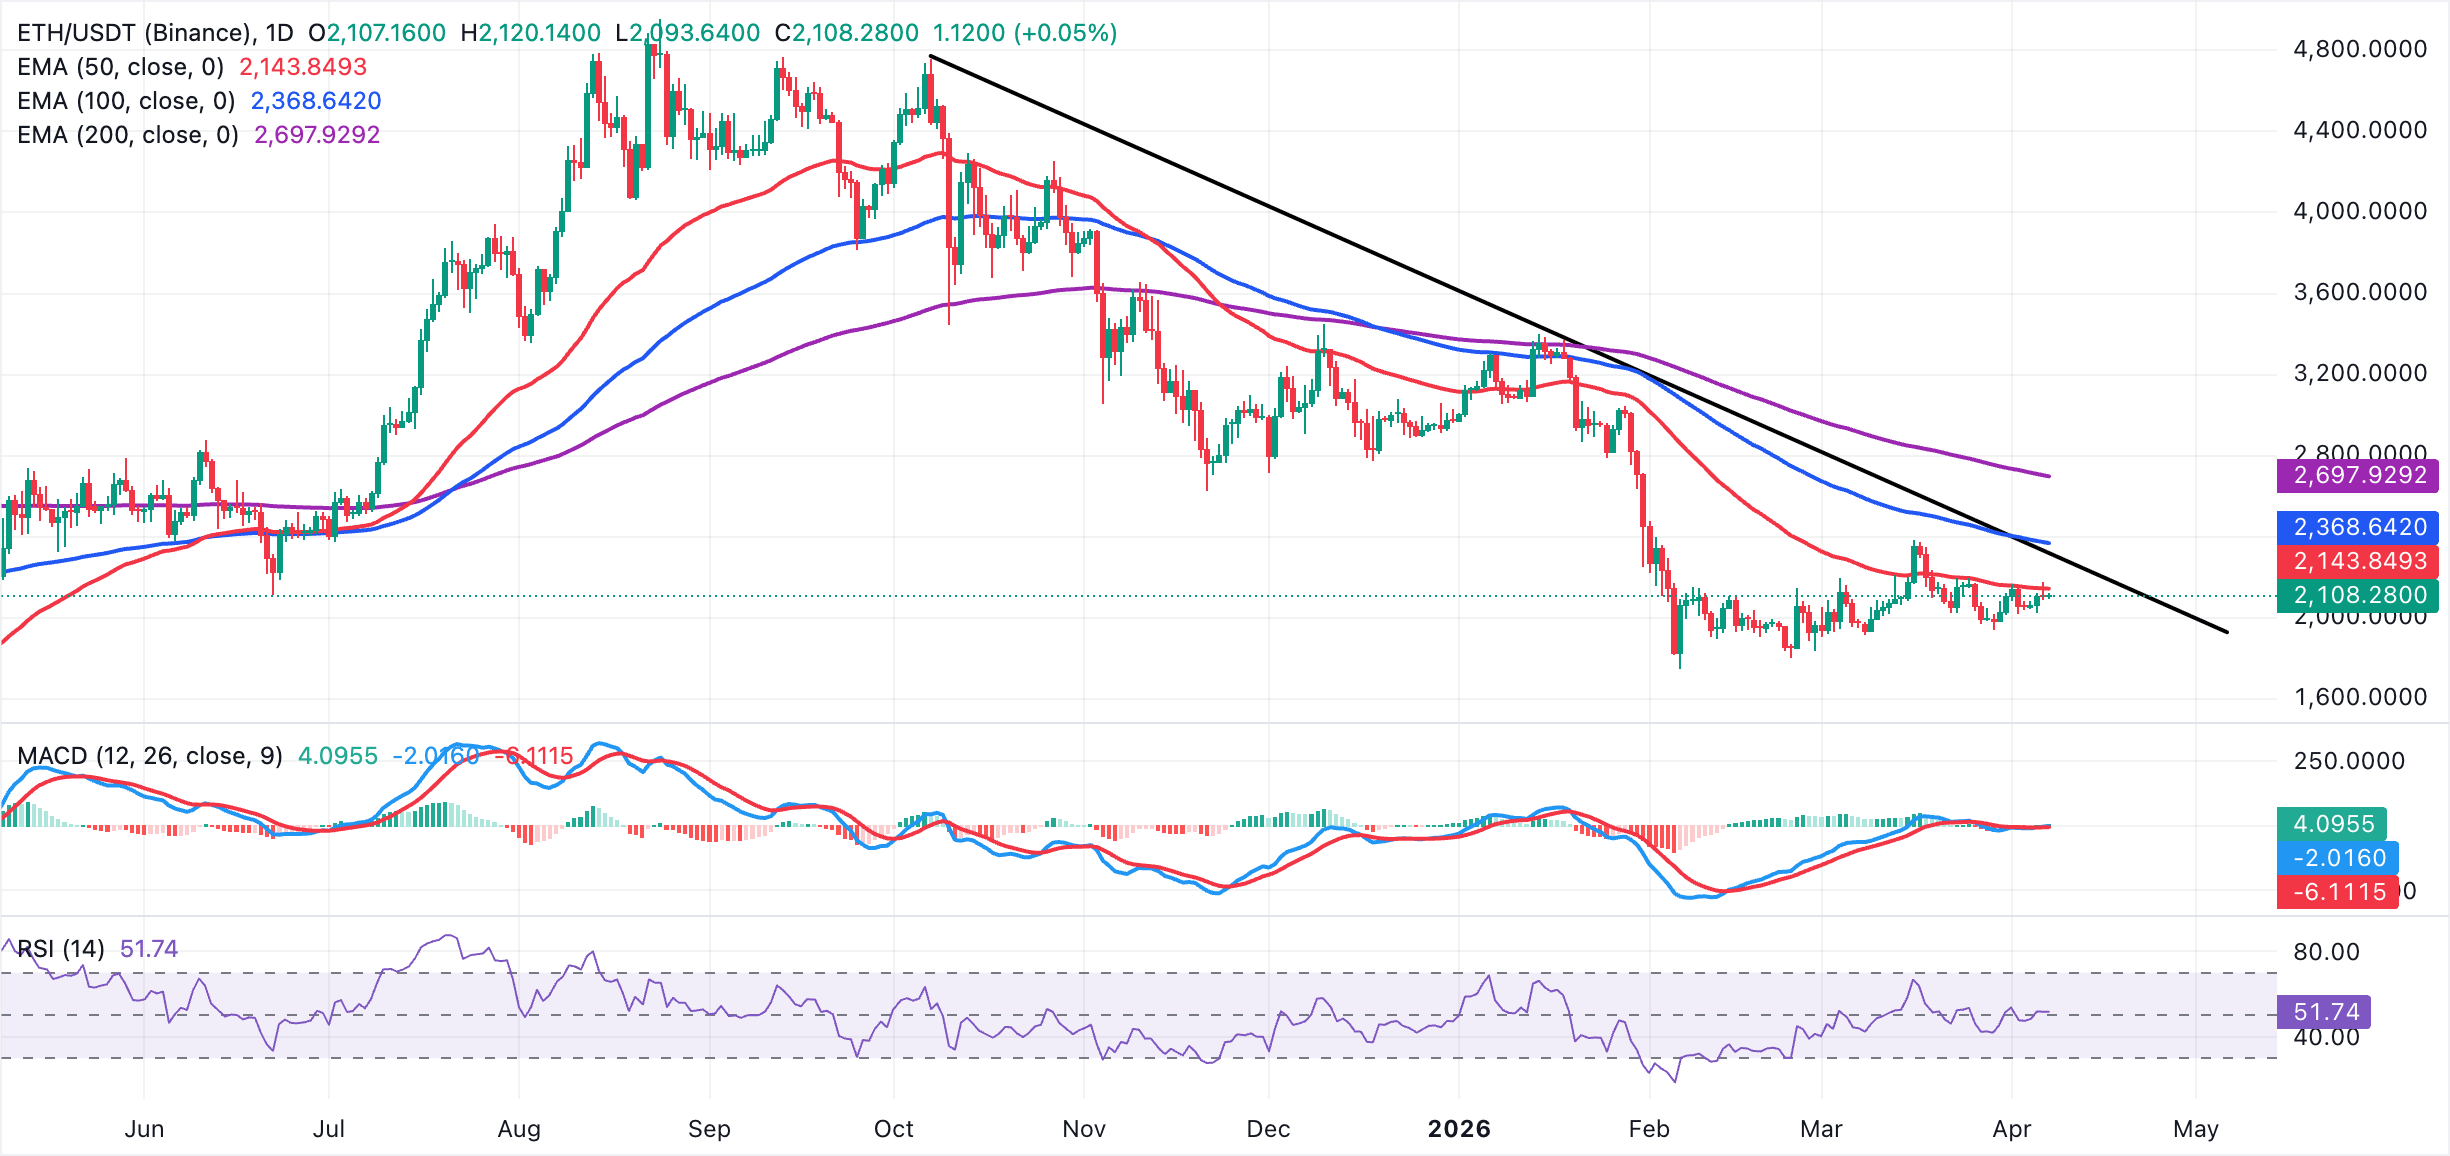
Ethereum's immediate support lies at $2,100, followed by the recent low in the $1,990–$2,000 range, where a break would expose deeper downside toward $1,850. On the topside, initial resistance is seen near the $2,144 region at the 50-day EMA, with a stronger barrier at the prior reaction high at the 100-day EMA around $2,369.
On the other hand, XRP is trading above $1.30, with its near-term bias mildly bearish as price holds below the 50-day, 100-day and 200-day EMAs, which continue to trend lower and cap recovery attempts. Momentum readings back this softer tone, with the MACD indicator below the signal line on the daily chart as the negative histogram shrinks, hinting at weak but persisting downside pressure, while the RSI around 39 stays below the 50 midline, reflecting seller control rather than oversold stress.
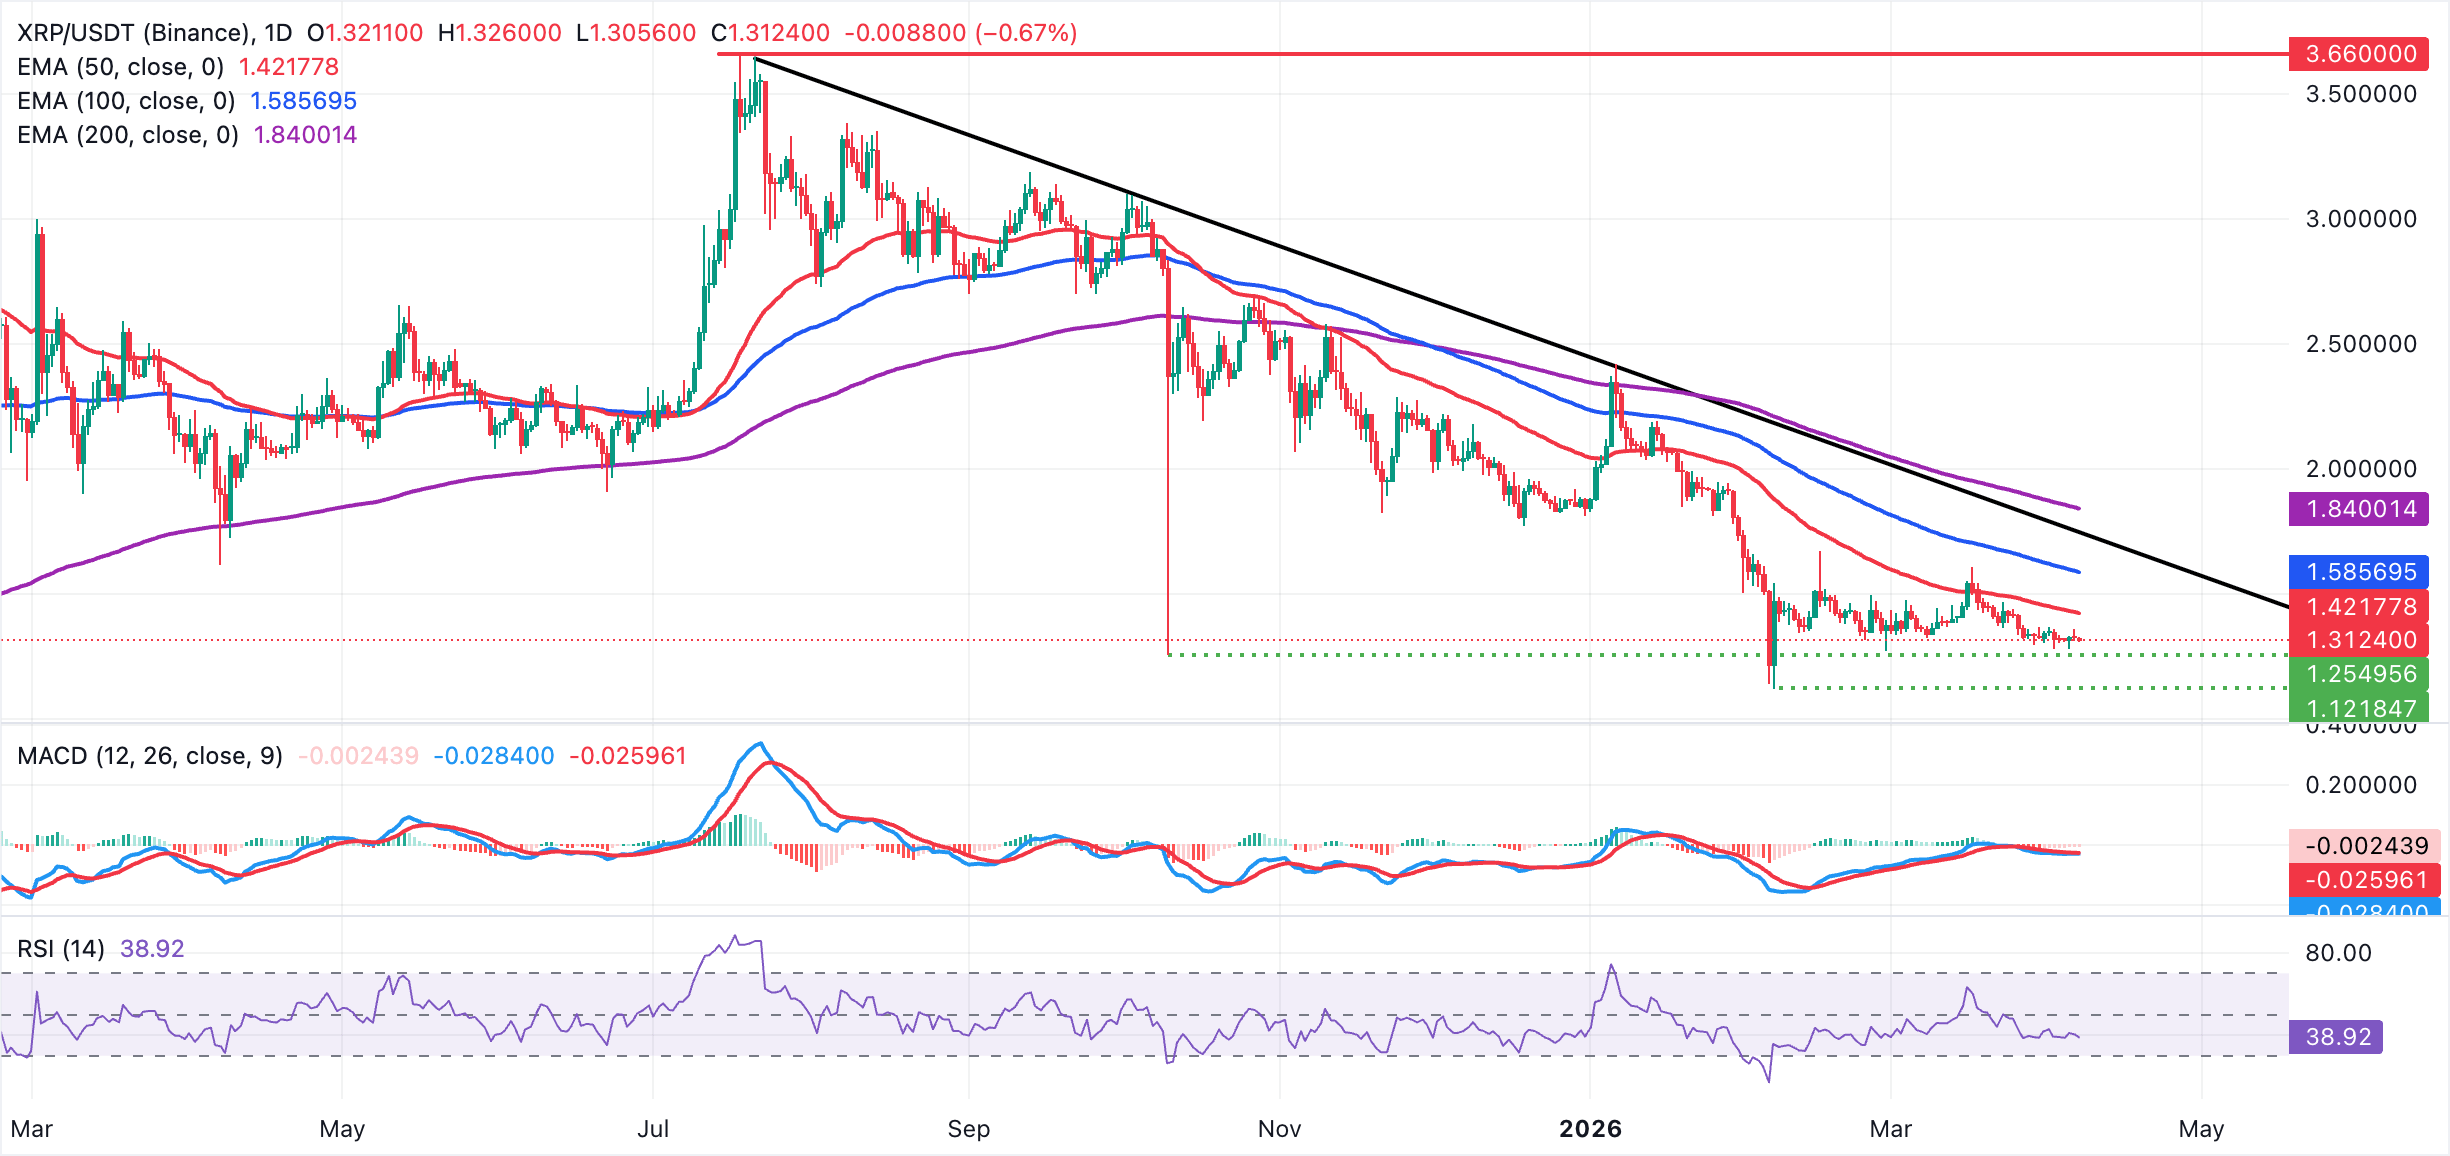
XRP's immediate resistance lies around $1.33, where recent rebound attempts have stalled, followed by $1.35 and the 50-day EMA at $1.42. A break of the latter would open a move toward the $1.45 area and then the $1.52–$1.54 band. On the downside, initial support is seen at the recent floor around $1.30, with a break exposing $1.28 and then $1.25 as deeper retracement levels within the broader downtrend.
Cryptocurrency prices FAQs
Token launches influence demand and adoption among market participants. Listings on crypto exchanges deepen the liquidity for an asset and add new participants to an asset’s network. This is typically bullish for a digital asset.
A hack is an event in which an attacker captures a large volume of the asset from a DeFi bridge or hot wallet of an exchange or any other crypto platform via exploits, bugs or other methods. The exploiter then transfers these tokens out of the exchange platforms to ultimately sell or swap the assets for other cryptocurrencies or stablecoins. Such events often involve an en masse panic triggering a sell-off in the affected assets.
Macroeconomic events like the US Federal Reserve’s decision on interest rates influence crypto assets mainly through the direct impact they have on the US Dollar. An increase in interest rate typically negatively influences Bitcoin and altcoin prices, and vice versa. If the US Dollar index declines, risk assets and associated leverage for trading gets cheaper, in turn driving crypto prices higher.
Halvings are typically considered bullish events as they slash the block reward in half for miners, constricting the supply of the asset. At consistent demand if the supply reduces, the asset’s price climbs.
(The technical analysis of this story was written with the help of an AI tool.)

超过一百万用户依赖 FXStreet 获取实时市场数据、图表工具、专家洞见和外汇新闻。其全面的经济日历和教育网络研讨会帮助交易者保持信息领先、做出审慎决策。FXStreet 拥有约 60 人的团队,分布在巴塞罗那总部及全球各地区。
阅读更多


