
Crypto Today: Bitcoin, Ethereum, XRP trade under pressure as September Fed rate-hike odds increase
作者 John Isige
更新: 24 Jun 2026


热门文章

Bitcoin (BTC) is trading between $62,000 and $63,000 at the time of writing on Wednesday, weighed down by headwinds stemming from macroeconomic uncertainty and geopolitical tensions in the Middle East, especially as the United States (US) and Iran continue to offer conflicting accounts of the nuclea
- Bitcoin consolidates losses above $62,000 amid growing odds of a Fed rate hike in September.
- Ethereum holds above the $1,600 psychological support, but its upside remains capped under major downtrending moving averages.
- XRP slides targeting the next key support range at $1.05-$1.00 as momentum indicators deteriorate further.
Bitcoin (BTC) is trading between $62,000 and $63,000 at the time of writing on Wednesday, weighed down by headwinds stemming from macroeconomic uncertainty and geopolitical tensions in the Middle East, especially as the United States (US) and Iran continue to offer conflicting accounts of the nuclear discussions.
Ethereum (ETH) mirrors Bitcoin’s woes, trading above $1,600 but limited below the critical $1,700 level. At the same time, Ripple (XRP) has broken below $1.10, an area that offered support on Tuesday. The remittance token appears poised to extend the downtrend toward the next support range between $1.05 and $1.00.
September Fed rate-hike odds climb as Bitcoin, Ethereum and XRP wobble
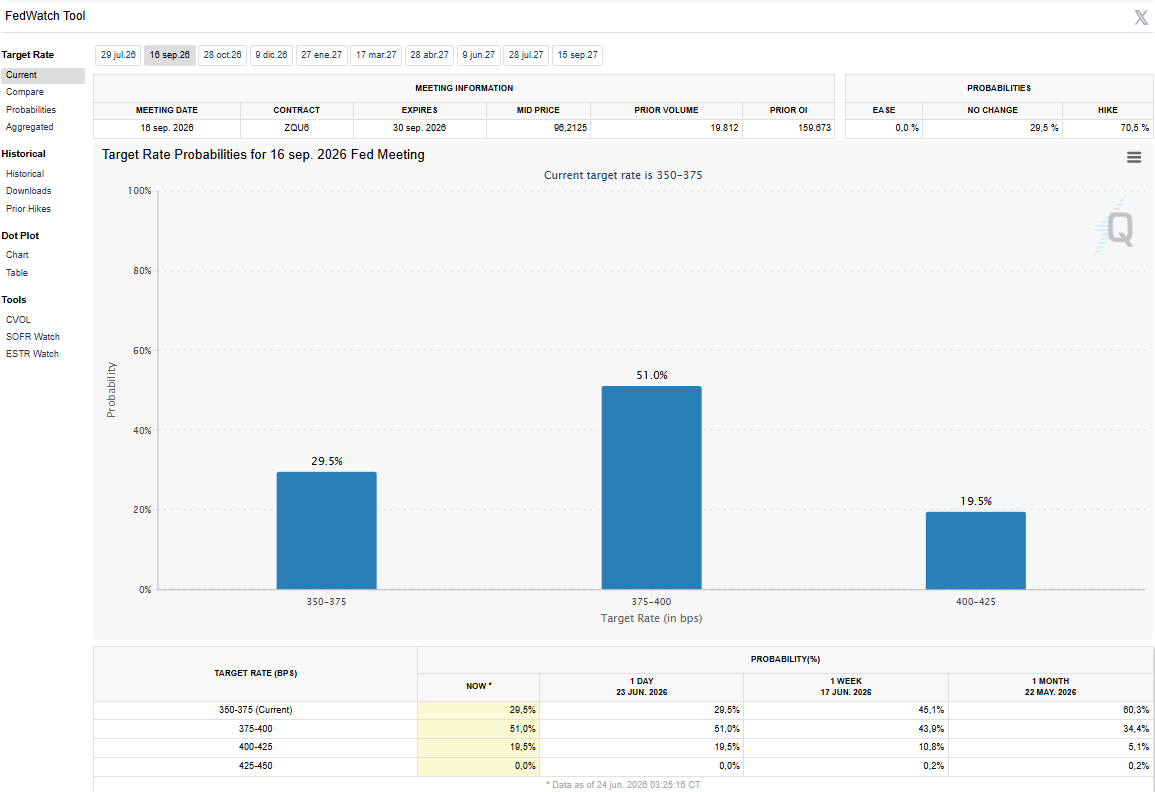
Markets are currently pricing in a higher probability that the Federal Reserve (Fed) will increase interest rates by at least 25 basis points (bps) in September. According to the CME FedWatch tool, odds of interest rates being higher than current levels in September spiked to 70%, compared to 44% one week ago,
The latest Consumer Price Index (CPI) data shows that headline inflation increased to 4.2% YoY in May, up from 3.8% in April. This is the highest inflation reading in over three years.
Fed Chairman Kevin Warsh emphasized during the post-meeting press conference on June 17 that the central bank is keen on achieving its long-term goal of bringing inflation to 2% while ensuring price stability. The hawkish stance increased the probability of a rate hike, which had remained low in the first quarter.
“The setup is still range-bound. US-Iran uncertainty, concerns around Strategy’s STRC offering, and questions over Warsh’s policy approach continue to weigh on sentiment,” analysts at QCP highlighted on Tuesday.
Price analysis: Bitcoin clings to key support
Bitcoin trades at $62,704, keeping a bearish near-term bias as the price holds well below the 50-day, 100-day and 200-day Exponential Moving Averages (EMAs), which cap the upside at $68,596, $71,745 and $77,430 respectively.
The Parabolic SAR at $66,707 also sits overhead, reinforcing the impression of a market contained within a broader downtrend. Momentum is mixed as the Moving Average Convergence Divergence (MACD) indicator remains in positive territory with a modestly expanding histogram on the daily chart, hinting at a nascent recovery.
On the other hand, the Relative Strength Index (RSI) at 37 on the same chart remains below the midline, suggesting only a tentative easing of prior bearish pressure rather than a clear trend reversal.
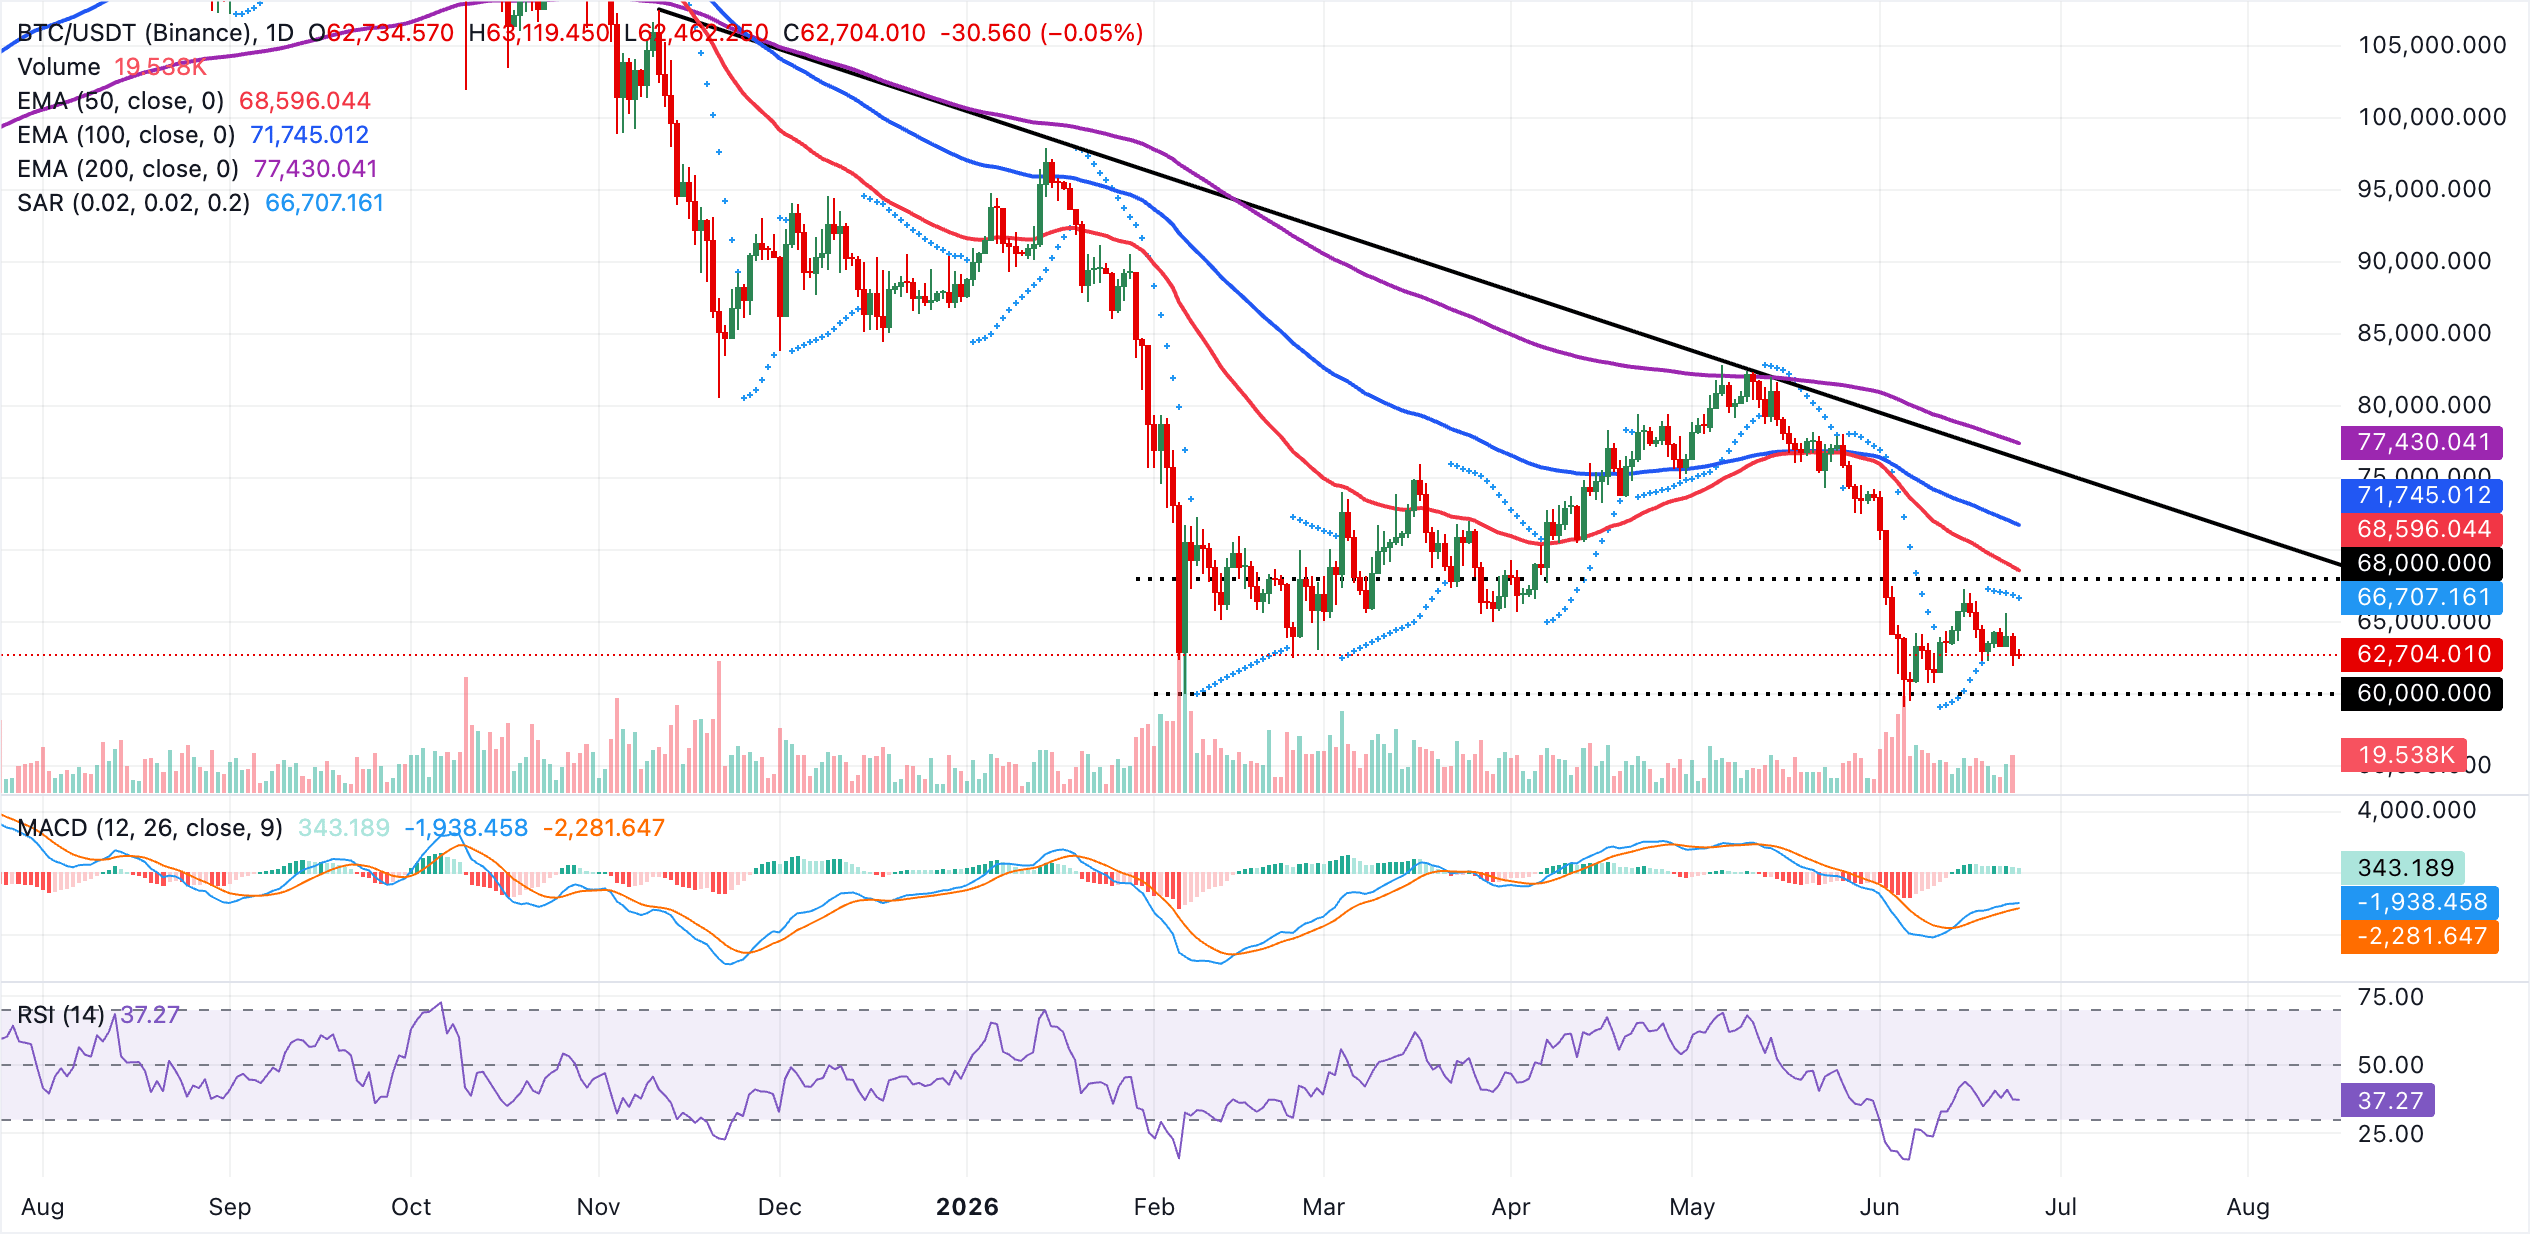
Initial resistance lies at the Parabolic SAR cluster near $66,707, followed by the 50-day EMA at $68,596, which marks the first major dynamic barrier traders will watch on any bounce. Above that, the 100-day EMA at $71,745 aligns with the broader downward resistance trendline whose break level comes in around $76,320, ahead of the more strategic 200-day EMA at $77,430.
On the downside, the lack of nearby defined technical support in the provided dataset leaves the recent lows and psychological round numbers at $62,000 and $60,000 as the primary reference points if declines continue.
Altcoins technical outlook: Ethereum and XRP falter as upside remains capped
Ethereum trades at $1,670, extending a bearish stance as it holds well below the 50-day, 100-day and 200-day EMAs at $1,893, $2,057 and $2,333, respectively.
The Parabolic SAR at $1,845 and the downward resistance trendline projecting from higher highs and intersecting near $2,006 reinforce a heavy overhead supply zone, while momentum remains subdued with the RSI hovering around 37 and the MACD histogram turning positive but still only hinting at tentative stabilization rather than a clear reversal.
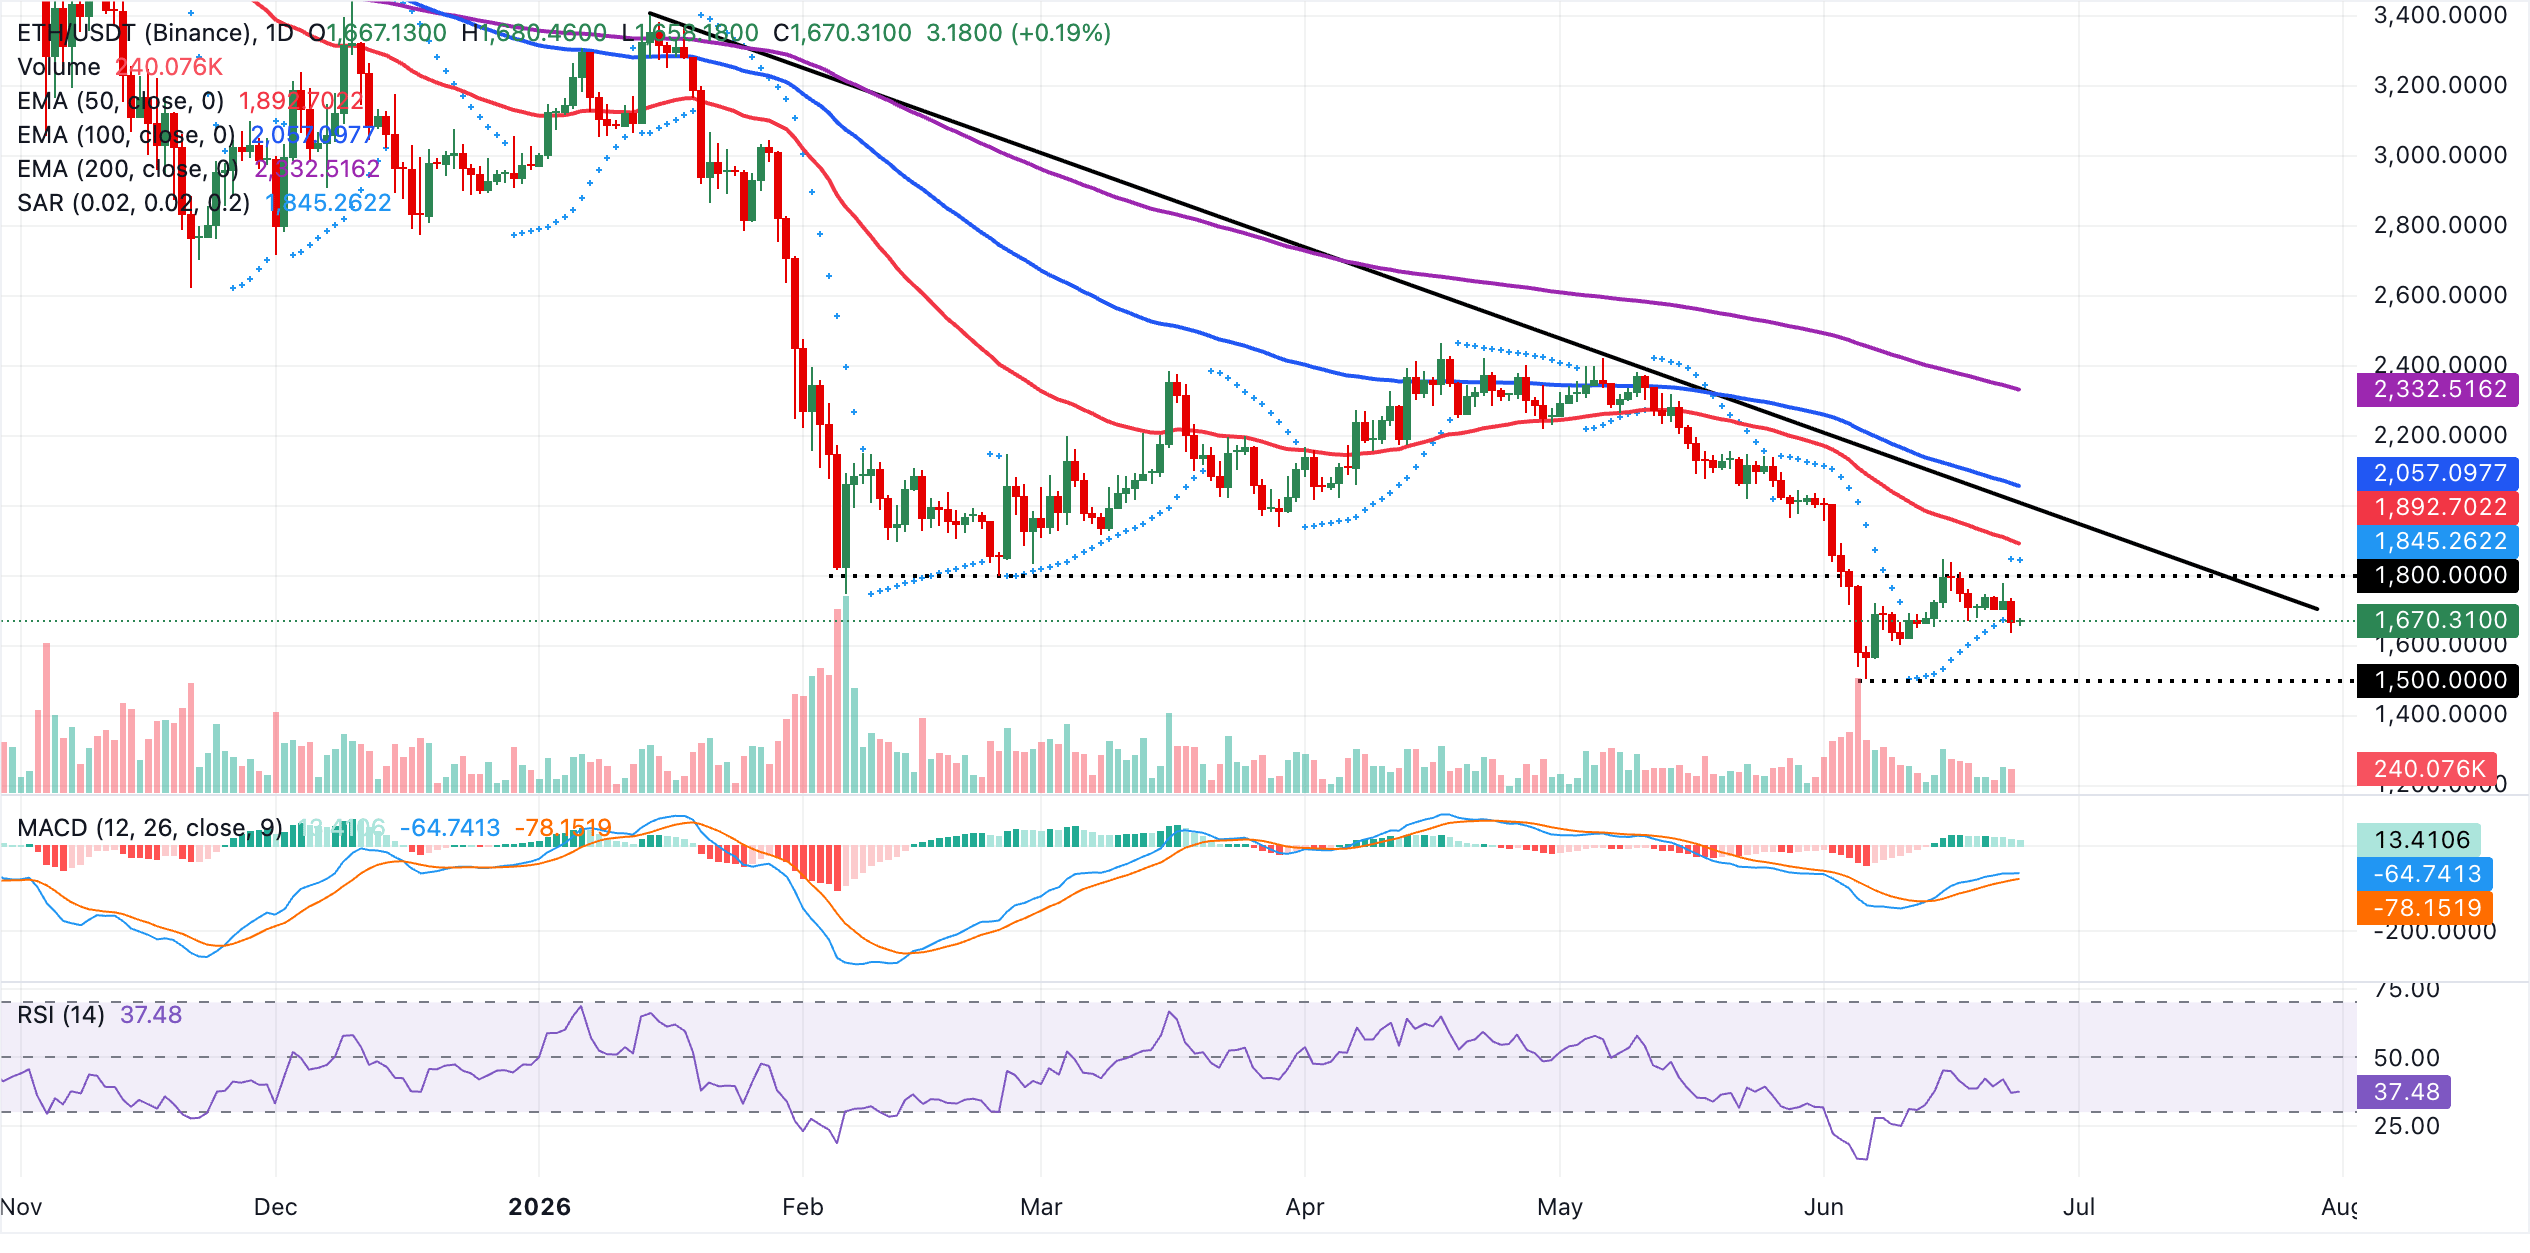
Immediate resistance lies at the Parabolic SAR level around $1,845, followed by the 50-day EMA near $1,893. A break above these would be needed to challenge the descending trendline barrier at roughly $2,006 and then the 100-day EMA at $2,057, with the 200-day EMA up at $2,333 acting as a broader bearish pivot.
Looking down, Ethereum holds above the psychological round number support at $1,600, followed by recent lows at $1,500 if sellers tighten their grip. Buyers will have an opportunity to reengage at these key levels while aiming for a sharp rebound toward the supply around $1,800.
XRP, on the other hand, trades at $1.09, retaining a bearish near-term tone as the price remains capped beneath the Bollinger Bands middle line at $1.15 and well below the 50-day, 100-day and 200-day EMAs at $1.24, $1.34 and $1.55 respectively.
The MACD indicator shows the histogram in positive territory on the daily chart, hinting at tentative recovery attempts, but the RSI near 36 suggests only modest improvement from oversold conditions while the broader structure still favors sellers.
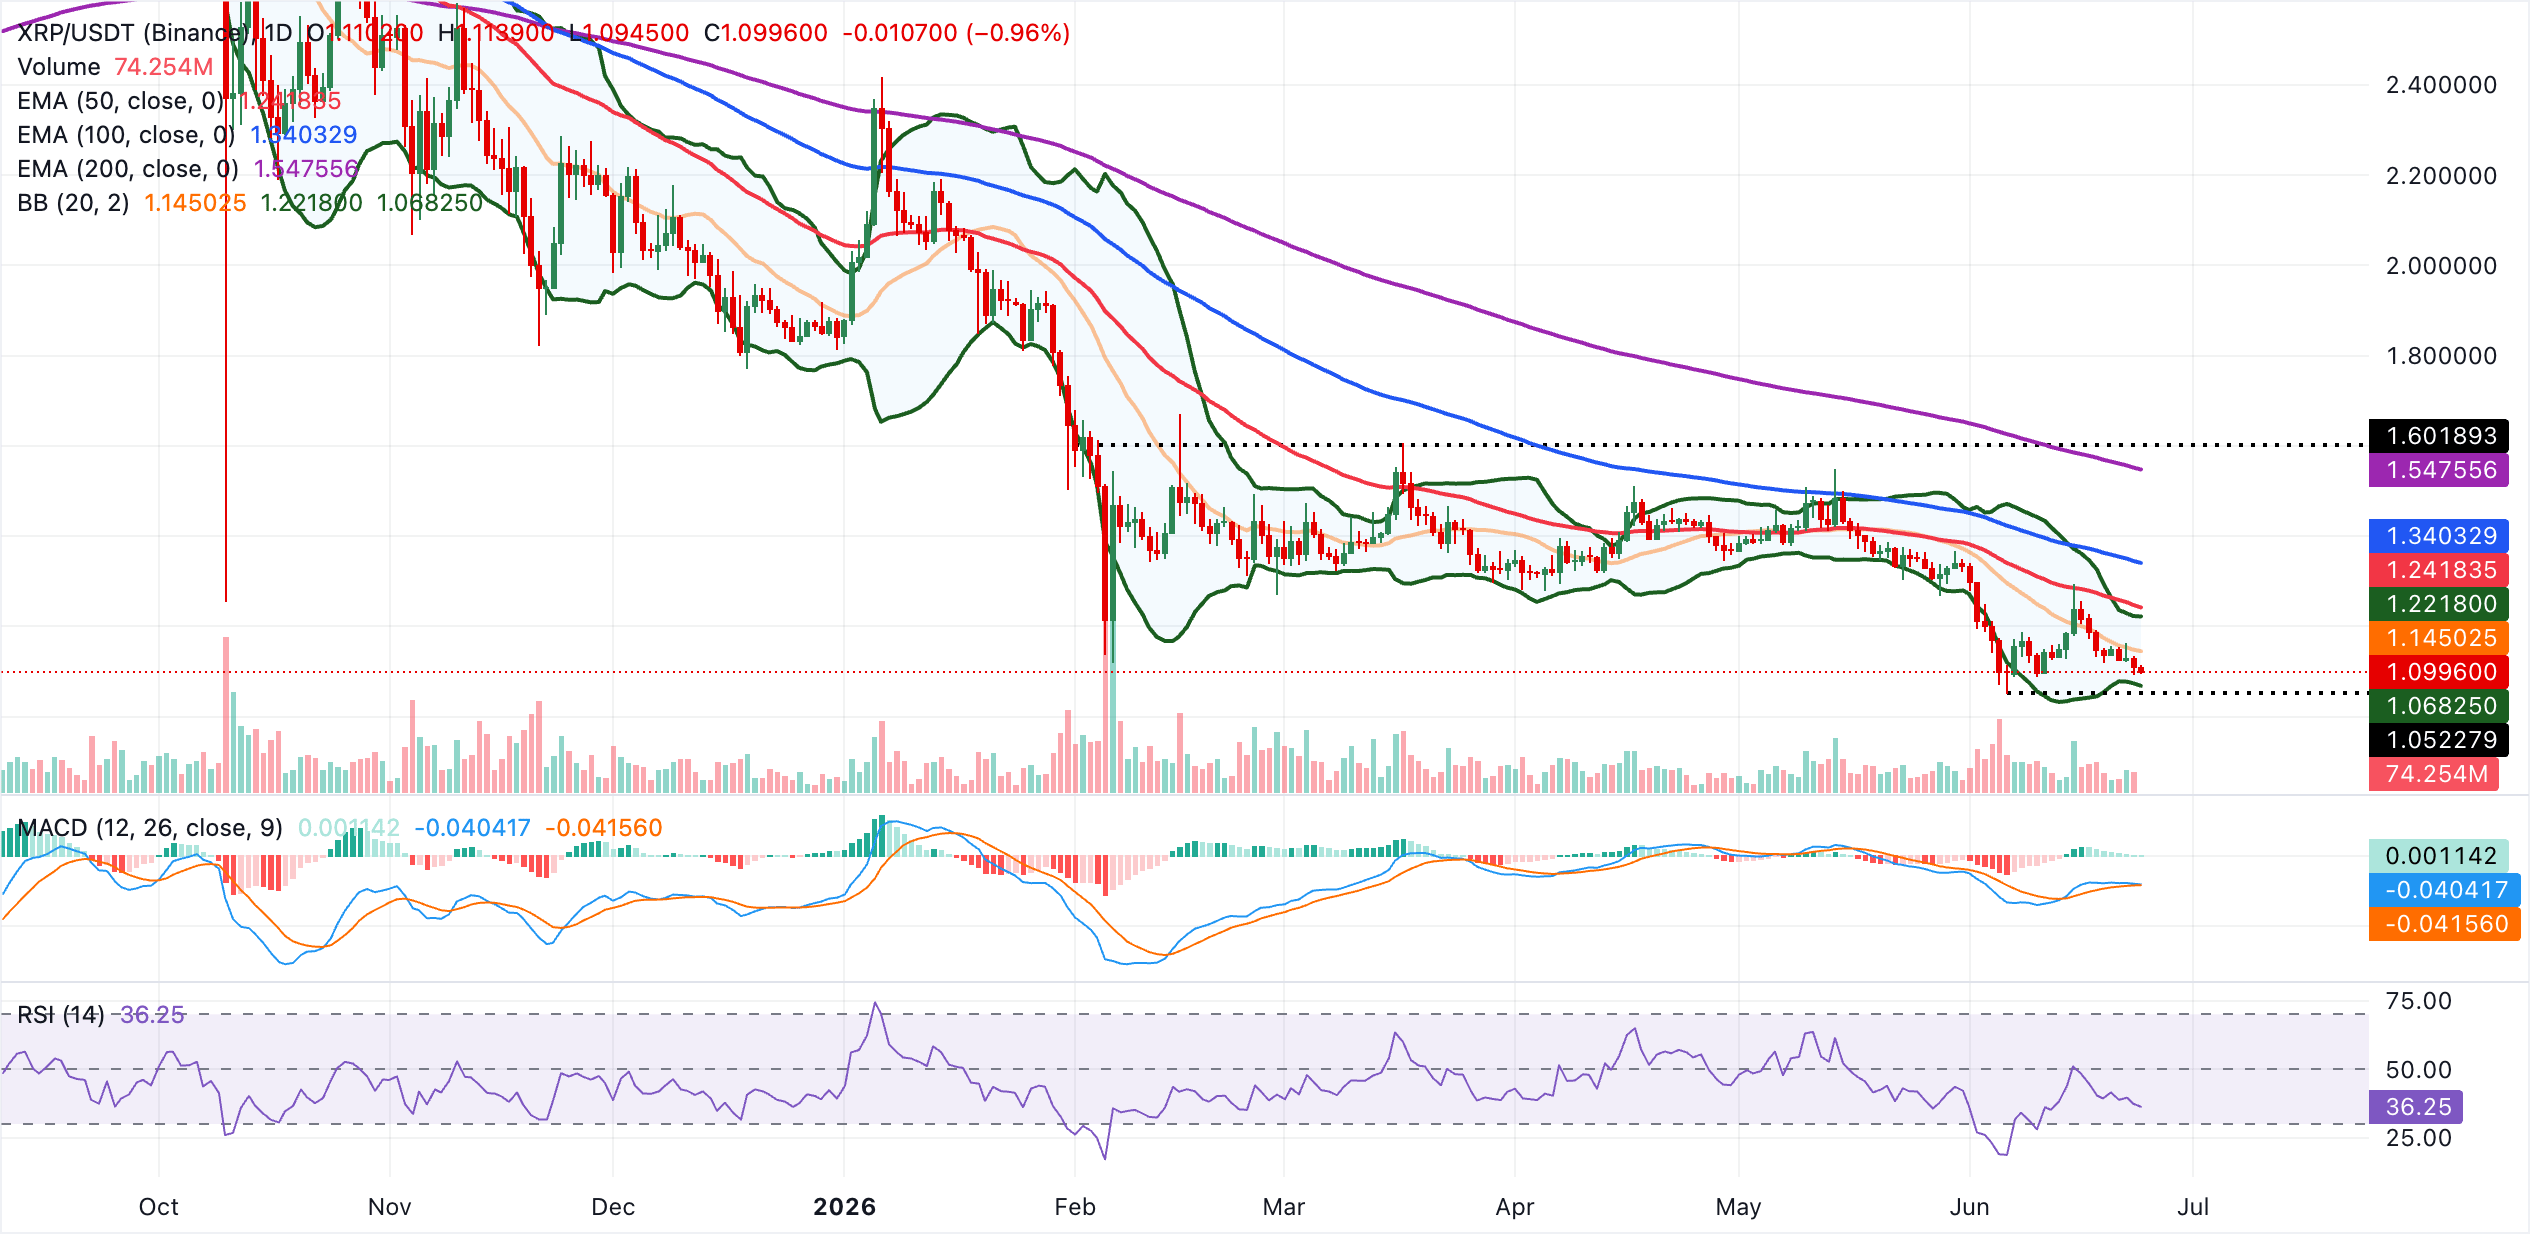
On the topside, initial resistance is seen at the Bollinger middle band at $1.15, followed by the upper Bollinger Band at $1.22, before the more significant EMA barriers at $1.24, $1.34 and $1.55, which collectively reinforce the prevailing downside bias as long as price trades beneath them.
That said, immediate support is provided by the lower Bollinger Band near $1.07. A decisive break below this floor would open the door to an extension of the current bearish phase, while holding above it could allow for a corrective bounce toward the nearby resistance cluster.
(The technical analysis of this story was written with the help of an AI tool.)
Bitcoin, altcoins, stablecoins FAQs
Bitcoin is the largest cryptocurrency by market capitalization, a virtual currency designed to serve as money. This form of payment cannot be controlled by any one person, group, or entity, which eliminates the need for third-party participation during financial transactions.
Altcoins are any cryptocurrency apart from Bitcoin, but some also regard Ethereum as a non-altcoin because it is from these two cryptocurrencies that forking happens. If this is true, then Litecoin is the first altcoin, forked from the Bitcoin protocol and, therefore, an “improved” version of it.
Stablecoins are cryptocurrencies designed to have a stable price, with their value backed by a reserve of the asset it represents. To achieve this, the value of any one stablecoin is pegged to a commodity or financial instrument, such as the US Dollar (USD), with its supply regulated by an algorithm or demand. The main goal of stablecoins is to provide an on/off-ramp for investors willing to trade and invest in cryptocurrencies. Stablecoins also allow investors to store value since cryptocurrencies, in general, are subject to volatility.
Bitcoin dominance is the ratio of Bitcoin's market capitalization to the total market capitalization of all cryptocurrencies combined. It provides a clear picture of Bitcoin’s interest among investors. A high BTC dominance typically happens before and during a bull run, in which investors resort to investing in relatively stable and high market capitalization cryptocurrency like Bitcoin. A drop in BTC dominance usually means that investors are moving their capital and/or profits to altcoins in a quest for higher returns, which usually triggers an explosion of altcoin rallies.

超过一百万用户依赖 FXStreet 获取实时市场数据、图表工具、专家洞见和外汇新闻。其全面的经济日历和教育网络研讨会帮助交易者保持信息领先、做出审慎决策。FXStreet 拥有约 60 人的团队,分布在巴塞罗那总部及全球各地区。
阅读更多


