
Dogecoin Price Forecast: DOGE falls despite retail strength, pressuring the $0.10 threshold
- Dogecoin edges lower on Monday, erasing the 3% gains from Sunday.
- Derivatives data shows an increase in retail buying activity despite intense liquidations.
- The technical outlook for DOGE remains mixed, with prices holding above the 100-day EMA at $0.1055.
Dogecoin (DOGE) is trading in the red on Monday, erasing the 3% gains made on the previous day. Retail strength in the meme coin holds strong despite heavy long liquidations over the last 24 hours, anticipating a rebound. The technical outlook is mixed as DOGE remains trapped below a declining resistance trendline and the 100-day Exponential Moving Average (EMA) at $0.1055.

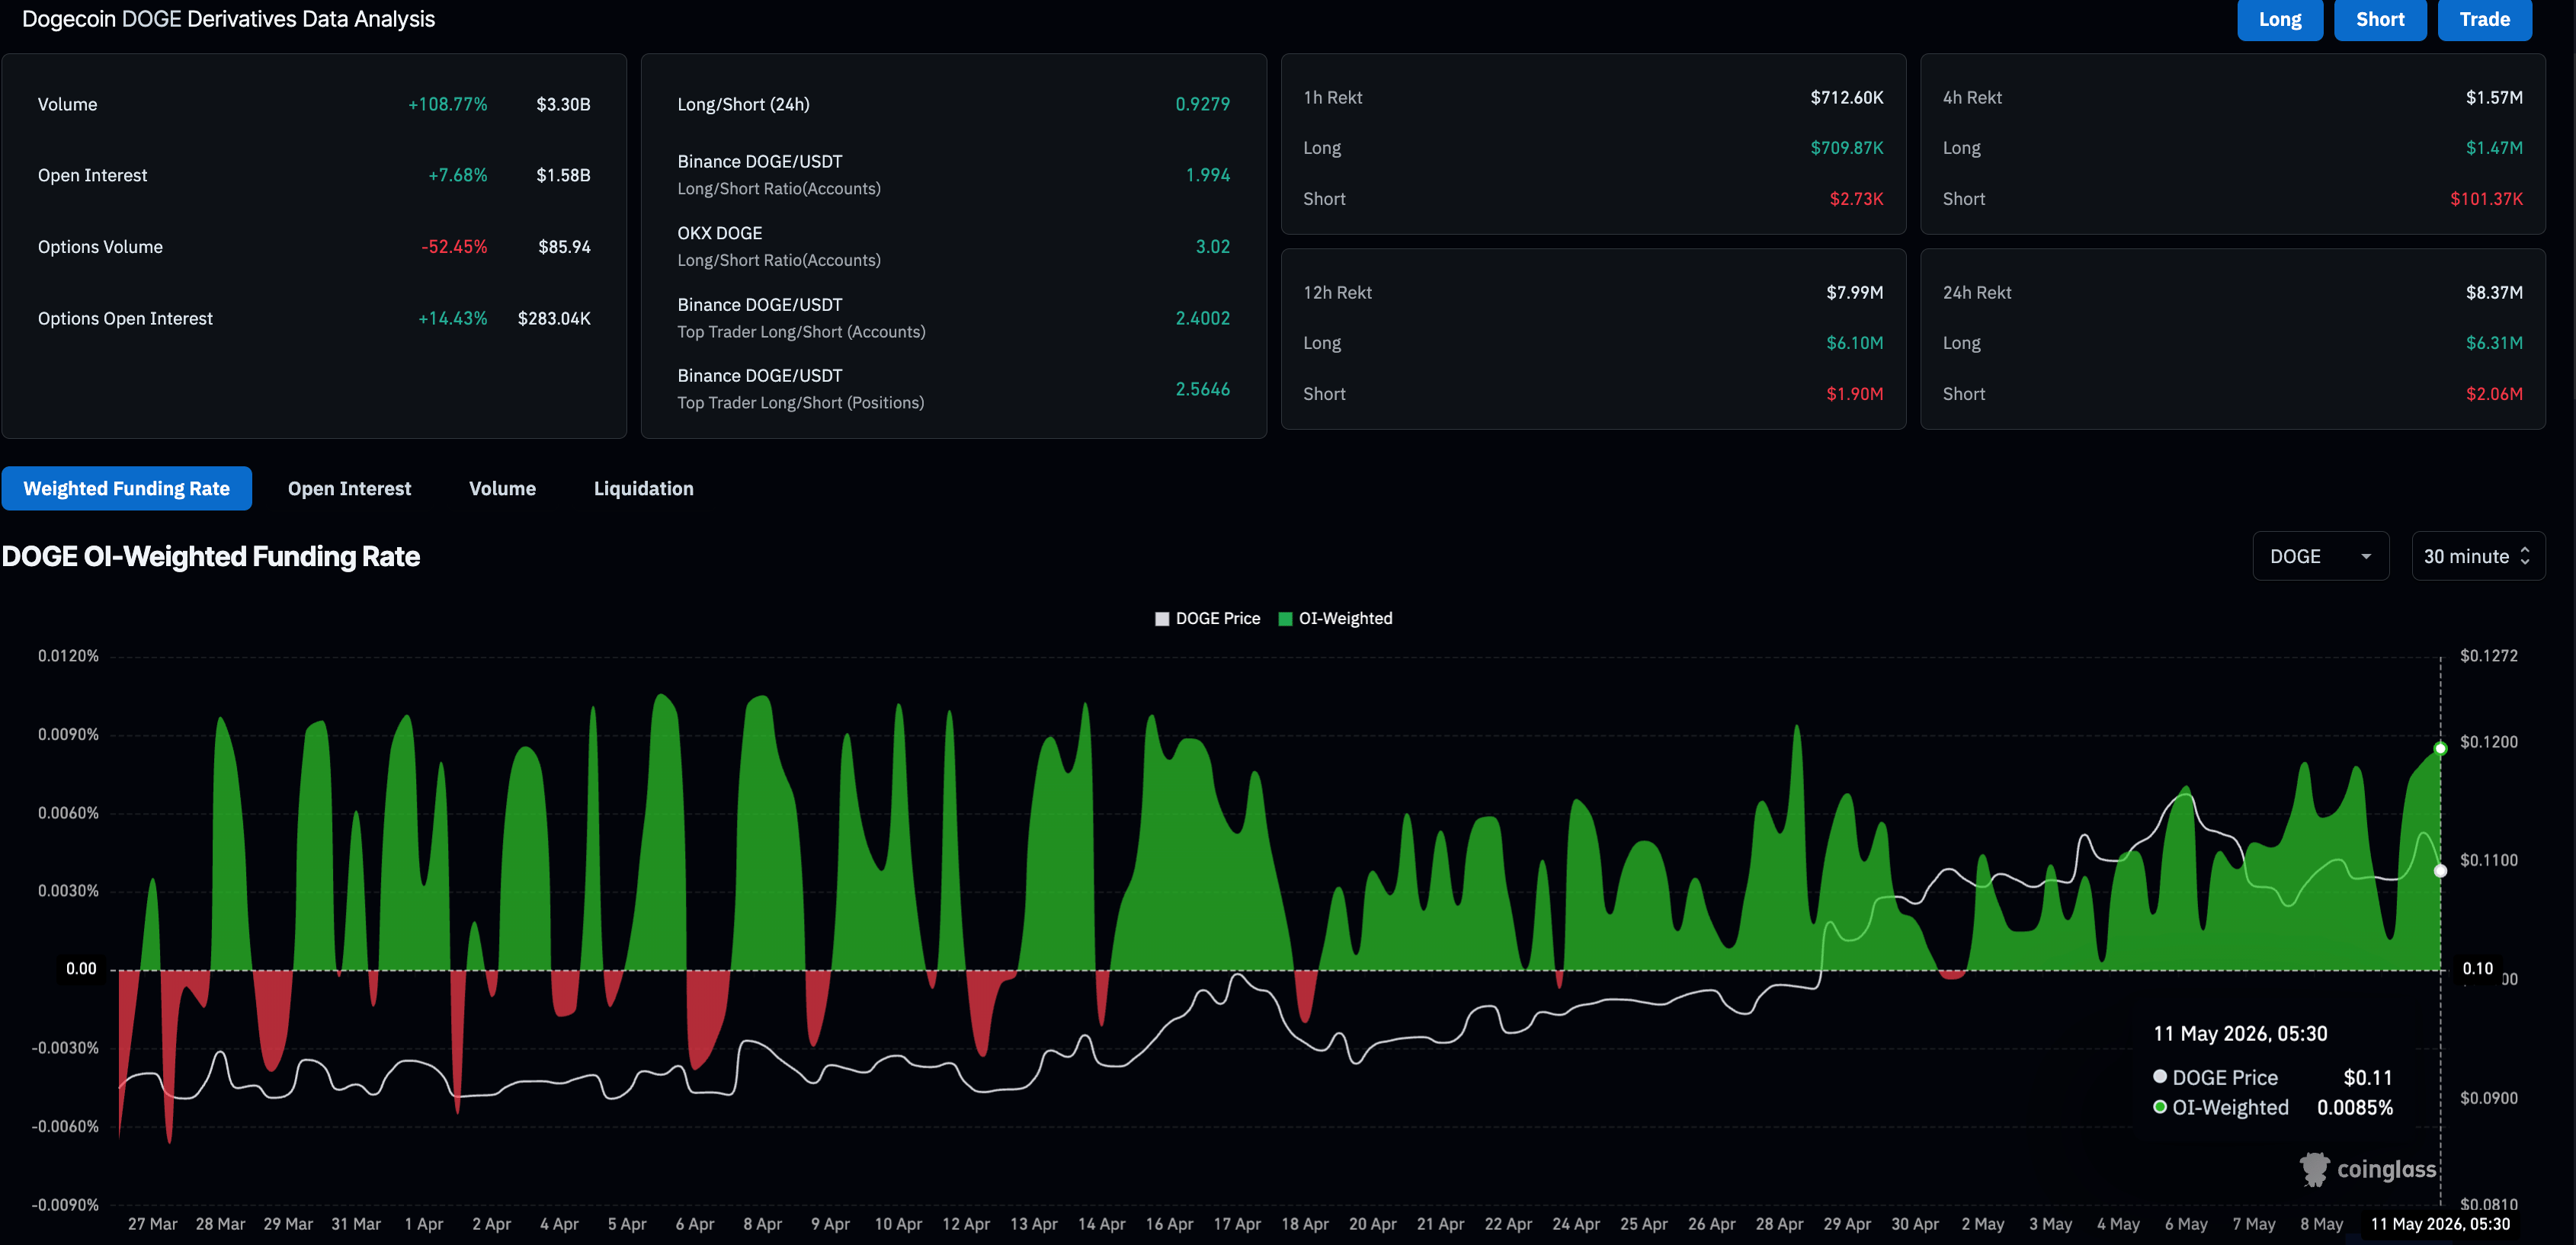
Retail anticipation fuels Dogecoin futures activity
Dogecoin retains retail interest in the leverage market despite the bearish start to the week. CoinGlass data shows the DOGE futures Open Interest (OI) is up over 7% in the last 24 hours to $1.58 billion, indicating a rise in active leverage-based positions. At the same time, the OI-based funding rates of 0.0085% reflect a bullish bias among traders, who are willing to take long positions at a premium.
However, in the case of Dogecoin, total liquidations exceeded $8 million over the last 24 hours, driven by $6.2 million in long liquidations, suggesting weakness in the spot price. If the OI continues to rise with a positive funding rate, it could lead to a long squeeze.
Will Dogecoin's recovery break above its critical trendline?
Dogecoin sustains above $0.1000 at press time on Monday, holding a largely constructive bullish bias as price sits above the 50-day and 100-day Exponential Moving Averages (EMAs) at $0.1016 and $0.1056, respectively. This positioning suggests underlying dip-buying interest, but the meme coin struggles below a key resistance trendline connecting the October 13 and 27 highs, near the $0.1161 supply zone.
The Moving Average Convergence Divergence (MACD) holds inches above the signal line in the positive territory, avoiding a bearish crossover as bullish momentum wanes. Meanwhile, the Relative Strength Index (RSI) at 58 keeps a neutral-to-positive tone, implying residual upside momentum.
A decisive close above the $0.1161 supply zone would confirm the declining trendline breakout, making the 200-day EMA at $0.1230 the next significant hurdle.
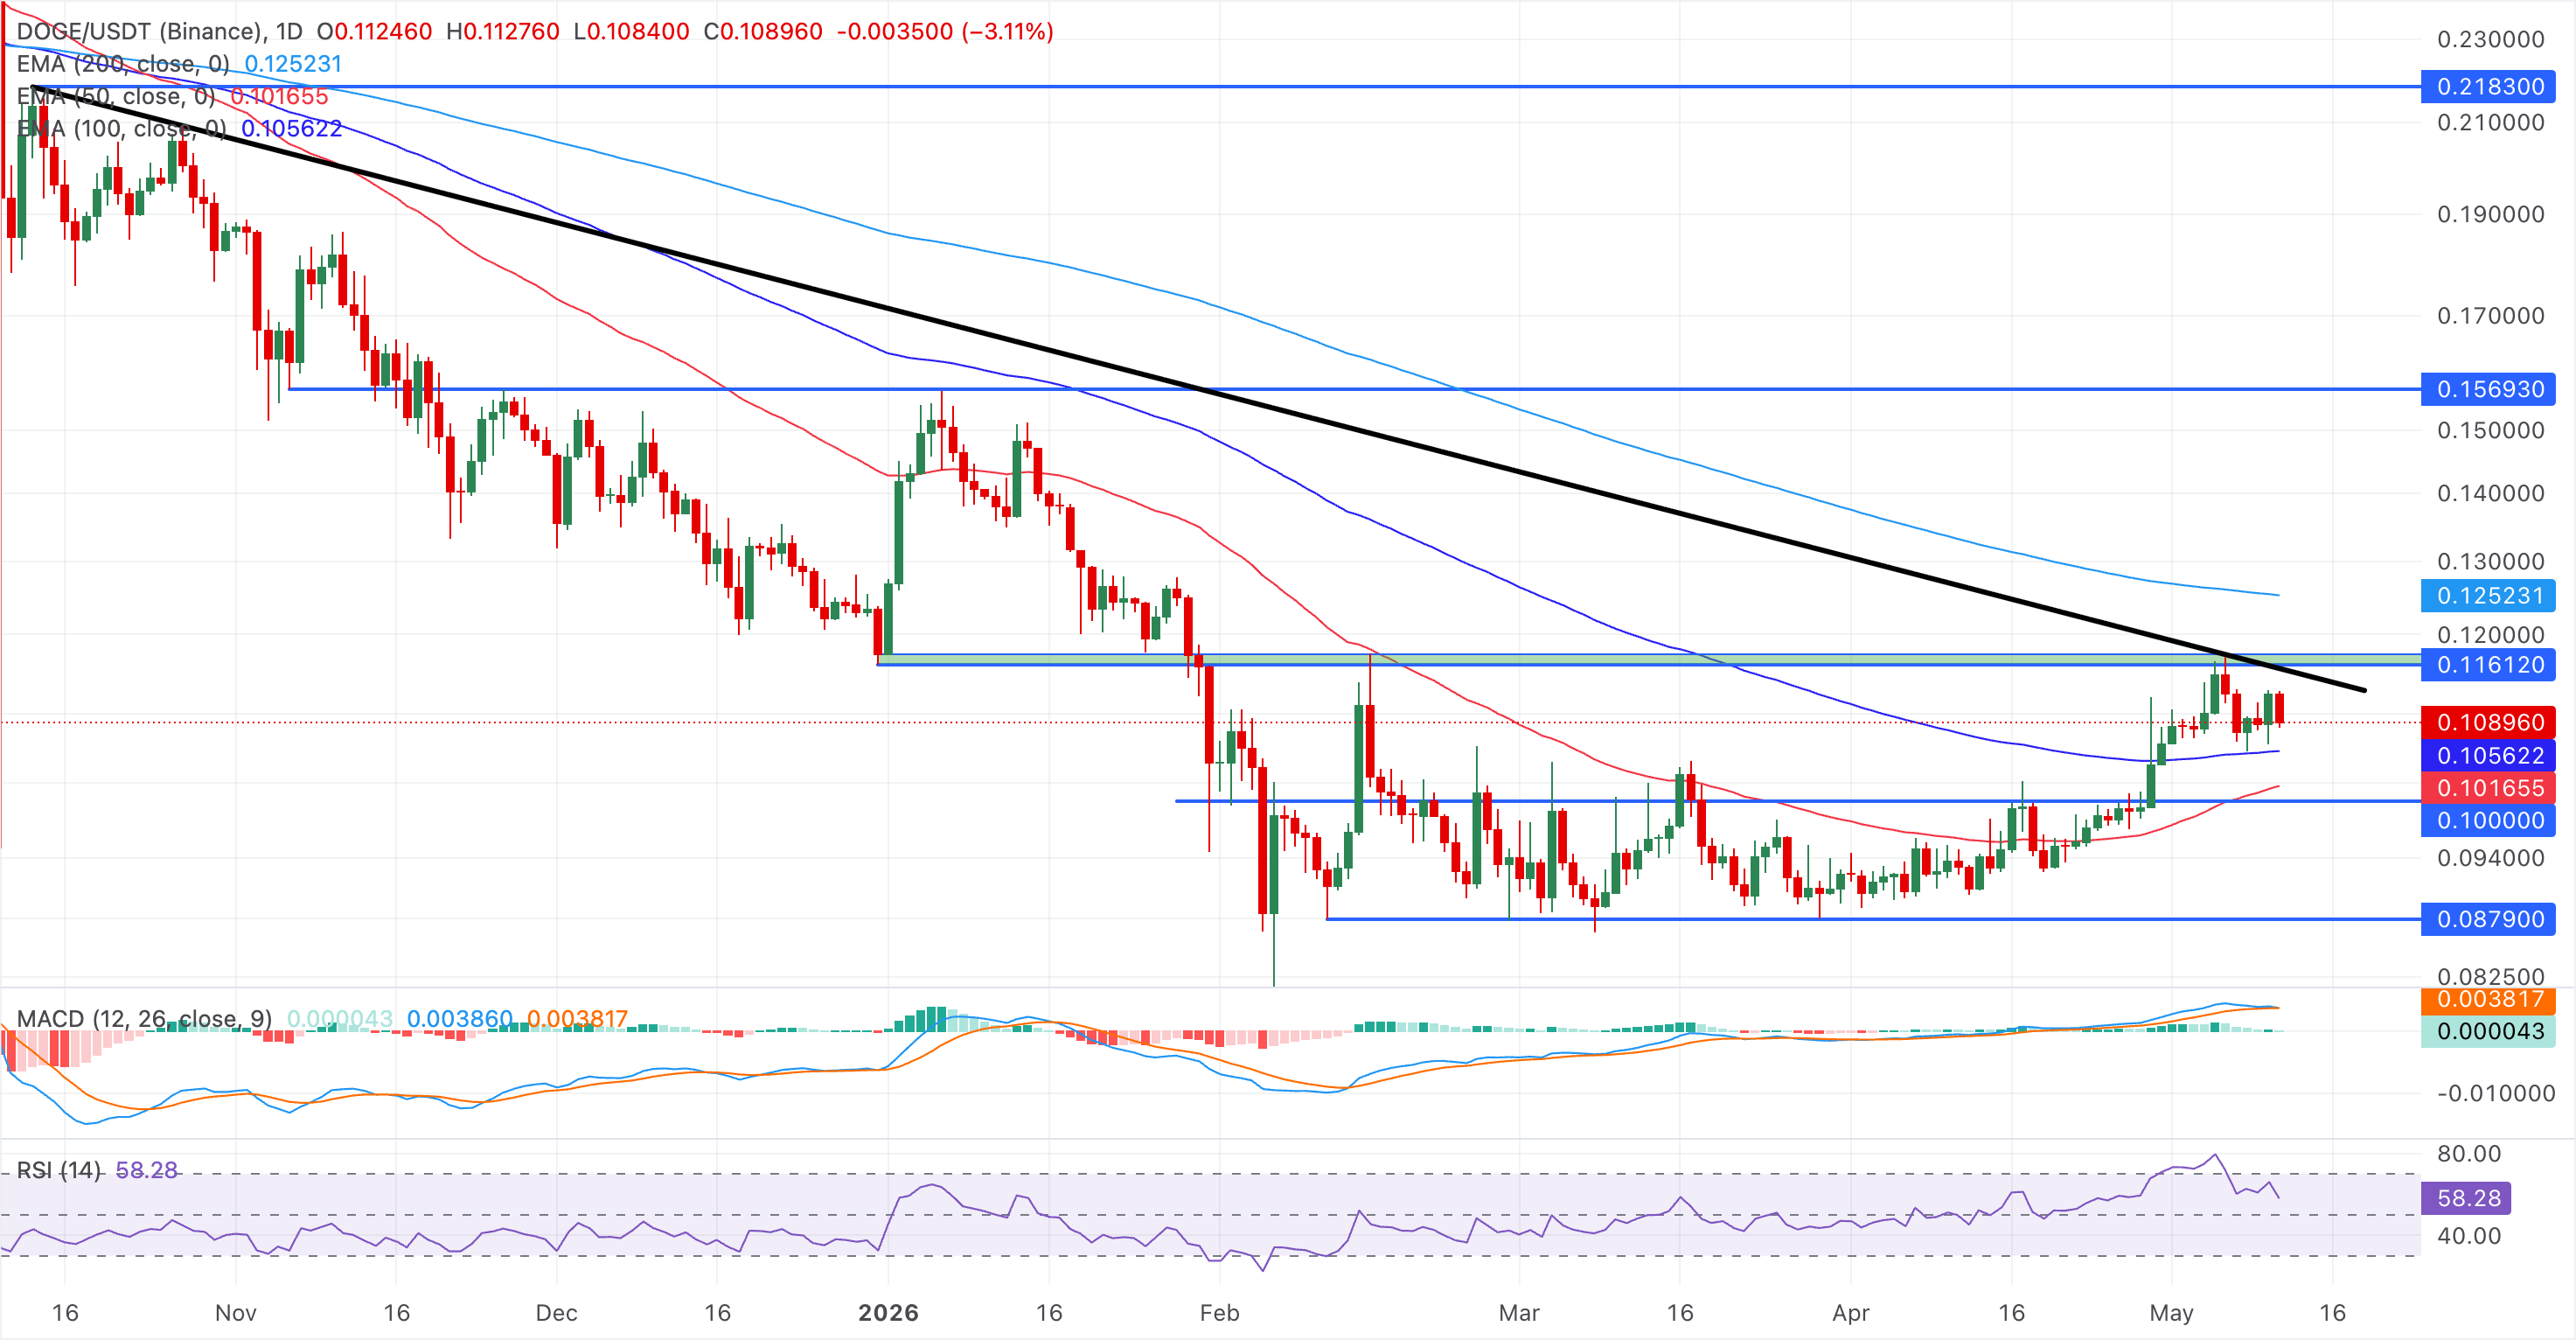
Looking south, the immediate support for DOGE is aligned with the 100-day EMA near $0.1056 and the 50-day EMA around $0.1016, where a deeper pullback would be expected to attract buyers while the broader bullish structure remains intact above these averages.
(The technical analysis of this story was written with the help of an AI tool.)


