
Dogecoin Price Forecast: DOGE in survival mode returns to key support level
作者 Vishal Dixit
更新: 2 Apr 2026


热门文章

Dogecoin (DOGE) trades in the red at press time on Thursday, below the $0.0900 level, mounting pressure on the crucial support level of $0.0879.
- Dogecoin drops below $0.0900 on Thursday under pressure from the descending 50-day EMA.
- Derivatives data shows a sell-side dominance as funding rates flip negative.
- Dogecoin must close below the $0.0879 support level to confirm further downside movement.
Dogecoin (DOGE) trades in the red at press time on Thursday, below the $0.0900 level, mounting pressure on the crucial support level of $0.0879. The meme coin is losing retail support under the weight of Donald Trump’s projection that the Iran war could last until late April, which sent oil prices back above $100. Technically, DOGE is at risk of breaking below its crucial support as selling pressure persists.
Dogecoin is losing demand
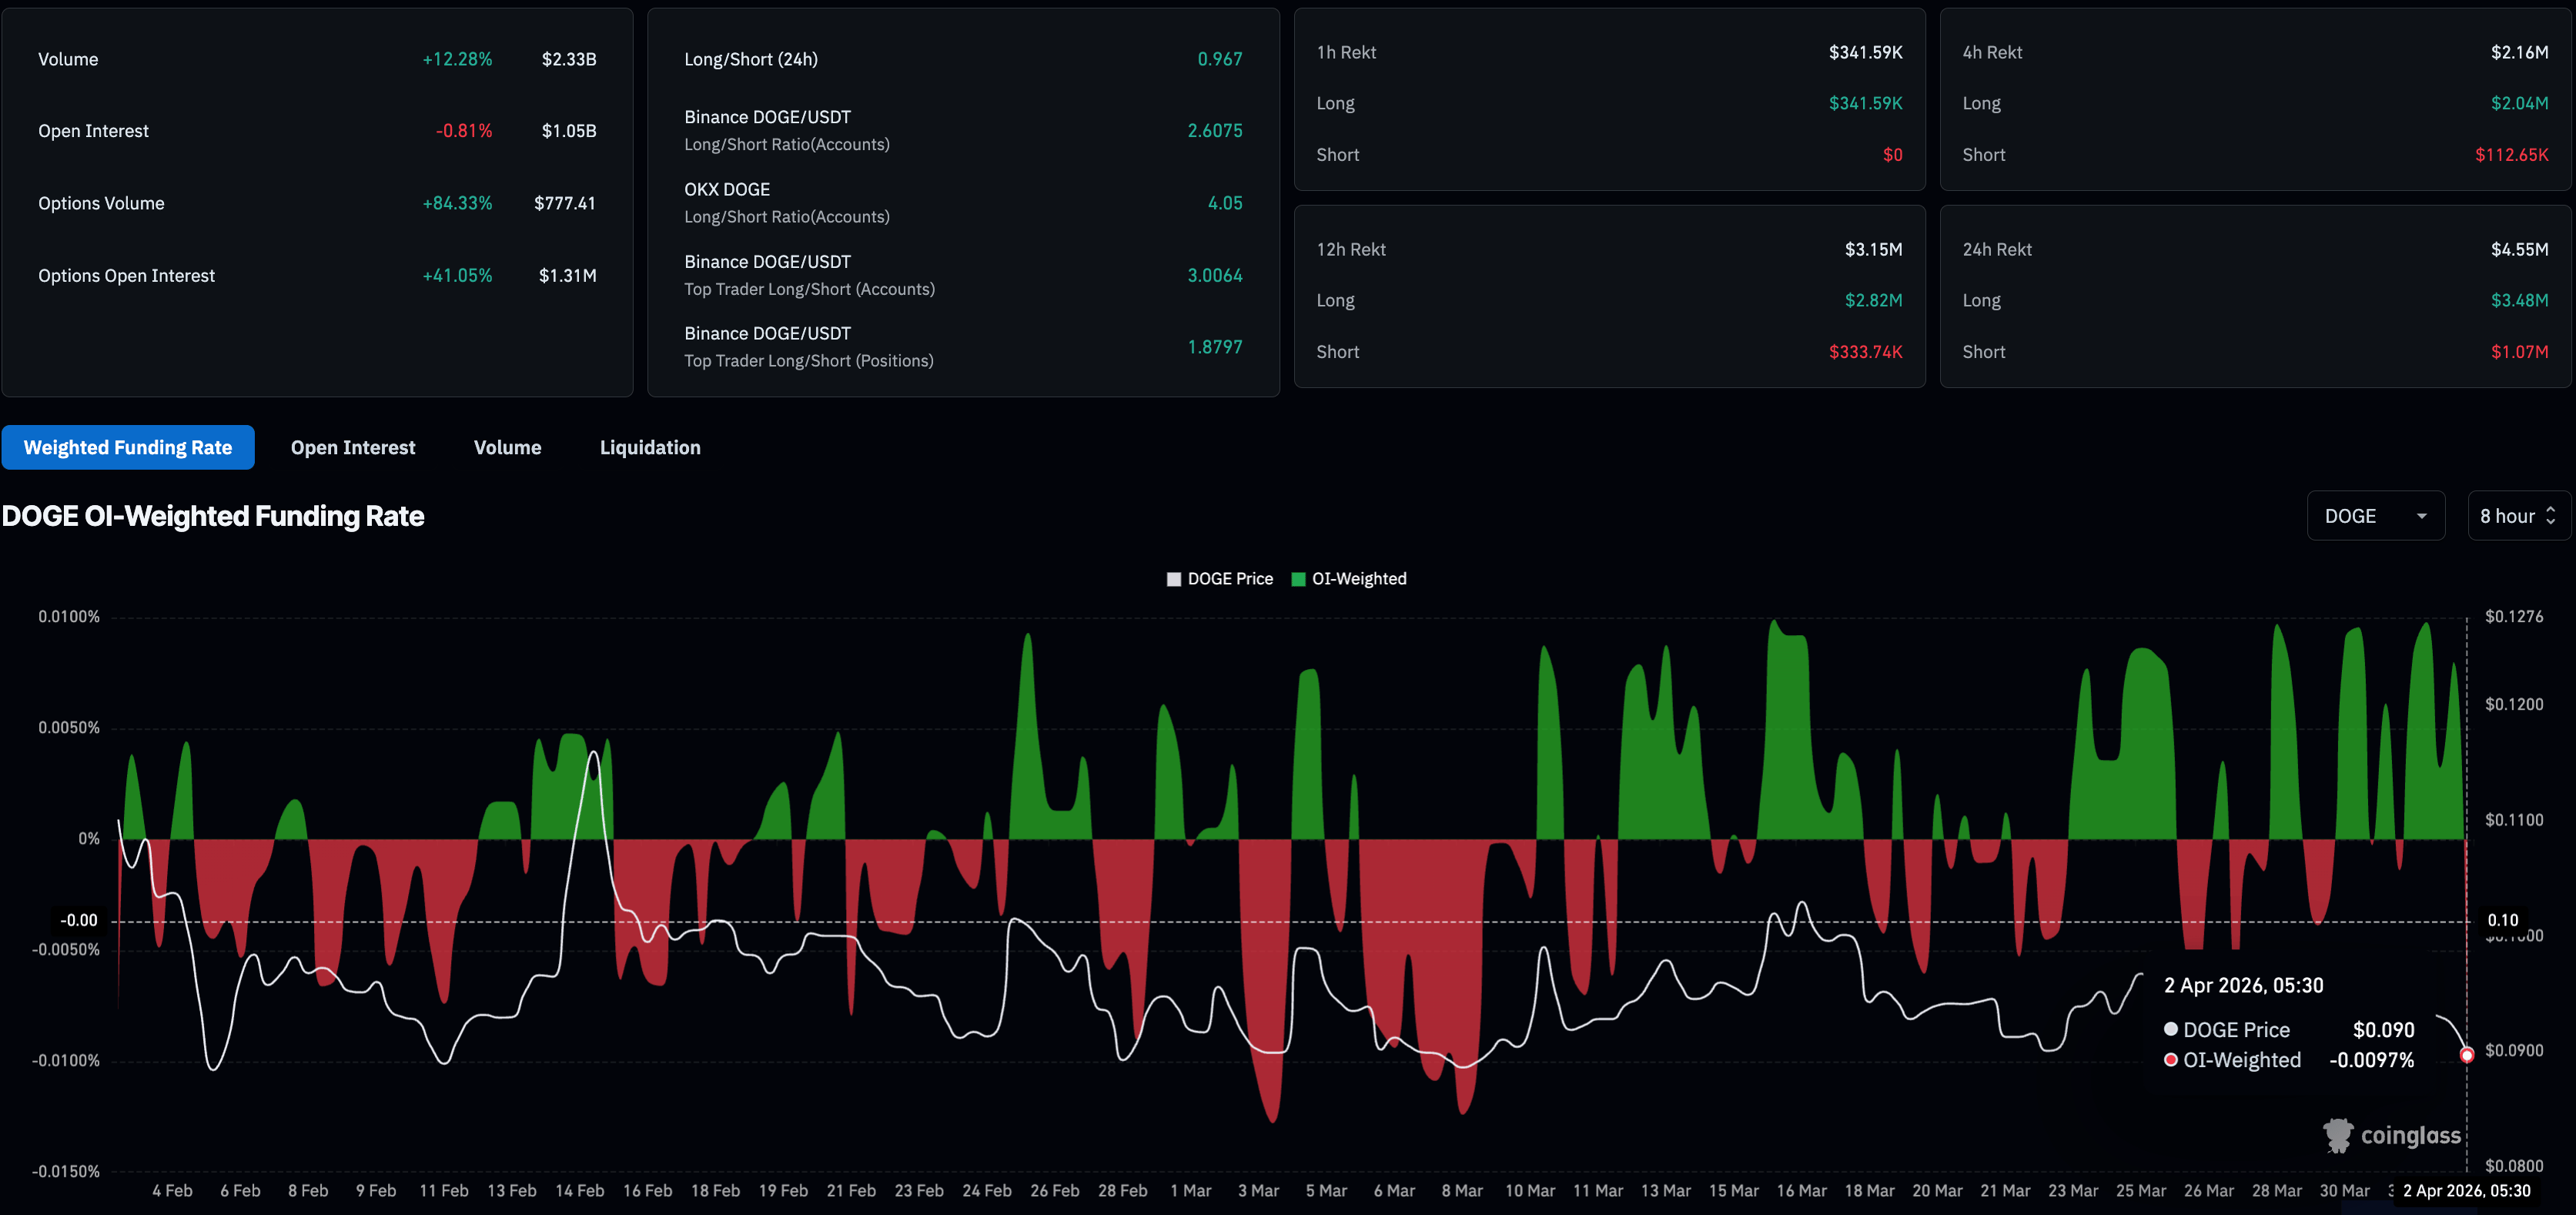
Dogecoin derivatives reflect bearish sentiment among traders, anticipating downside for the meme coin. CoinGlass data shows the DOGE futures Open Interest (OI) stands at $1.05 billion, down 0.81% in the last 24 hours, indicating a reduced notional value of open positions. This risk-off behavior aligns with the $4.55 million in liquidations in the same period, led by $3.48 million in long liquidations, reaffirming intense sell-side dominance.
The long-to-short ratio of active DOGE positions is at 0.967, suggesting a greater number of active short positions. Additionally, a sharp drop in the funding rate to -0.0097% confirms the bearish sentiment among traders, as they are willing to hold short positions at a premium.
Technical outlook: Is Dogecoin preparing for the next leg down?
Dogecoin is down over 2% at press time on Thursday, maintaining a steady decline under the influence of the descending 50-day Exponential Moving Average (EMA). The 50-, 100-, and 200-day EMAs maintain a broader bearish tone.
The Moving Average Convergence Divergence (MACD) line has slipped marginally below its signal line around the zero area, and the flattening histogram suggests weak downside momentum rather than an impulsive selloff. The Relative Strength Index (RSI) near 43 remains below the midline, reinforcing a mild bearish bias while avoiding oversold territory and leaving scope for a two-way trade.
DOGE shows buoyancy above the $0.0879 support level marked by the February 11 low. However, a daily close below this level could threaten the February 6 low at $0.0800, and if this level is breached, the meme coin could revisit the January 8, 2024, low at $0.0741.
Looking up, the 50- and 100-day EMAs at $0.0974 and $0.1107, respectively, serve as overhead resistances.
(The technical analysis of this story was written with the help of an AI tool.)

超过一百万用户依赖 FXStreet 获取实时市场数据、图表工具、专家洞见和外汇新闻。其全面的经济日历和教育网络研讨会帮助交易者保持信息领先、做出审慎决策。FXStreet 拥有约 60 人的团队,分布在巴塞罗那总部及全球各地区。
阅读更多


