
Ethereum Weekly Forecast: ETH under pressure as geopolitical tensions rise, technical rejection signals downside risk
作者 Manish Chhetri
更新: 3 Apr 2026


热门文章

Ethereum (ETH) trades in red, slipping below $2,200 on Friday after being rejected at the key resistance zone earlier this week. Risk appetite dampens as geopolitical tensions escalate following remarks from US President Donald Trump on potential further action against Iran.
- Ethereum price faces a correction from its 50-day EMA at $2,150, signaling a potential short-term pullback.
- Risk appetite deteriorates after Trump highlighted a Tehran bridge strike, and warned of further escalation, urging Iran to “make a deal.”
- Institutional demand is fading, while negative funding rates signal growing bearish sentiment in ETH derivatives markets.
Ethereum (ETH) trades in red, slipping below $2,200 on Friday after being rejected at the key resistance zone earlier this week. Risk appetite dampens as geopolitical tensions escalate following remarks from US President Donald Trump on potential further action against Iran. Meanwhile, weakening institutional demand and negative funding rates suggest growing caution among traders, raising the risk of a deeper correction in ETH in the near term.
Uncertainty remains elevated
Ethereum price began the week on a positive note after news that US President Donald Trump is willing to end the war with Iran, despite the Strait of Hormuz remains closed. Washington doesn’t intend to extend the military mission beyond his four- to six-week timeline.
On the other side, Iran’s President Masoud Pezeshkian told European Union (EU) Council President António Costa on Tuesday that his country is ready to end the war with the US. Still, the country needs certain guarantees, especially no repetition of aggression, the Iranian state news agency reported.
These developments boosted risk-on sentiment, with US equities extending their recovery and risk-sensitive assets such as Ethereum gaining further ground, while the West Texas Intermediate (WTI) Crude Oil price pulled back during the first half of this week.
However, the risk appetite dampened in the later half of the week while addressing the nation on Wednesday, Trump threatened that the ongoing war would continue until late April, stating that “We are going to hit them extremely hard over the next two to three weeks,” threatened to strike Iranian power plants, and said Iran would be sent back to the “stone age” if no deal is reached.
In addition, Trump also pointed to the destruction of a bridge in Tehran, signaling further escalation while urging Iran to reach a deal before it is too late.
In response, Iran’s Foreign Minister Abbas Araghchi said recent US strikes on civilian infrastructure would not force a retreat, describing them instead as evidence of an opponent in disarray and moral decline
These recent developments highlighted growing uncertainty in the Middle East war, tempered hopes for de-escalation in Iran, and weighed on investors’ appetite for riskier assets, bolstering the US Dollar (USD) and Oil prices while nearly eroding the recovery seen earlier this week.
Institutional demand continues to fade
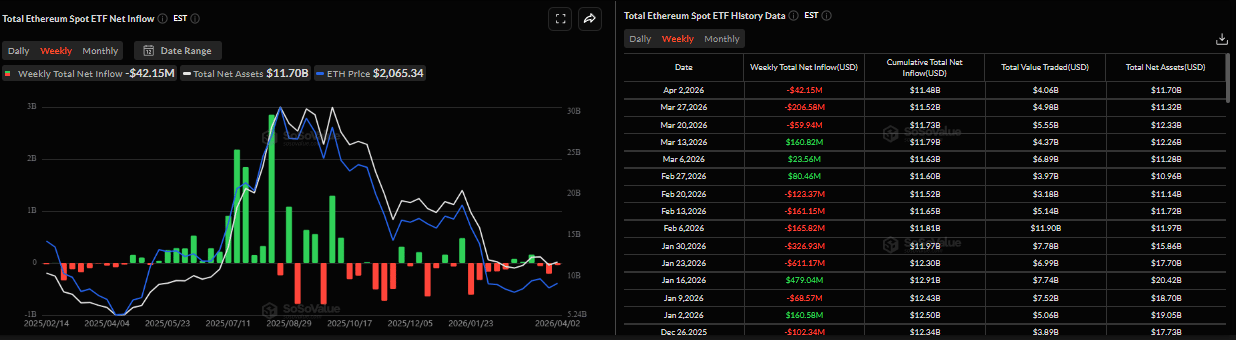
Institutional demand continues to fade so far this week. SoSoValue data showed that spot ETH Exchange Traded Funds (ETFs) recorded a total outflow of $42.15 million through Thursday. If Friday’s flows remain negative, it would mark the third consecutive week of outflows since March 20, indicating weakness among institutional investors unwilling to increase exposure to risk assets amid prevailing market uncertainty.
Other signs of bearish bias
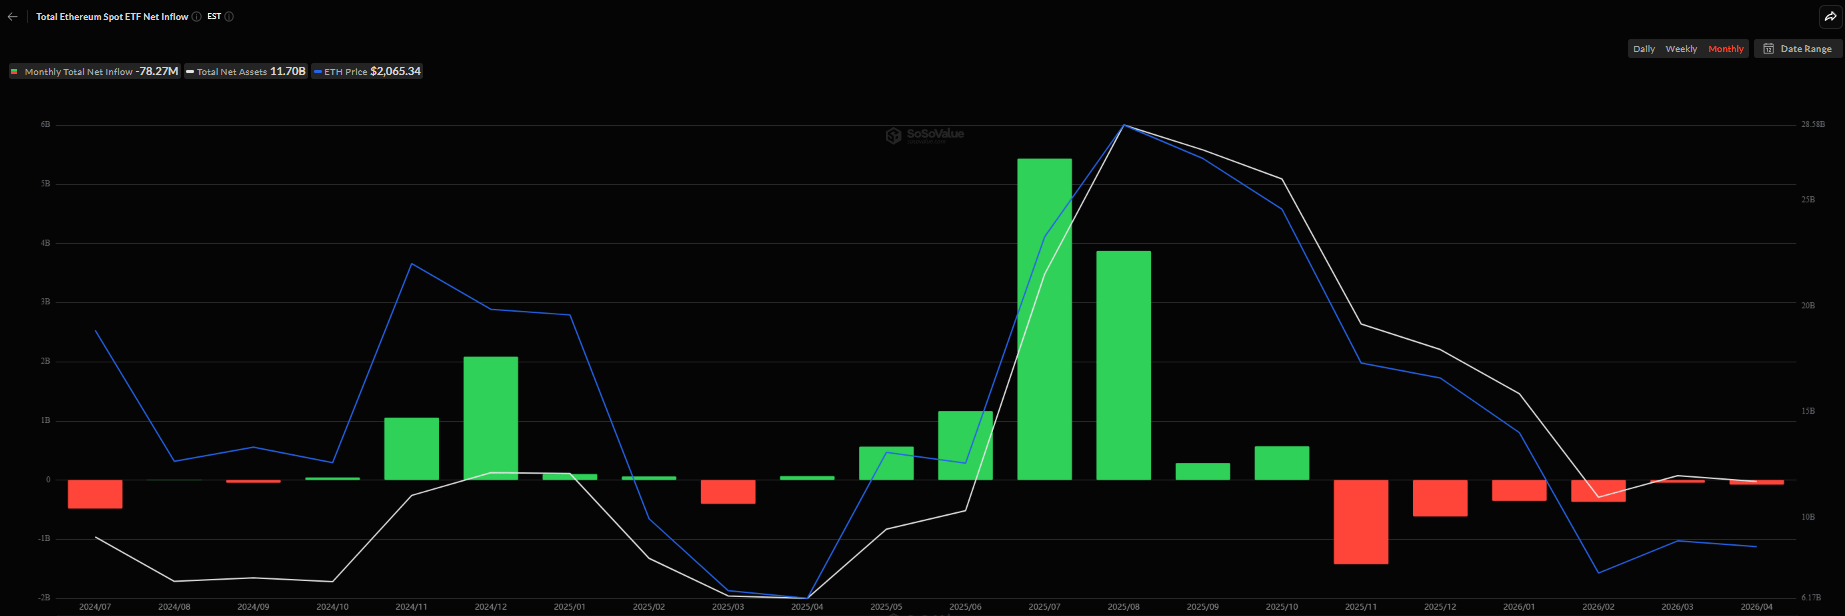
On a wider view, Ethereum’s spot demand from US-based ETFs remains subdued. The chart below shows that the spot ETFs have been negative since November, marking the fifth consecutive month of outflows through March. This trend indicates that institutional investors are either reducing exposure or staying on the sidelines, signaling a lack of strong conviction in ETH’s near-term upside and adding to the prevailing bearish outlook.
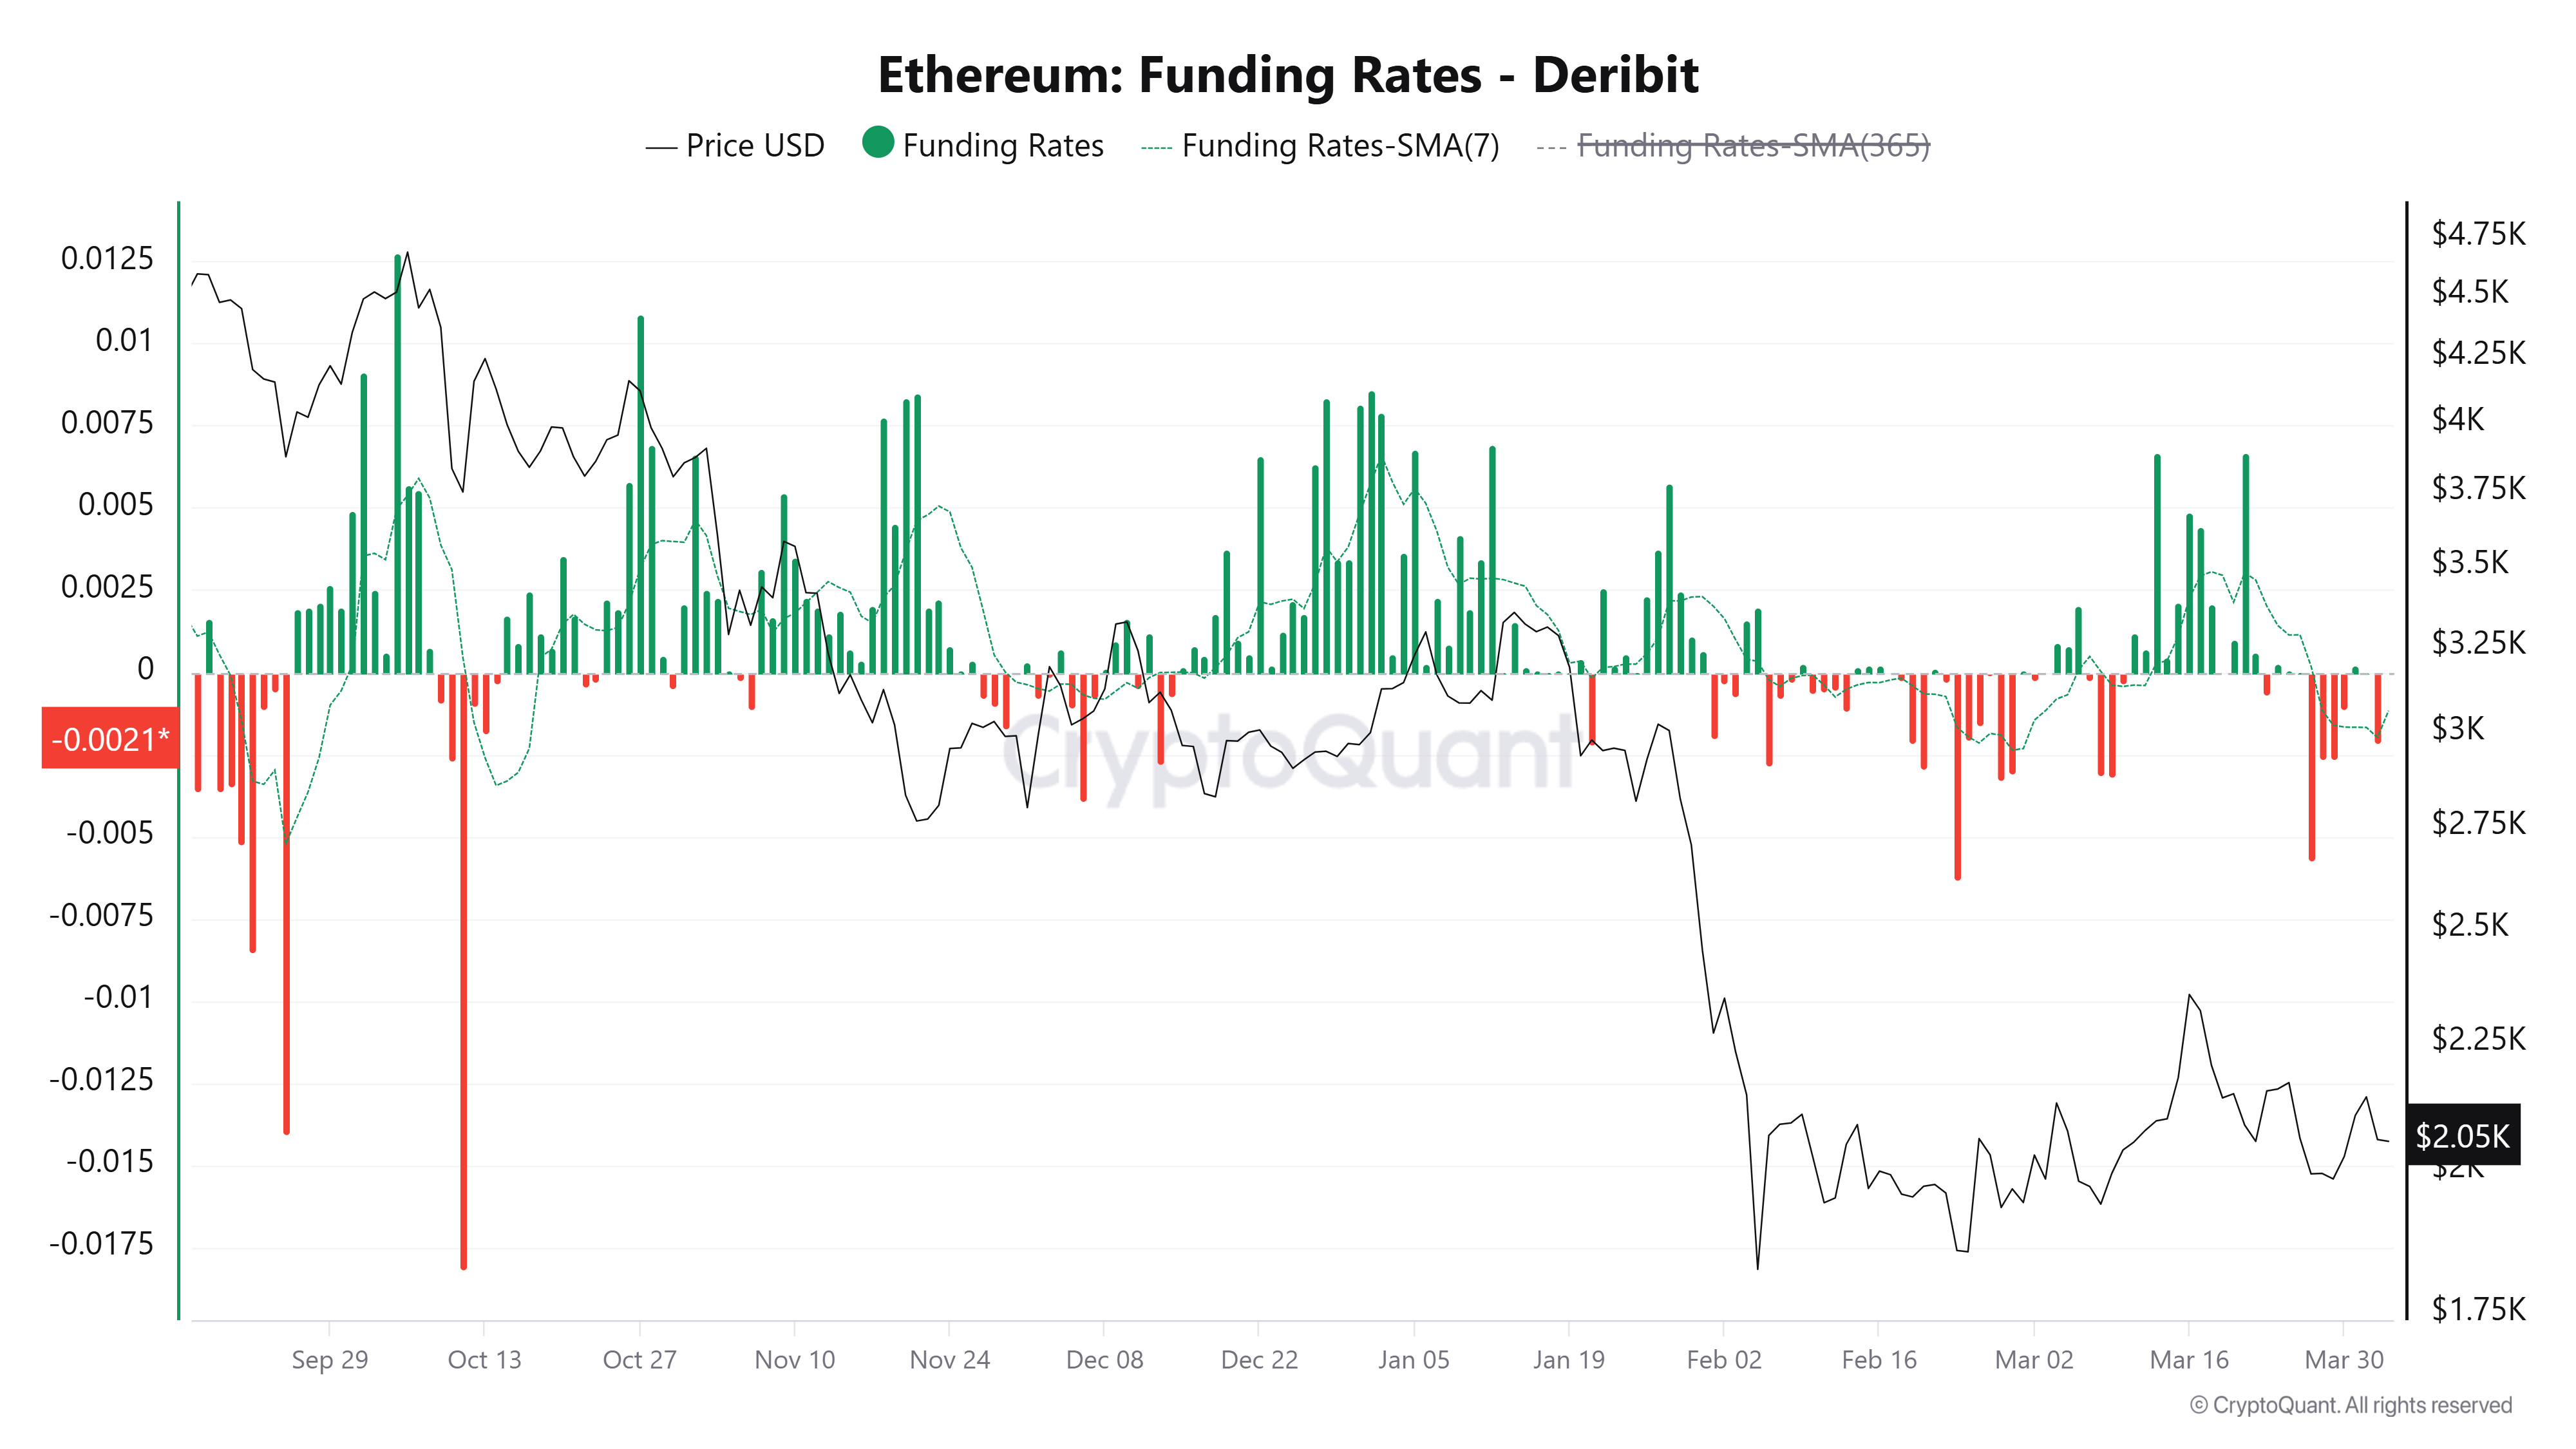
Moreover, funding rates on Deribit have remained negative so far this week, further suggesting a bearish bias as traders favor short positions, signaling weak market confidence and limited near-term upside momentum.
More room for correction
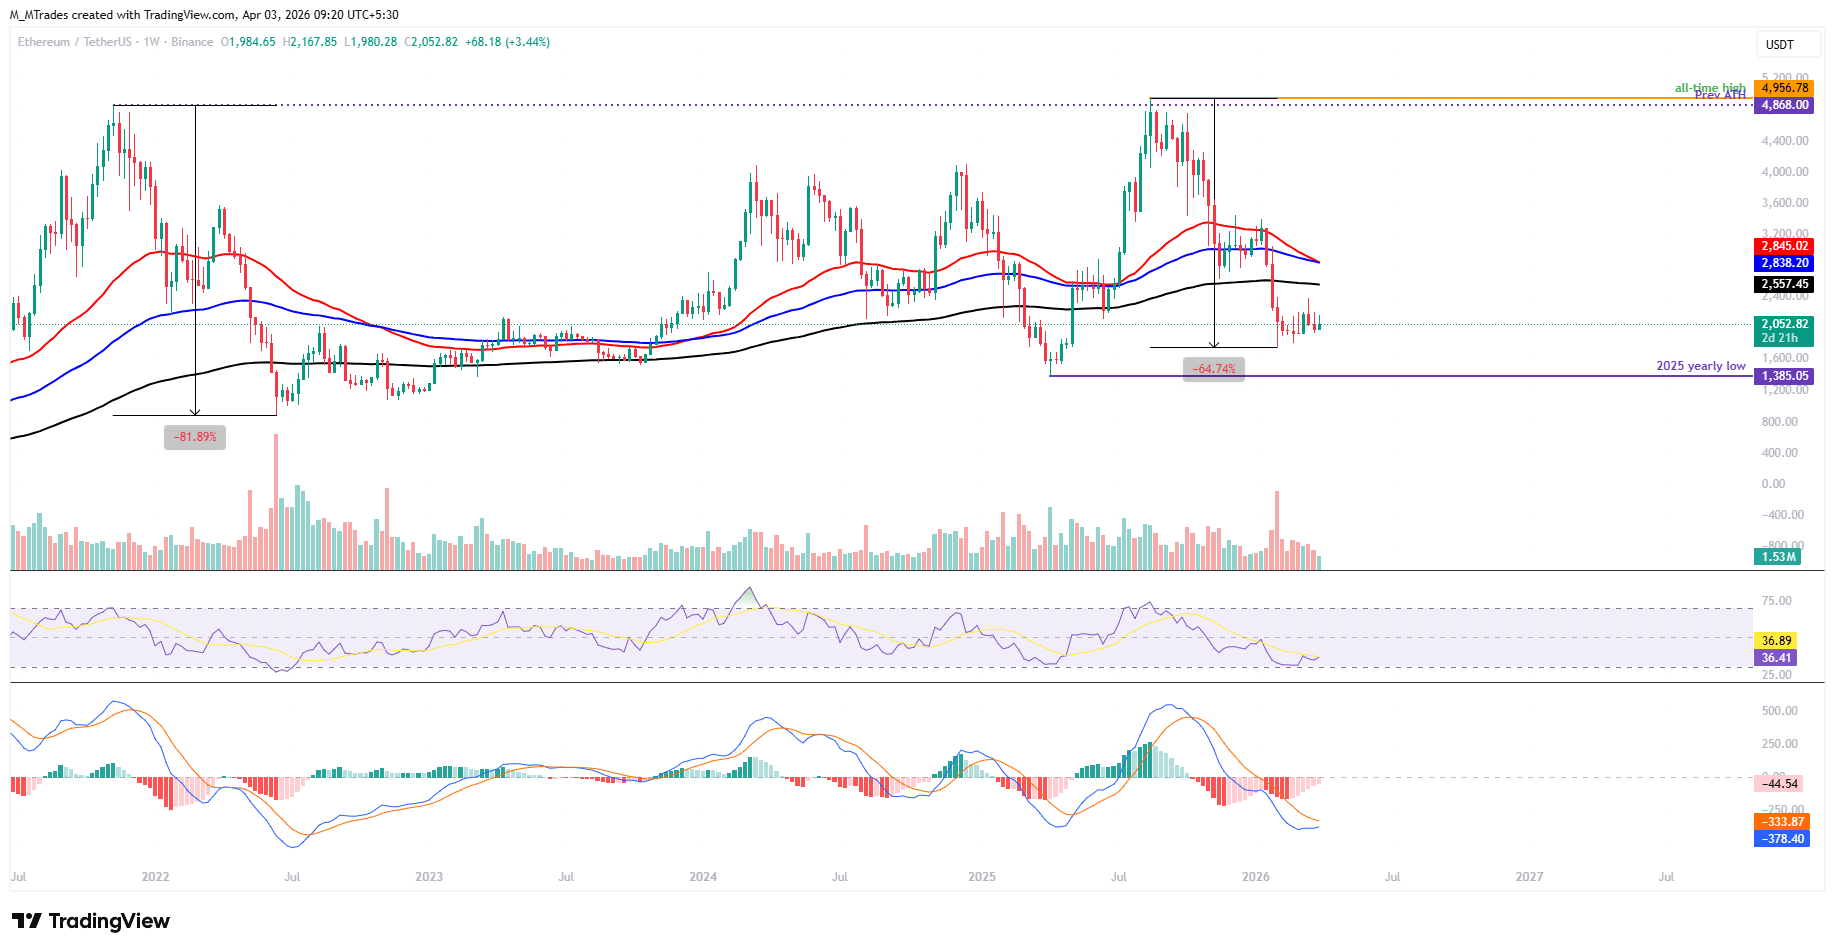
Ethereum is trading slightly above $2,050 on the weekly chart on Friday. However, the current trading price has remained below the cluster of 50-week, 100-week and 200-week Exponential Moving Averages (EMAs), indicating a broader downward trend.
Compared to the previous bear market cycle (2021-2022), ETH has corrected nearly 82% from its cycle high. In the current regime, ETH has fallen by over 64% from its record high of $4,956, indicating that bears still have room for further correction, with the 2025 yearly low at $1,385 as the next downside target.
The Relative Strength Index (RSI) reads 36 on the weekly chart, below the neutral level of 50 and near oversold territory, indicating persistent but not yet exhausted bearish momentum. The Moving Average Convergence Divergence (MACD) indicator on the same chart also showed a bearish crossover in mid-October, which remains intact, supporting the negative outlook. Still, contracting red histogram bars, as the MACD line approaches its signal line, suggest easing bearish pressure.
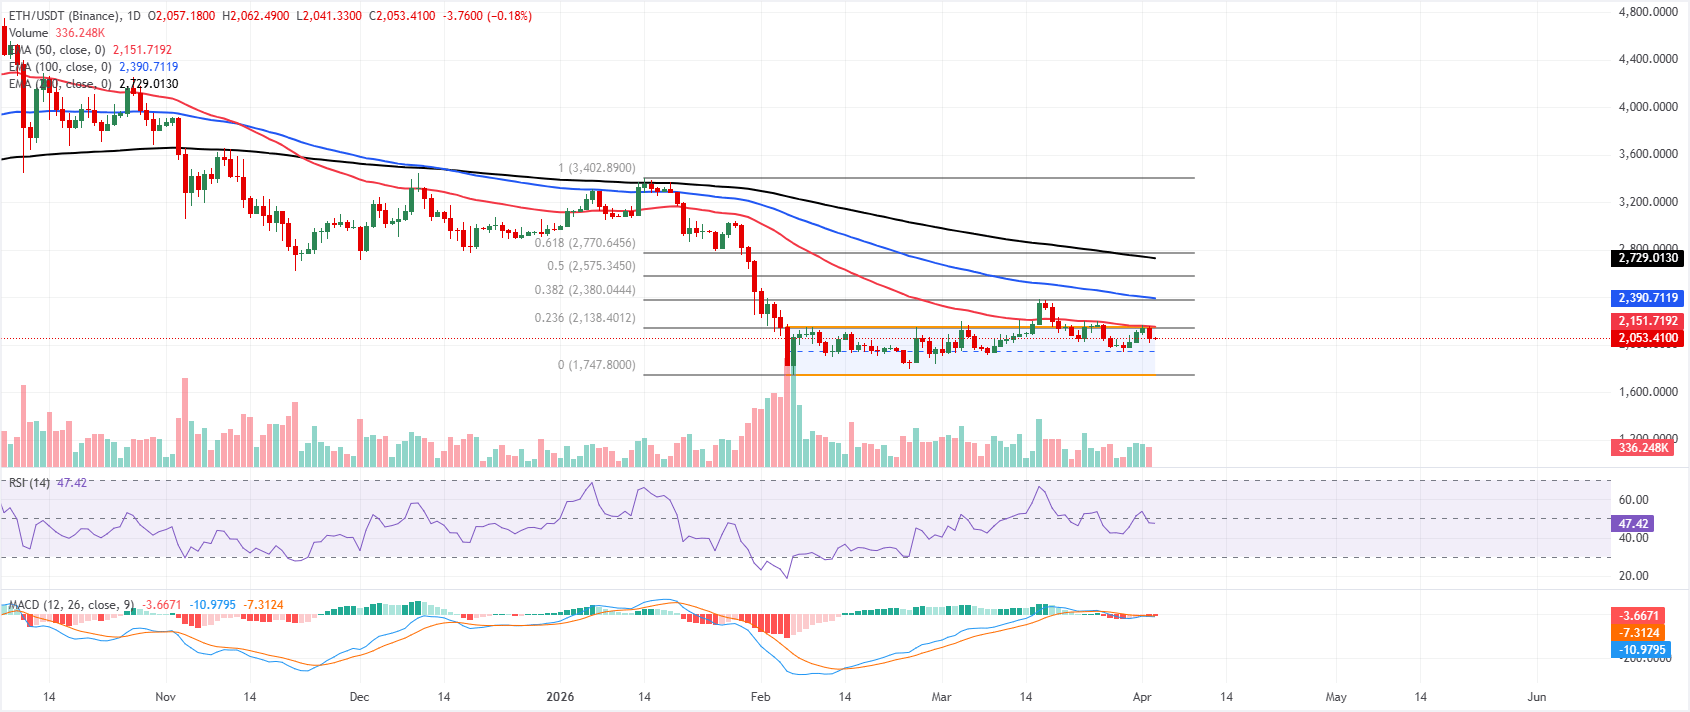
On the daily chart, the near-term bias stays bearish as price holds well below the horizontal channel top near $2,148 and remains capped under the 23.6% Fibonacci retracement at $2,138, measured from the $1,747 low to the $3,402 high. The cluster of 50-day, 100-day, and 200-day EMAs above $2,150 highlights a firmly dominant higher-timeframe downtrend weighing on rebounds.
Daily RSI around 47 indicates momentum is slightly tilted to the downside, while the MACD indicator trades below the signal line and near the zero line, with a negative bias that reinforces fading upside pressure within the channel.
Initial resistance stands at the 23.6% retracement at $2,138, with the channel top near $2,148 acting as a stronger cap as long as bears defend the broader trend of lower highs. A daily close above $2,148 would be needed to challenge the 38.2% retracement at $2,380 and start neutralizing the bearish structure.
On the downside, immediate support emerges at $2,000 is a key psychological level, ahead of the channel midpoint at $1,950. Further weakness and a close below this level could extend the decline toward the channel floor, aligning with $1,750 as a more strategic support zone if selling pressure persists.
(The technical analysis of this story was written with the help of an AI tool.)
Ethereum FAQs
Ethereum is a decentralized open-source blockchain with smart contracts functionality. Its native currency Ether (ETH), is the second-largest cryptocurrency and number one altcoin by market capitalization. The Ethereum network is tailored for building crypto solutions like decentralized finance (DeFi), GameFi, non-fungible tokens (NFTs), decentralized autonomous organizations (DAOs), etc.
Ethereum is a public decentralized blockchain technology, where developers can build and deploy applications that function without the need for a central authority. To make this easier, the network leverages the Solidity programming language and Ethereum virtual machine which helps developers create and launch applications with smart contract functionality.
Smart contracts are publicly verifiable codes that automates agreements between two or more parties. Basically, these codes self-execute encoded actions when predetermined conditions are met.
Staking is a process of earning yield on your idle crypto assets by locking them in a crypto protocol for a specified duration as a means of contributing to its security. Ethereum transitioned from a Proof-of-Work (PoW) to a Proof-of-Stake (PoS) consensus mechanism on September 15, 2022, in an event christened “The Merge.” The Merge was a key part of Ethereum's roadmap to achieve high-level scalability, decentralization and security while remaining sustainable. Unlike PoW, which requires the use of expensive hardware, PoS reduces the barrier of entry for validators by leveraging the use of crypto tokens as the core foundation of its consensus process.
Gas is the unit for measuring transaction fees that users pay for conducting transactions on Ethereum. During periods of network congestion, gas can be extremely high, causing validators to prioritize transactions based on their fees.

超过一百万用户依赖 FXStreet 获取实时市场数据、图表工具、专家洞见和外汇新闻。其全面的经济日历和教育网络研讨会帮助交易者保持信息领先、做出审慎决策。FXStreet 拥有约 60 人的团队,分布在巴塞罗那总部及全球各地区。
阅读更多


