
EUR/USD Price Forecast: Eyes 1.1500 barrier near nine-day EMA
作者 Akhtar Faruqui
发布日期: 19 Mar 2026 | 修改日期: 19 Mar 2026


热门文章

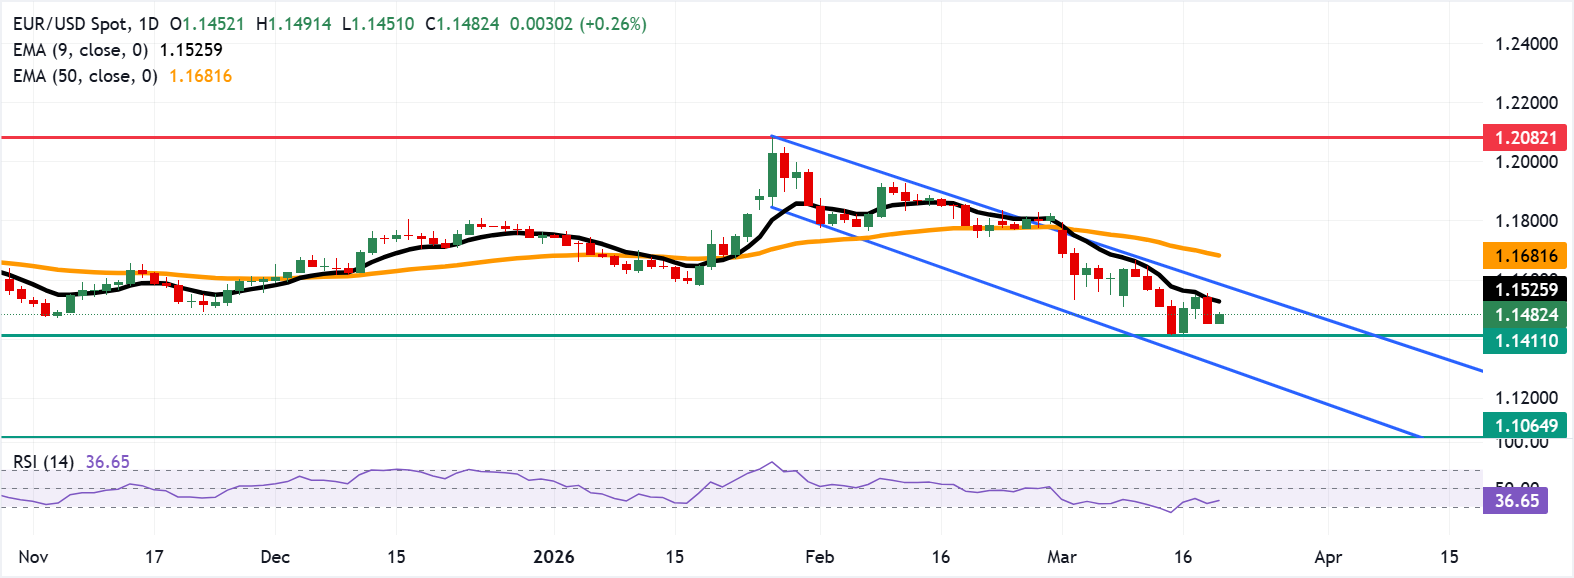
EUR/USD recovers its losses registered in the previous session, hovering near 1.1490 during Asian trading hours on Thursday. Daily chart technical analysis indicates a persistent bearish bias as the pair moves downwards within a descending channel pattern.
- EUR/USD may fall toward the seven-month low of 1.1411.
- The 14-day Relative Strength Index stands at 37, signaling ongoing bearish momentum.
- Initial resistance is seen at the nine-day EMA around 1.1526.
EUR/USD recovers its losses registered in the previous session, hovering near 1.1490 during Asian trading hours on Thursday. Daily chart technical analysis indicates a persistent bearish bias as the pair moves downwards within a descending channel pattern.
The near-term bias is mildly bearish as the EUR/USD pair holds below both the nine-day and 50-day Exponential Moving Averages (EMAs), which cap recovery attempts around the mid-1.15s and high-1.16s, respectively. The short-term average trend is below the medium-term one and tracks the price lower, reinforcing downside pressure after the recent series of lower closes from the 1.19 area.
The 14-day Relative Strength Index (RSI) momentum indicator at 37 stays below the 50 line, confirming prevailing selling momentum without yet signaling a deeply oversold condition.
The EUR/USD pair may find its primary support at the seven-month low of 1.1411, recorded on March 13. Further support lies at the lower boundary of the descending channel around 1.1310.
On the upside, the initial resistance lies at the nine-day EMA of 1.1526, followed by the upper descending channel boundary around 1.1600. A break above the channel would strengthen the market bias and support the pair in testing the 50-day EMA at 1.681.
(The technical analysis of this story was written with the help of an AI tool.)
Euro Price Today
The table below shows the percentage change of Euro (EUR) against listed major currencies today. Euro was the strongest against the US Dollar.
| USD | EUR | GBP | JPY | CAD | AUD | NZD | CHF | |
|---|---|---|---|---|---|---|---|---|
| USD | -0.27% | -0.25% | -0.16% | -0.08% | -0.39% | -0.43% | -0.18% | |
| EUR | 0.27% | 0.00% | 0.09% | 0.20% | -0.12% | -0.19% | 0.09% | |
| GBP | 0.25% | 0.00% | 0.08% | 0.19% | -0.13% | -0.19% | 0.07% | |
| JPY | 0.16% | -0.09% | -0.08% | 0.06% | -0.25% | -0.34% | -0.02% | |
| CAD | 0.08% | -0.20% | -0.19% | -0.06% | -0.29% | -0.38% | -0.10% | |
| AUD | 0.39% | 0.12% | 0.13% | 0.25% | 0.29% | -0.07% | 0.20% | |
| NZD | 0.43% | 0.19% | 0.19% | 0.34% | 0.38% | 0.07% | 0.27% | |
| CHF | 0.18% | -0.09% | -0.07% | 0.02% | 0.10% | -0.20% | -0.27% |
The heat map shows percentage changes of major currencies against each other. The base currency is picked from the left column, while the quote currency is picked from the top row. For example, if you pick the Euro from the left column and move along the horizontal line to the US Dollar, the percentage change displayed in the box will represent EUR (base)/USD (quote).

超过一百万用户依赖 FXStreet 获取实时市场数据、图表工具、专家洞见和外汇新闻。其全面的经济日历和教育网络研讨会帮助交易者保持信息领先、做出审慎决策。FXStreet 拥有约 60 人的团队,分布在巴塞罗那总部及全球各地区。
阅读更多


