
GBP/USD Price Forecast: Remains above nine-day EMA near 1.3650
作者 Akhtar Faruqui
发布日期: 11 Feb 2026 | 修改日期: 11 Feb 2026


热门文章

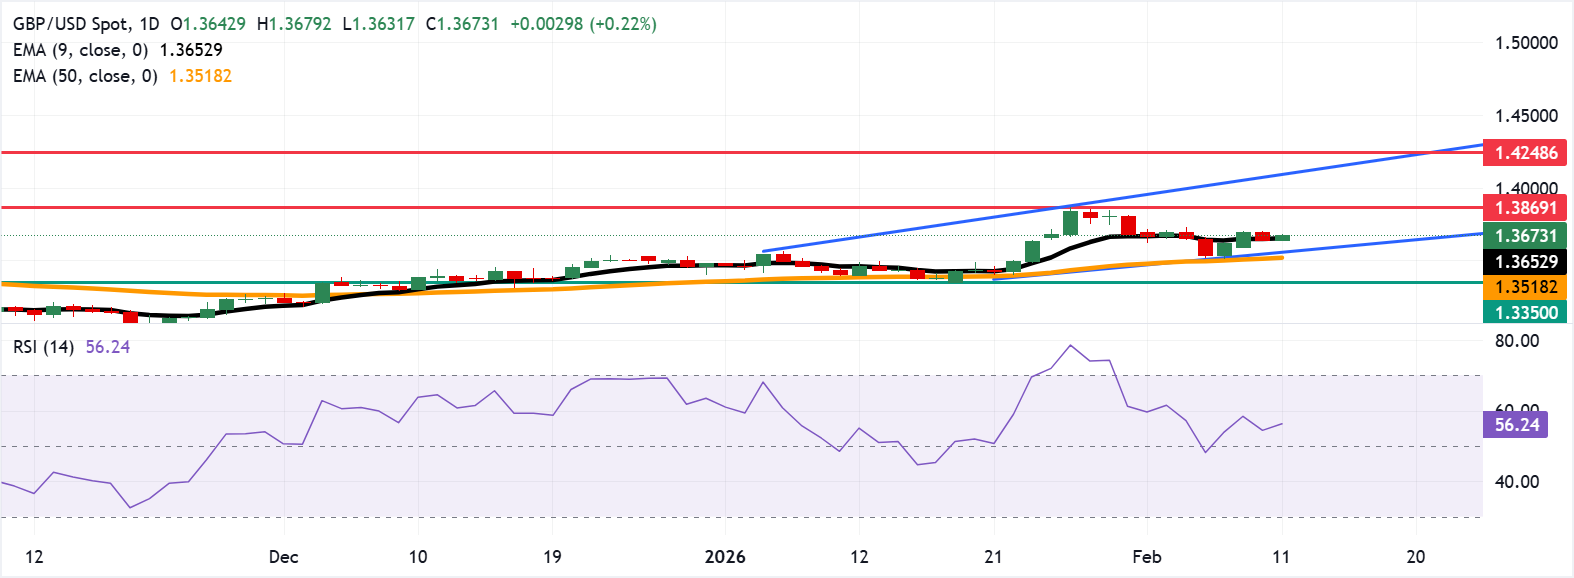
GBP/USD recovers its recent losses from the previous session, trading around 1.3680 during the European hours on Wednesday. The technical analysis of the daily chart indicates a sustained bullish bias, as the pair trades within an ascending channel pattern.
- GBP/USD may explore the region around 1.3869, the highest since September 2021.
- The 14-day Relative Strength Index at 55.94 signals steady bullish momentum.
- The immediate support is seen at the nine-day EMA near 1.3652.
GBP/USD recovers its recent losses from the previous session, trading around 1.3680 during the European hours on Wednesday. The technical analysis of the daily chart indicates a sustained bullish bias, as the pair trades within an ascending channel pattern.
The 14-day Relative Strength Index (RSI), a momentum indicator, at 55.94 sits above the 50 mid-line, confirming steady bullish momentum without overbought stress. The nine-day Exponential Moving Average (EMA) rises above the 50-day EMA at 1.3518, keeping the near-term bias positive as price holds above both gauges. The 50-day EMA trends higher, underlining an improving medium-term backdrop.
A topside extension would target resistance at 1.3869, the highest since September 2021, reached on January 27, followed by the upper boundary of the ascending channel around 1.4110. A break above the channel may trigger a fresh rally toward 1.4248, the highest level since April 2018.
On the downside, the immediate support lies at the nine-day EMA at 1.3652. Further weakness could draw a pullback toward support at the lower boundary of the ascending channel around 1.3570, followed by the 50-day EMA at 1.3518. Further declines would put downward pressure on the GBP/USD pair, testing the support reversal zone around 1.3350.
(The technical analysis of this story was written with the help of an AI tool.)
Pound Sterling Price Today
The table below shows the percentage change of British Pound (GBP) against listed major currencies today. British Pound was the strongest against the US Dollar.
| USD | EUR | GBP | JPY | CAD | AUD | NZD | CHF | |
|---|---|---|---|---|---|---|---|---|
| USD | -0.17% | -0.21% | -0.69% | -0.22% | -0.40% | -0.16% | -0.33% | |
| EUR | 0.17% | -0.04% | -0.55% | -0.05% | -0.23% | 0.00% | -0.17% | |
| GBP | 0.21% | 0.04% | -0.50% | -0.01% | -0.19% | 0.05% | -0.12% | |
| JPY | 0.69% | 0.55% | 0.50% | 0.50% | 0.32% | 0.56% | 0.39% | |
| CAD | 0.22% | 0.05% | 0.00% | -0.50% | -0.18% | 0.06% | -0.11% | |
| AUD | 0.40% | 0.23% | 0.19% | -0.32% | 0.18% | 0.24% | 0.07% | |
| NZD | 0.16% | -0.01% | -0.05% | -0.56% | -0.06% | -0.24% | -0.17% | |
| CHF | 0.33% | 0.17% | 0.12% | -0.39% | 0.11% | -0.07% | 0.17% |
The heat map shows percentage changes of major currencies against each other. The base currency is picked from the left column, while the quote currency is picked from the top row. For example, if you pick the British Pound from the left column and move along the horizontal line to the US Dollar, the percentage change displayed in the box will represent GBP (base)/USD (quote).

超过一百万用户依赖 FXStreet 获取实时市场数据、图表工具、专家洞见和外汇新闻。其全面的经济日历和教育网络研讨会帮助交易者保持信息领先、做出审慎决策。FXStreet 拥有约 60 人的团队,分布在巴塞罗那总部及全球各地区。
阅读更多


