
GBP/USD Price Forecast: Tests 1.3300 support as bearish bias prevails
作者 Akhtar Faruqui
发布日期: 17 Mar 2026 | 修改日期: 17 Mar 2026


热门文章

GBP/USD inches lower after registering nearly 0.75 gains in the previous session, trading around 1.3310 during the Asian hours on Tuesday.
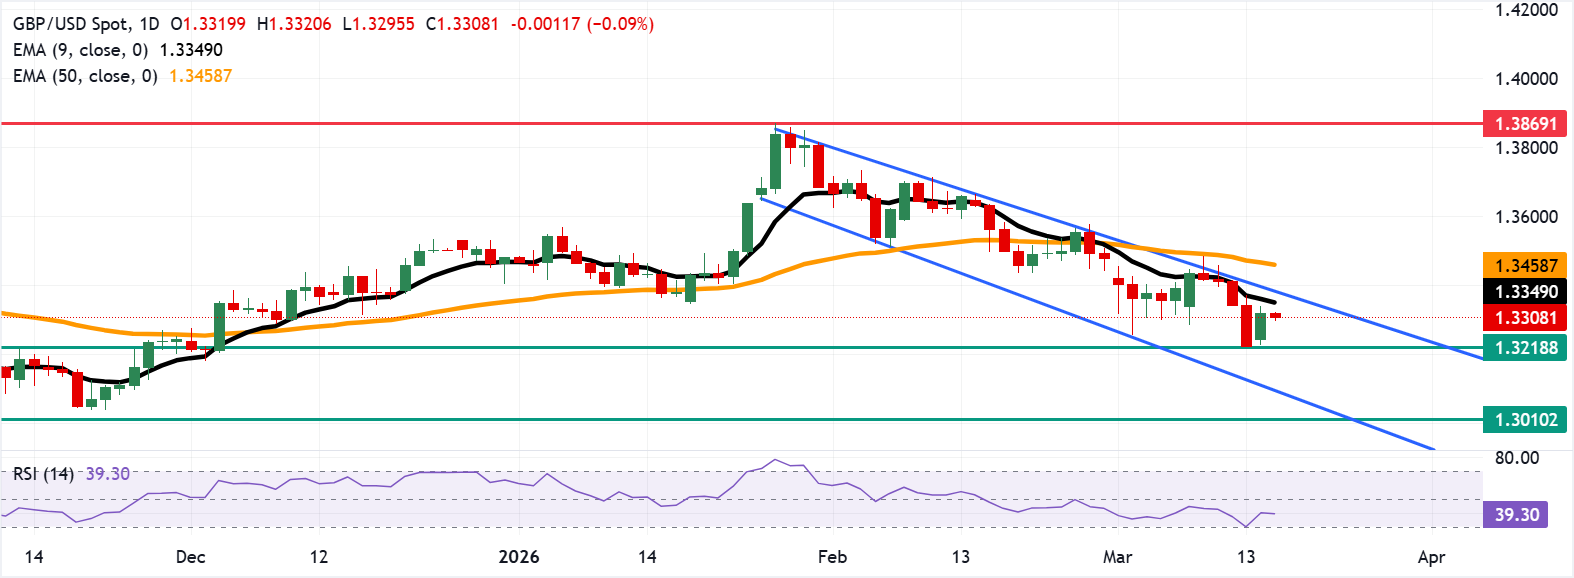
- GBP/USD may fall toward the three-month low of 1.3218.
- The 14-day RSI near 39 signals persistent selling pressure without signs of capitulation.
- The immediate resistance is seen at the nine-day EMA at 1.3349.
GBP/USD inches lower after registering nearly 0.75 gains in the previous session, trading around 1.3310 during the Asian hours on Tuesday. The short-term bias stays mildly bearish as spot holds below the declining nine-day Exponential Moving Average (EMA) and now trades under the flatter 50-day EMA, signalling fading upside momentum. The recent sequence of lower closes from the 1.36 area and failure to reclaim the short-term average confirms that rallies remain vulnerable to renewed downside interest.
Additionally, the technical analysis of the daily chart indicates a persistent bearish bias, as the pair moves downwards within the descending channel pattern. Moreover, the 14-day Relative Strength Index (RSI) sits around 39, below the 50 midline but off oversold extremes, signalling persistent selling pressure without capitulation.
The GBP/USD pair is testing the immediate support at the psychological level of 1.3300, followed by the three-month low of 1.3218, which was recorded on March 13. Further declines would open the doors for the GBP/USD pair to navigate the region around the descending channel’s lower boundary around 1.3100, followed by the 11-month low at 1.3010.
On the upside, the GBP/USD pair may find an immediate barrier at the nine-day EMA at 1.3349, followed by the upper descending channel boundary around 1.3390. A break above this confluence resistance zone would cause the emergence of the bullish bias and support the GBP/USD pair to test the 50-day EMA at 1.3458. The improved medium-term price momentum may lead the pair to explore the area around 1.3869, the highest since September 2021, reached on January 27.
(The technical analysis of this story was written with the help of an AI tool.)
Pound Sterling Price Today
The table below shows the percentage change of British Pound (GBP) against listed major currencies today. British Pound was the weakest against the Australian Dollar.
| USD | EUR | GBP | JPY | CAD | AUD | NZD | CHF | |
|---|---|---|---|---|---|---|---|---|
| USD | 0.06% | 0.08% | 0.18% | -0.01% | -0.12% | 0.20% | 0.11% | |
| EUR | -0.06% | 0.00% | 0.13% | -0.08% | -0.17% | 0.14% | 0.05% | |
| GBP | -0.08% | -0.01% | 0.11% | -0.10% | -0.20% | 0.12% | 0.03% | |
| JPY | -0.18% | -0.13% | -0.11% | -0.18% | -0.29% | 0.03% | -0.06% | |
| CAD | 0.01% | 0.08% | 0.10% | 0.18% | -0.11% | 0.22% | 0.13% | |
| AUD | 0.12% | 0.17% | 0.20% | 0.29% | 0.11% | 0.32% | 0.23% | |
| NZD | -0.20% | -0.14% | -0.12% | -0.03% | -0.22% | -0.32% | -0.09% | |
| CHF | -0.11% | -0.05% | -0.03% | 0.06% | -0.13% | -0.23% | 0.09% |
The heat map shows percentage changes of major currencies against each other. The base currency is picked from the left column, while the quote currency is picked from the top row. For example, if you pick the British Pound from the left column and move along the horizontal line to the US Dollar, the percentage change displayed in the box will represent GBP (base)/USD (quote).

超过一百万用户依赖 FXStreet 获取实时市场数据、图表工具、专家洞见和外汇新闻。其全面的经济日历和教育网络研讨会帮助交易者保持信息领先、做出审慎决策。FXStreet 拥有约 60 人的团队,分布在巴塞罗那总部及全球各地区。
阅读更多


