
GBP/USD Price Forecast: Trades below 1.3400 after pulling back from nine-day EMA
作者 Akhtar Faruqui
发布日期: 12 Mar 2026 | 修改日期: 12 Mar 2026


热门文章

GBP/USD extends its losses for the third successive session, trading around 1.3380 during the early European hours on Wednesday.
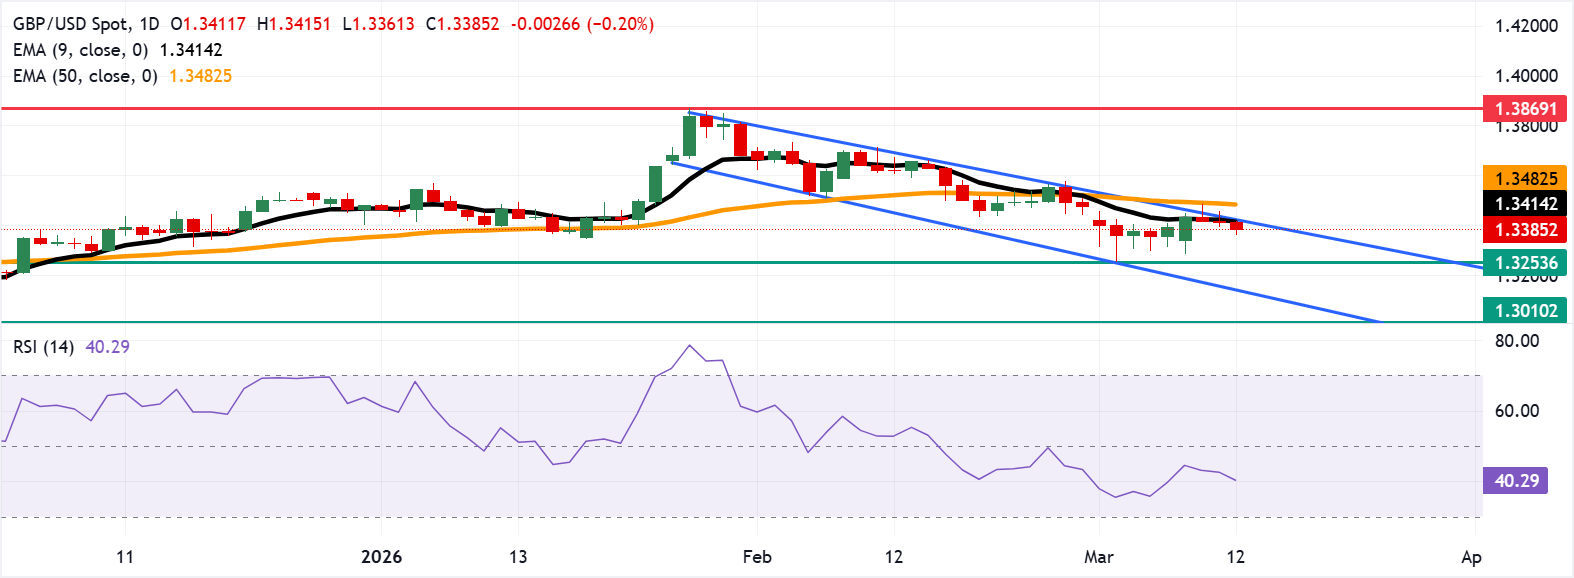
- GBP/USD may find primary support at the three-month low of 1.3253.
- The 14-day Relative Strength Index hovers just below 40, signaling persistent downside pressure.
- The immediate resistance is seen at the nine-day EMA near 1.3414.
GBP/USD extends its losses for the third successive session, trading around 1.3380 during the early European hours on Wednesday. The near-term bias stays mildly bearish as spot holds below the declining nine-day Exponential Moving Average (EMA) and now trades under the flatter 50-day EMA, signalling fading upside momentum after the rejection from the mid-1.36s.
Additionally, the technical analysis of the daily chart indicates a reinforcement of a bearish bias, as the pair pulled back from the upper boundary of the descending channel pattern. Moreover, 14-day Relative Strength Index (RSI) hovers just below the 40 mark, confirming persistent downside pressure rather than oversold conditions and keeping the focus on the recent sequence of lower daily highs.
The GBP/USD pair may explore the region downwards in terms of finding the primary support at the three-month low of 1.3253, which was recorded on December 3. Further declines would put downward pressure on the GBP/USD pair to navigate the region around the descending channel’s lower boundary around 1.3140, followed by the 11-month low at 1.3010.
On the upside, the immediate barrier lies at the nine-day EMA at 1.3414, aligned with the upper descending channel boundary. Further advances above the channel would cause the emergence of the bullish bias and support the GBP/USD pair to test the 50-day EMA at 1.3482. The improved medium-term price momentum may lead the GBP/USD pair to navigate the region around 1.3869, the highest since September 2021, reached on January 27.
(The technical analysis of this story was written with the help of an AI tool.)
Pound Sterling Price Today
The table below shows the percentage change of British Pound (GBP) against listed major currencies today. British Pound was the weakest against the Canadian Dollar.
| USD | EUR | GBP | JPY | CAD | AUD | NZD | CHF | |
|---|---|---|---|---|---|---|---|---|
| USD | 0.14% | 0.20% | 0.02% | -0.07% | 0.31% | 0.16% | 0.17% | |
| EUR | -0.14% | 0.07% | -0.18% | -0.22% | 0.17% | 0.03% | 0.03% | |
| GBP | -0.20% | -0.07% | -0.26% | -0.27% | 0.10% | -0.04% | -0.04% | |
| JPY | -0.02% | 0.18% | 0.26% | -0.03% | 0.35% | 0.19% | 0.18% | |
| CAD | 0.07% | 0.22% | 0.27% | 0.03% | 0.38% | 0.23% | 0.21% | |
| AUD | -0.31% | -0.17% | -0.10% | -0.35% | -0.38% | -0.14% | -0.14% | |
| NZD | -0.16% | -0.03% | 0.04% | -0.19% | -0.23% | 0.14% | -0.02% | |
| CHF | -0.17% | -0.03% | 0.04% | -0.18% | -0.21% | 0.14% | 0.02% |
The heat map shows percentage changes of major currencies against each other. The base currency is picked from the left column, while the quote currency is picked from the top row. For example, if you pick the British Pound from the left column and move along the horizontal line to the US Dollar, the percentage change displayed in the box will represent GBP (base)/USD (quote).

超过一百万用户依赖 FXStreet 获取实时市场数据、图表工具、专家洞见和外汇新闻。其全面的经济日历和教育网络研讨会帮助交易者保持信息领先、做出审慎决策。FXStreet 拥有约 60 人的团队,分布在巴塞罗那总部及全球各地区。
阅读更多


