
Grass Price Forecast: GRASS 20% bullish breakout defies broader market weakness
作者 John Isige
更新: 2 Mar 2026


热门文章

Grass (GRASS) is edging up above $0.30 at the time of writing on Monday. The token’s notable 20% intraday surge stands out amid heightened volatility in the broader crypto market.
- Grass rallies 20% intraday despite macro headwinds amid the US-Iran war.
- The price increase reclaims the 100-day EMA as support as bulls eye an extension of the breakout toward $0.40.
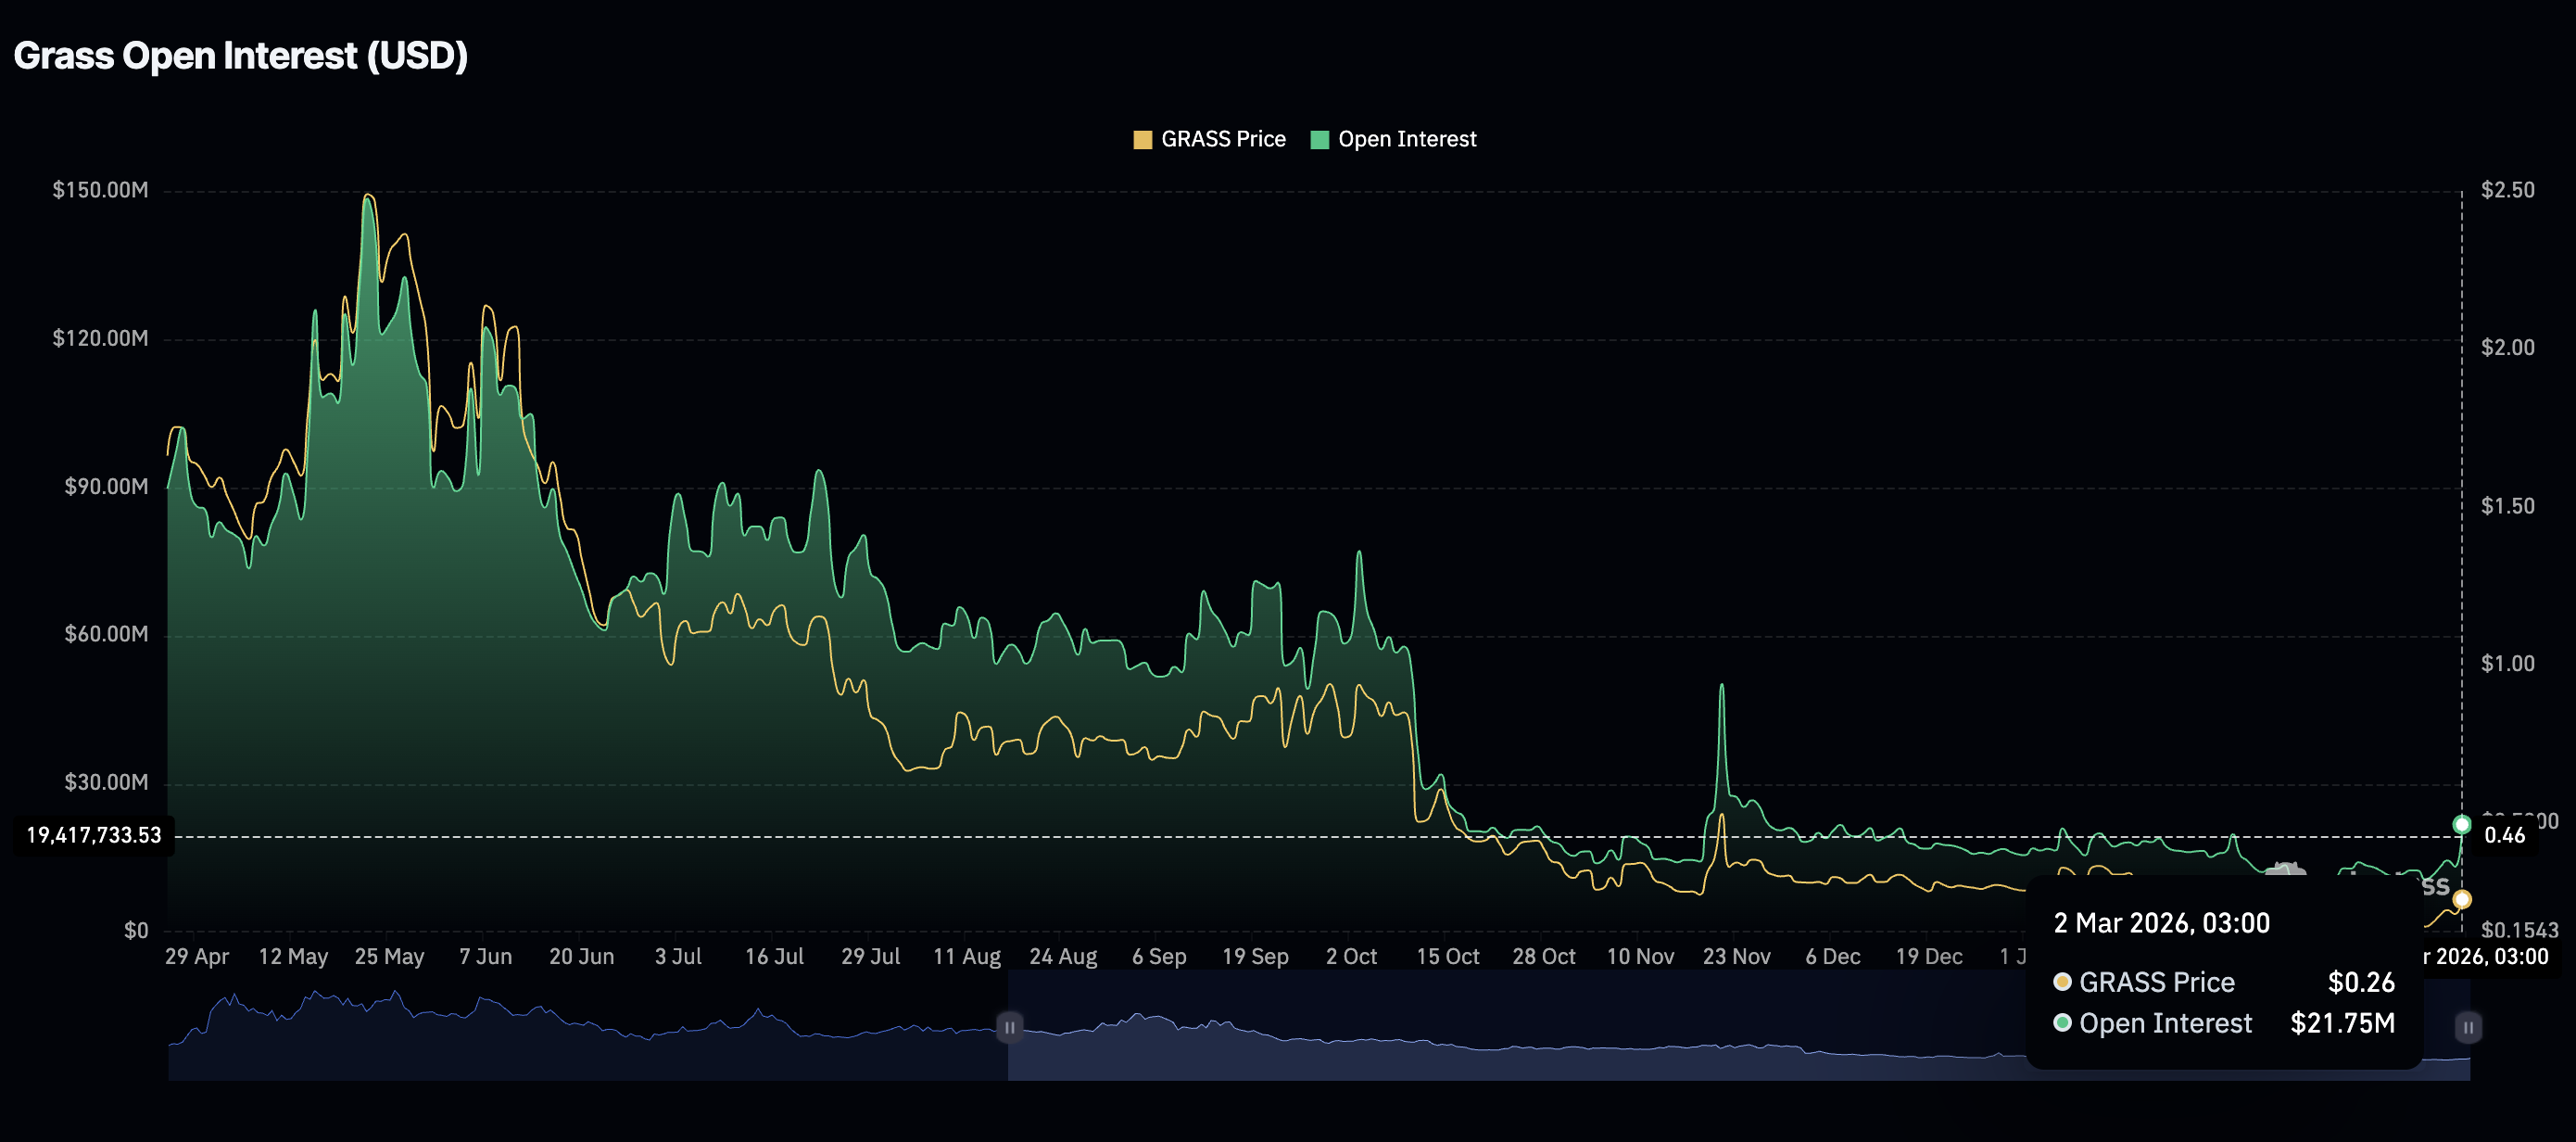
- Retail interest in Grass returns, with futures Open Interest reaching $22 million.
Grass (GRASS) is edging up above $0.30 at the time of writing on Monday. The token’s notable 20% intraday surge stands out amid heightened volatility in the broader crypto market.
Although crypto prices have not collapsed, risk appetite has taken a back seat amid the escalating war between the United States (US) and Iran. The larger Middle East region is caught up in the conflict as Iran doubles down on countries hosting US military bases.
Meanwhile, the Grass price has been rising, reflecting growing sentiment toward smaller altcoins. Retail demand for Grass has soared in the past few days, confirming a potential bullish shift.
Renewed retail demand fuels Grass rally
Despite the prevailing risk-off sentiment across the broader cryptocurrency market, GRASS has attracted renewed interest from retail investors. The derivatives market’s Open Interest, tracking the notional value of outstanding futures contracts, increased to nearly $22 million on Monday from $13.2 million the previous day.
In contrast, the OI had faded to approximately $10.63 million last Tuesday. The same OI peaked at $148 million in May, when Grass traded around $2.60, underscoring the role of retail investors.
Technical outlook: Grass upholds bullish outlook
Grass is largely in bullish hands, sitting above the 50-day Exponential Moving Average (EMA) at $0.24 and the 100-day EMA at $0.30. The Relative Strength Index (RSI) is rising to 70 on the daily chart, indicating a steady bullish momentum.
At the same time, the Moving Average Convergence Divergence (MACD) indicator remains above its signal line, as the green histogram bars expand, affirming the bullish thesis. A further increase in the MACD line above the zero line would prompt traders to increase exposure, adding to buying pressure and increasing the odds of an extended breakout toward the next key hurdle at $0.40, and then the 200-day EMA at $0.51.
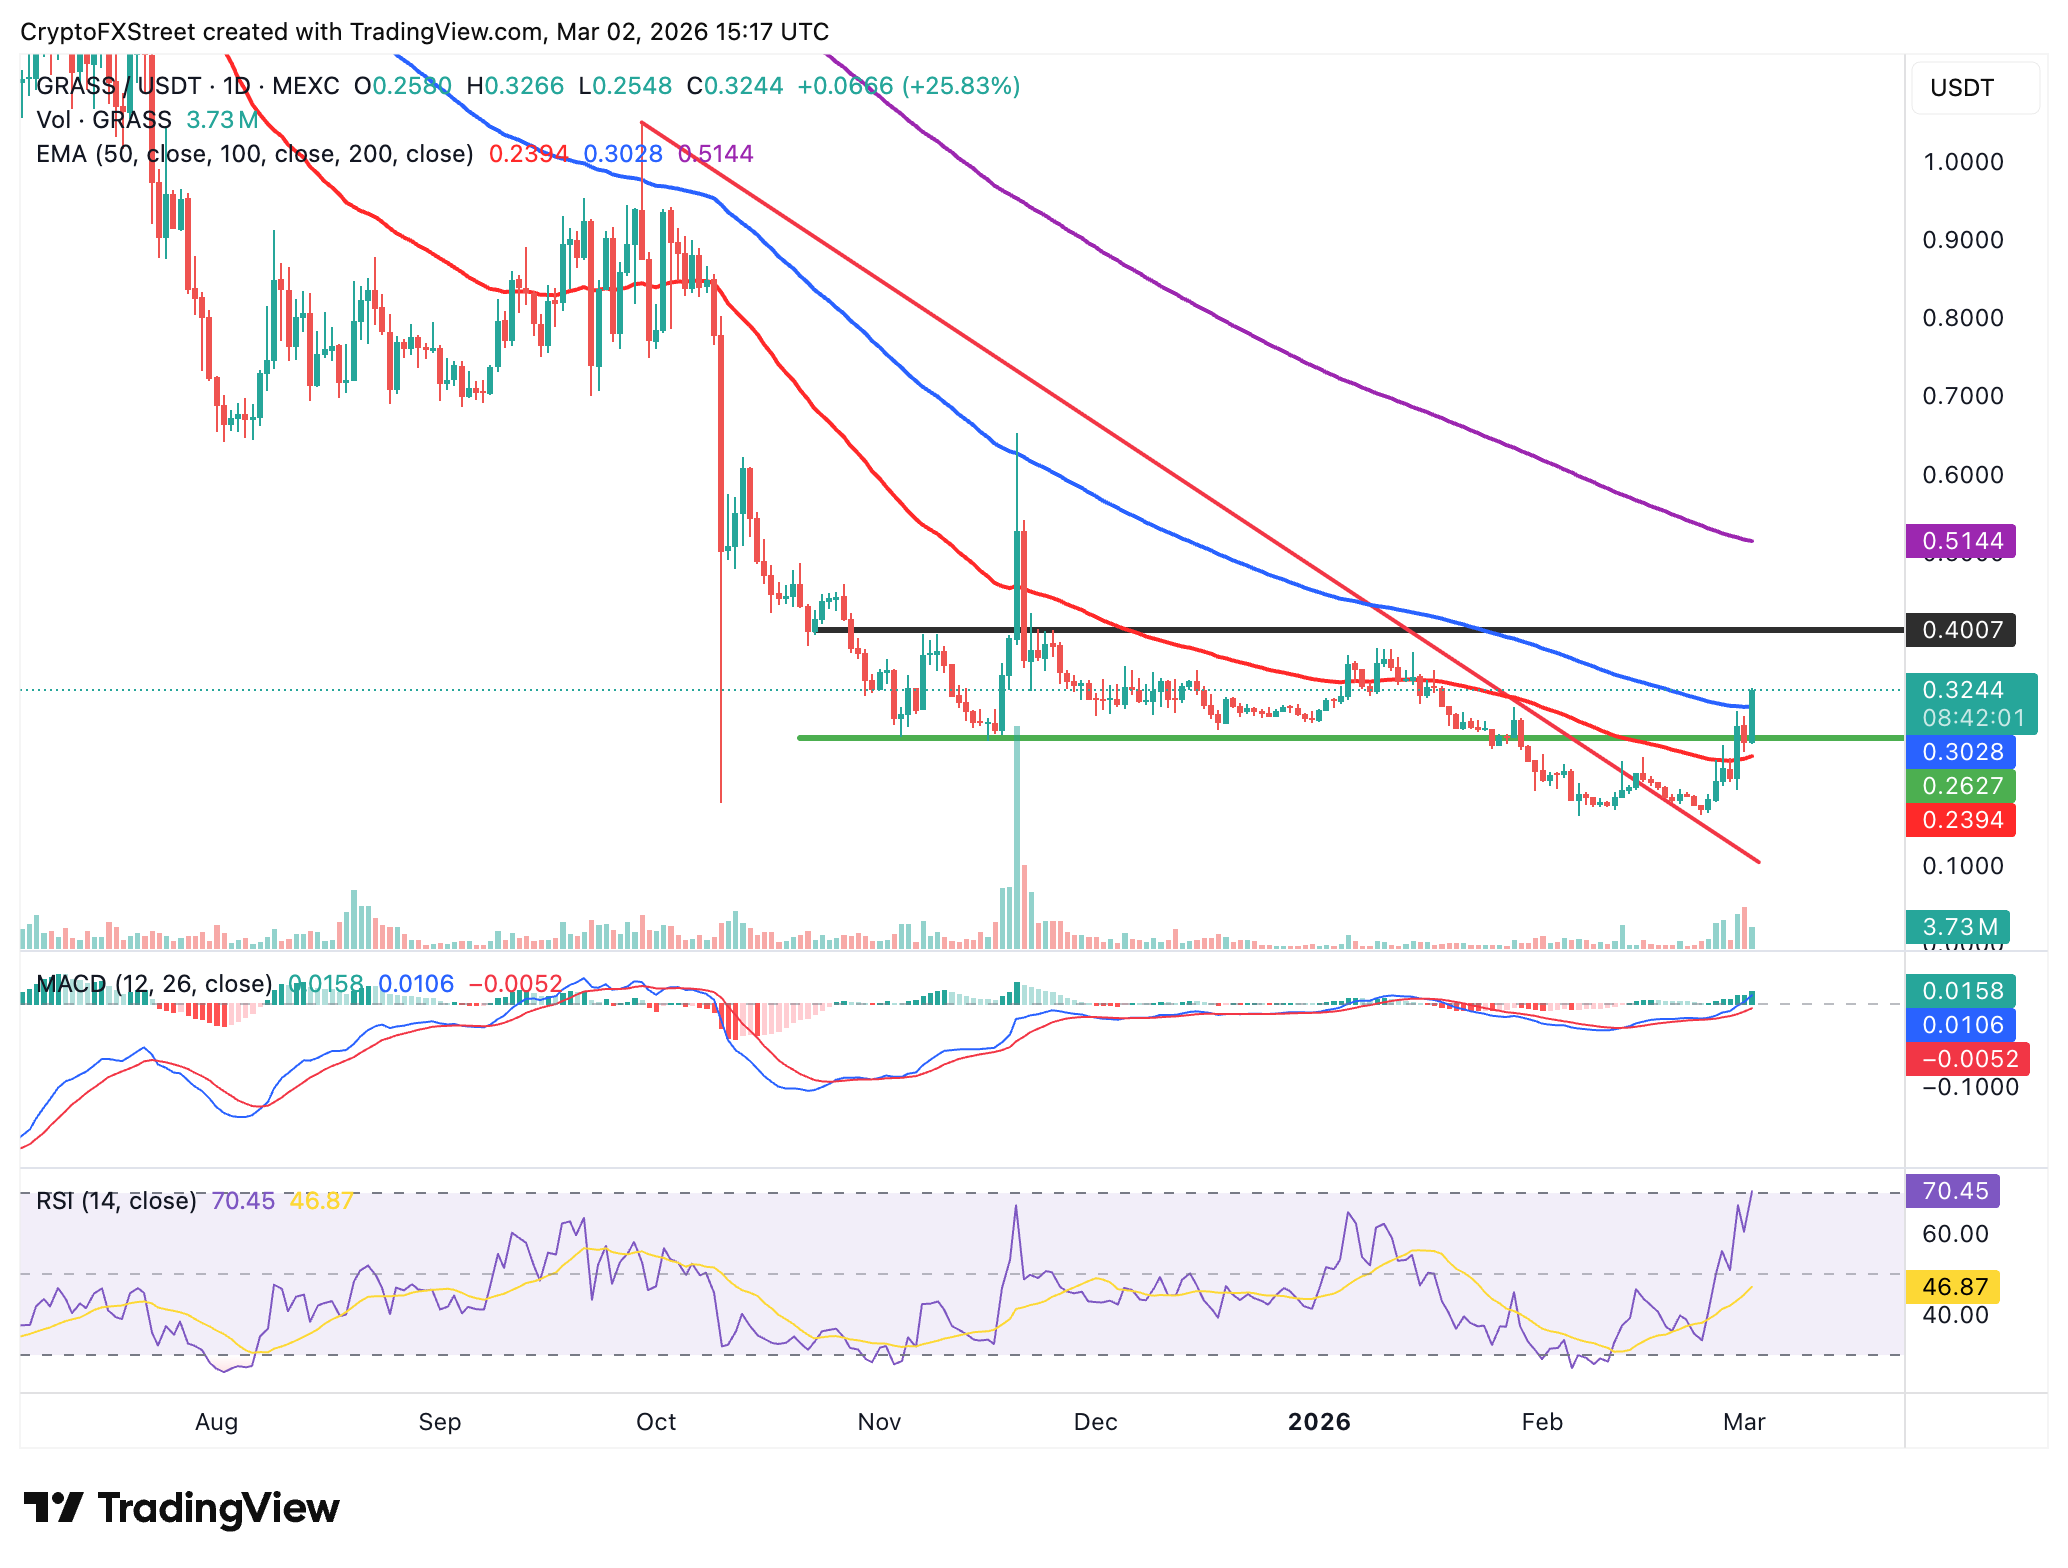
Still, the 100-day EMA at $0.30 is required to hold as immediate support, keeping Grass from correcting toward the 50-day EMA at $0.24. The US-Iran war remains a major concern, as geopolitical conflicts rarely favour risk assets.
Open Interest, funding rate FAQs
Higher Open Interest is associated with higher liquidity and new capital inflow to the market. This is considered the equivalent of increase in efficiency and the ongoing trend continues. When Open Interest decreases, it is considered a sign of liquidation in the market, investors are leaving and the overall demand for an asset is on a decline, fueling a bearish sentiment among investors.
Funding fees bridge the difference between spot prices and prices of futures contracts of an asset by increasing liquidation risks faced by traders. A consistently high and positive funding rate implies there is a bullish sentiment among market participants and there is an expectation of a price hike. A consistently negative funding rate for an asset implies a bearish sentiment, indicating that traders expect the cryptocurrency’s price to fall and a bearish trend reversal is likely to occur.

超过一百万用户依赖 FXStreet 获取实时市场数据、图表工具、专家洞见和外汇新闻。其全面的经济日历和教育网络研讨会帮助交易者保持信息领先、做出审慎决策。FXStreet 拥有约 60 人的团队,分布在巴塞罗那总部及全球各地区。
阅读更多


