
Hyperliquid Price Forecast: Trendline break and bearish signals point to deeper correction
作者 Manish Chhetri
更新: 14 May 2026


热门文章

Hyperliquid (HYPE) extends its correction, trading below $39 at the time of writing on Thursday after closing below the rising trendline earlier this week. Mixed signals from the derivatives markets put a lid on HYPE’s recovery.
- Hyperliquid price extends its correction on Thursday after closing below the rising trendline earlier this week.
- Mixed derivatives signals among traders cap HYPE recovery.
- The technical outlook suggests a deeper correction, targeting levels below $37.
Hyperliquid (HYPE) extends its correction, trading below $39 at the time of writing on Thursday after closing below the rising trendline earlier this week. Mixed signals from the derivatives markets put a lid on HYPE’s recovery. On the technical side, bearish momentum strengthens with bears aiming for levels below $37.
Mixed sentiment keeps bulls cautious
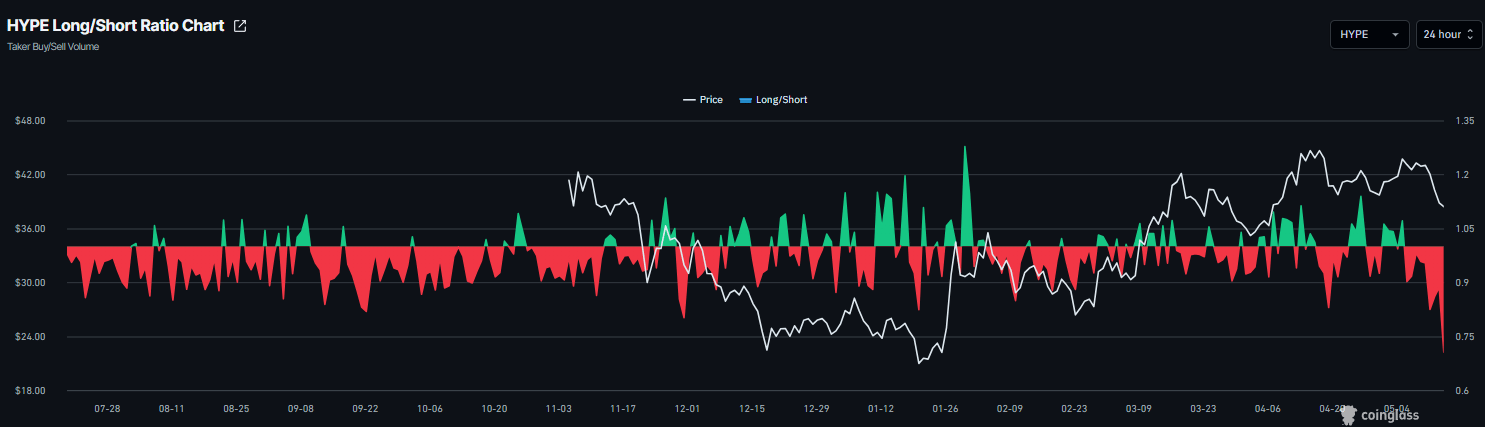
Hyperliquid’s derivatives data shows mixed signals, keeping the bulls cautious. CoinGlass’ long-to-short ratio for HYPE reads 0.70 on Thursday, the lowest level over a month. This ratio, being below one, reflects bearish sentiment in the market, as more traders are betting on the asset’s price to fall.
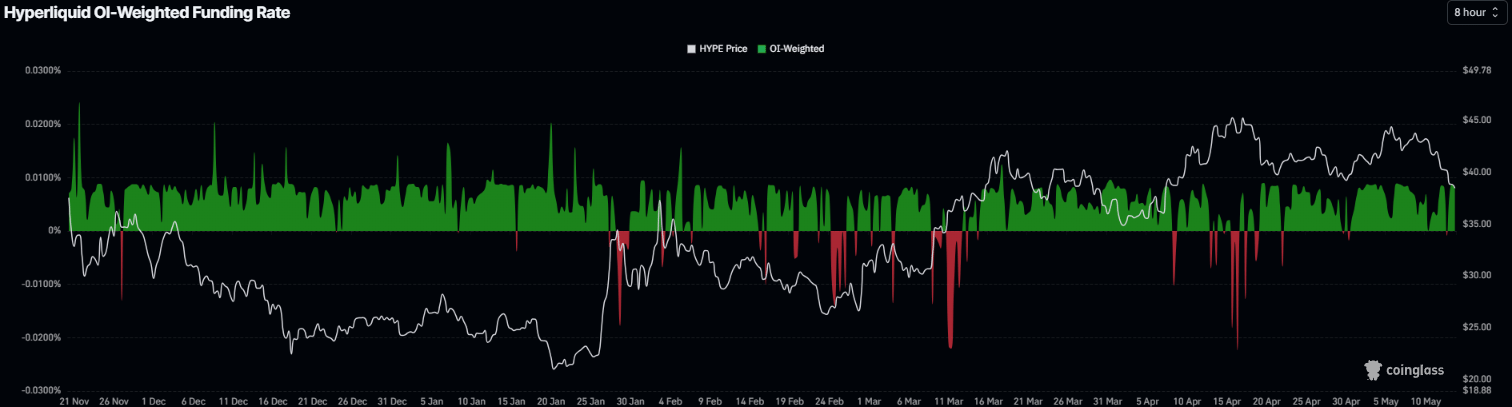
Meanwhile, the funding rates support improving sentiment. CoinGlass’ OI-Weighted Funding Rate data for HYPE flipped positive on Wednesday and reads 0.0078% on Thursday. This positive rate indicates that longs are paying shorts and projecting a bullish sentiment.
This combination of derivatives metrics suggests indecision among HYPE investors and a lack of clear directional bias, which limits the likelihood of a sustained recovery.
Hyperliquid Price Forecast: HYPE bears are in control of the momentum
Hyperliquid price broke and closed below the rising trendline (drawn by connecting multiple highs since the end of January) on Tuesday and corrected by over 7% through the next day. At the time of writing on Thursday, HYPE is extending the correction, trading below $39.
If HYPE continues its pullback and closes below the 200-day Exponential Moving Average (EMA) at $37.88, it could extend the losses toward the 200-day EMA at $36.09.
Momentum indicators also show a bearish outlook. The Relative Strength Index (RSI) on the daily chart reads 37, slipping below the neutral level, and the Moving Average Convergence Divergence (MACD) indicators on the same chart showed a bearish crossover on Monday, projecting a negative outlook.
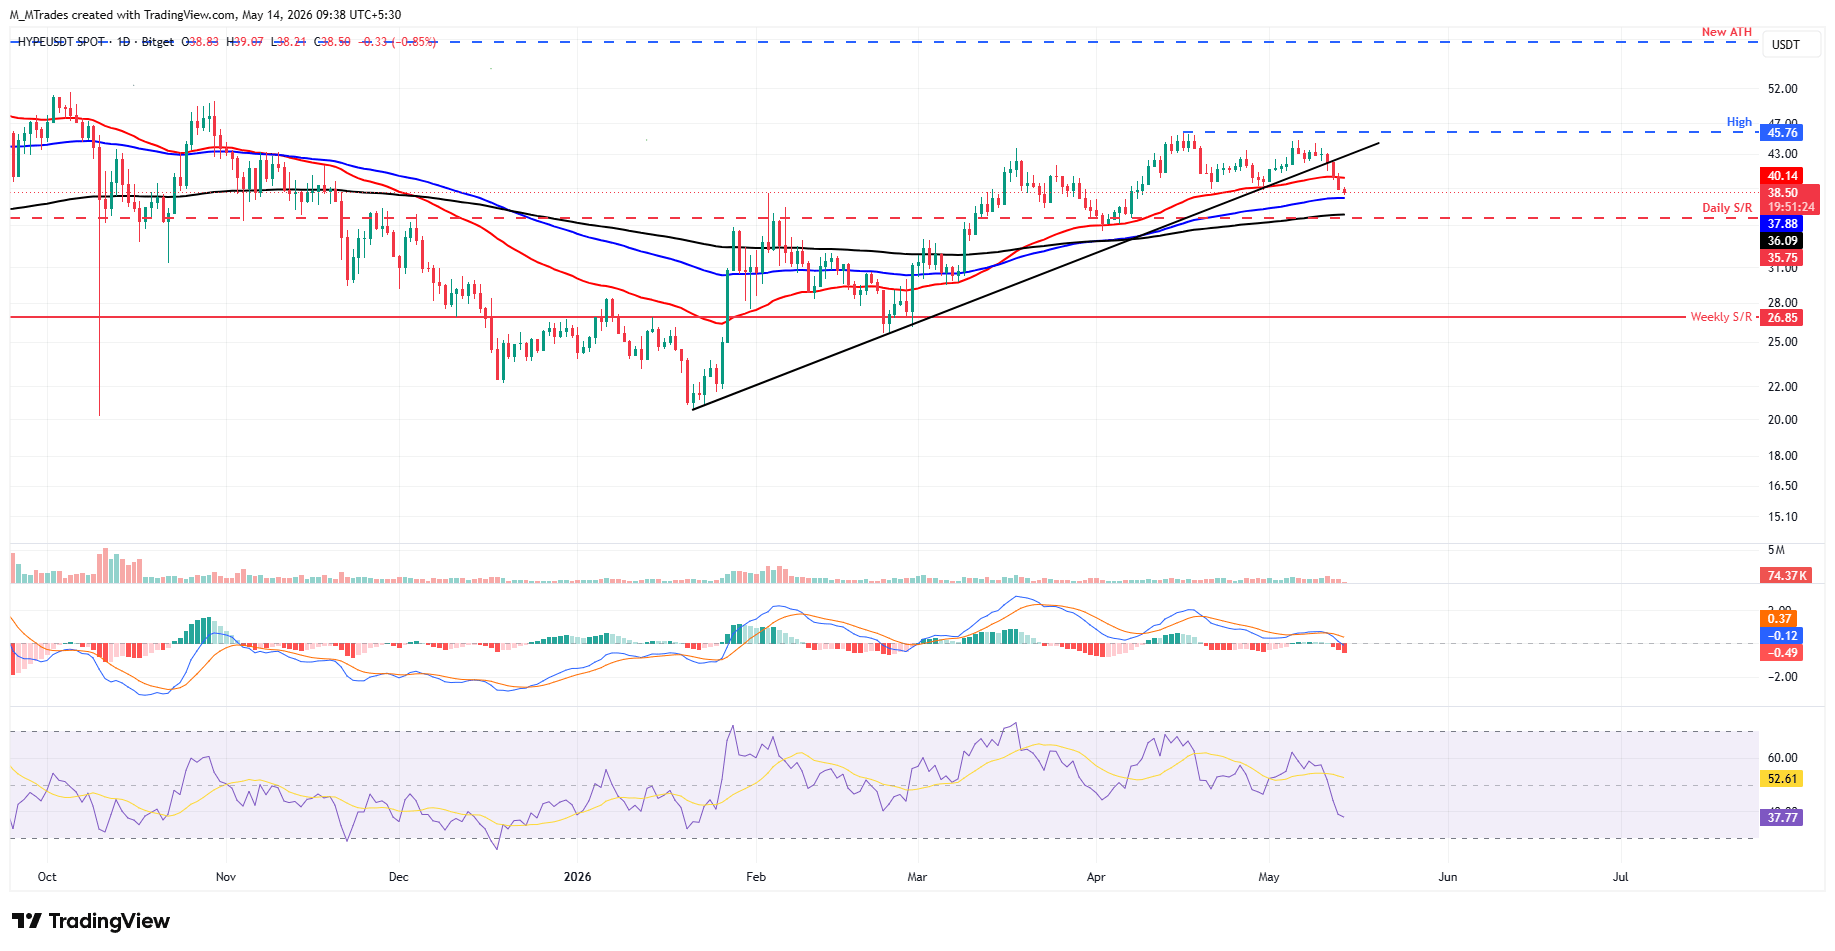
If Hyperliquid recovers, it could extend the advance toward the 50-day EMA at $40.11.

超过一百万用户依赖 FXStreet 获取实时市场数据、图表工具、专家洞见和外汇新闻。其全面的经济日历和教育网络研讨会帮助交易者保持信息领先、做出审慎决策。FXStreet 拥有约 60 人的团队,分布在巴塞罗那总部及全球各地区。
阅读更多


