
Litecoin Price Analysis: LTC holds key support, recovery prospects emerge
作者 Manish Chhetri
发布日期: 26 Jan 2026 | 修改日期: 26 Jan 2026


热门文章

Litecoin (LTC) price recovers slightly, trading above $68 at the time of writing on Monday, after finding support around the lower boundary of the falling wedge pattern. Improving on-chain and derivatives signals suggest a potential recovery in LTC if buyers continue to defend the key support zone.
- Litecoin price hovers around $68 on Monday, finding support near the lower trendline of a falling wedge pattern.
- On-chain and derivatives data lean constructive, with large whale buy orders, buy-side dominance and positive funding rates supporting a recovery scenario.
- Technical outlook suggests a potential rebound if the lower trendline continues to hold as support.
Litecoin (LTC) price recovers slightly, trading above $68 at the time of writing on Monday, after finding support around the lower boundary of the falling wedge pattern. Improving on-chain and derivatives signals suggest a potential recovery in LTC if buyers continue to defend the key support zone.
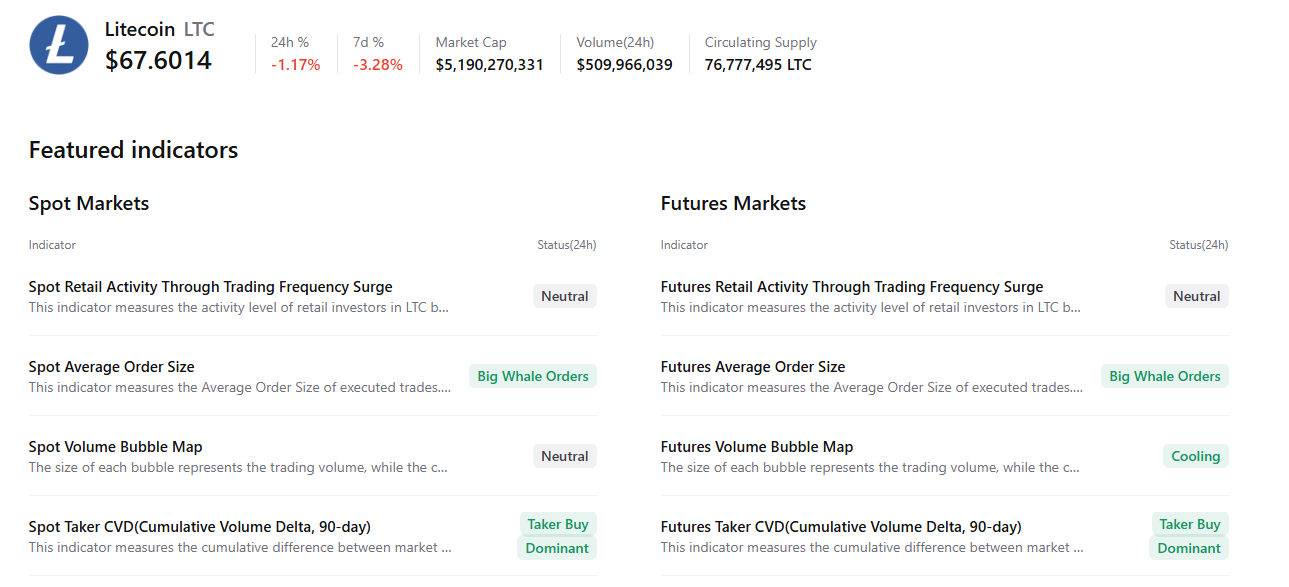
Litecoin’s on-chain and derivatives support a potential recovery
CryptoQuant’s summary chart below supports a positive outlook, as Litecoin’s spot and futures markets show large whale orders and buy-side dominance. In addition, the futures market signals cooling conditions, and all these factors support a potential recovery ahead.
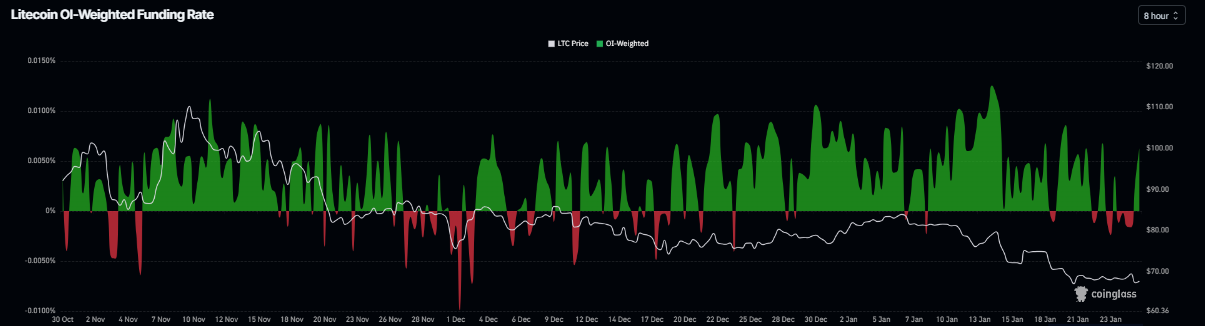
CoinGlass’s OI-Weighted Funding Rate data shows that the number of traders betting that the price of Litecoin will slide further is lower than that anticipating a price increase.
The metric has flipped a positive rate on Sunday and currently reads 0.0063%, indicating that longs are paying shorts. Generally, when funding rates flip from negative to positive, Litecoin has recovered.
Litecoin Price Forecast: LTC could recover if the key support holds
Litecoin price was rejected from the 50-day Exponential Moving Average (EMA) at $77.39 on January 14 and declined nearly 18% in the next 10 days, retesting the April 9 low of $66.51 last week. LTC price has been consolidating around the lower boundary of the falling wedge pattern (drawn by connecting multiple highs and lows since mid-October) over the last four days. As of Monday, it trades around $68.14.
If the lower trendline holds as support, LTC could extend its recovery toward the weekly resistance at $77.19, which coincides with the 50-day EMA at $77.39.
The Relative Strength Index (RSI) on the daily chart is 34, pointing upward after reaching its oversold conditions, indicating weak but fading bearish momentum and early signs of recovery. For the recovery rally to be sustained, the RSI must move above the neutral 50 level. In addition, the Moving Average Convergence Divergence (MACD) lines are converging, with fading red histogram levels below the zero line, further supporting the potential recovery thesis.
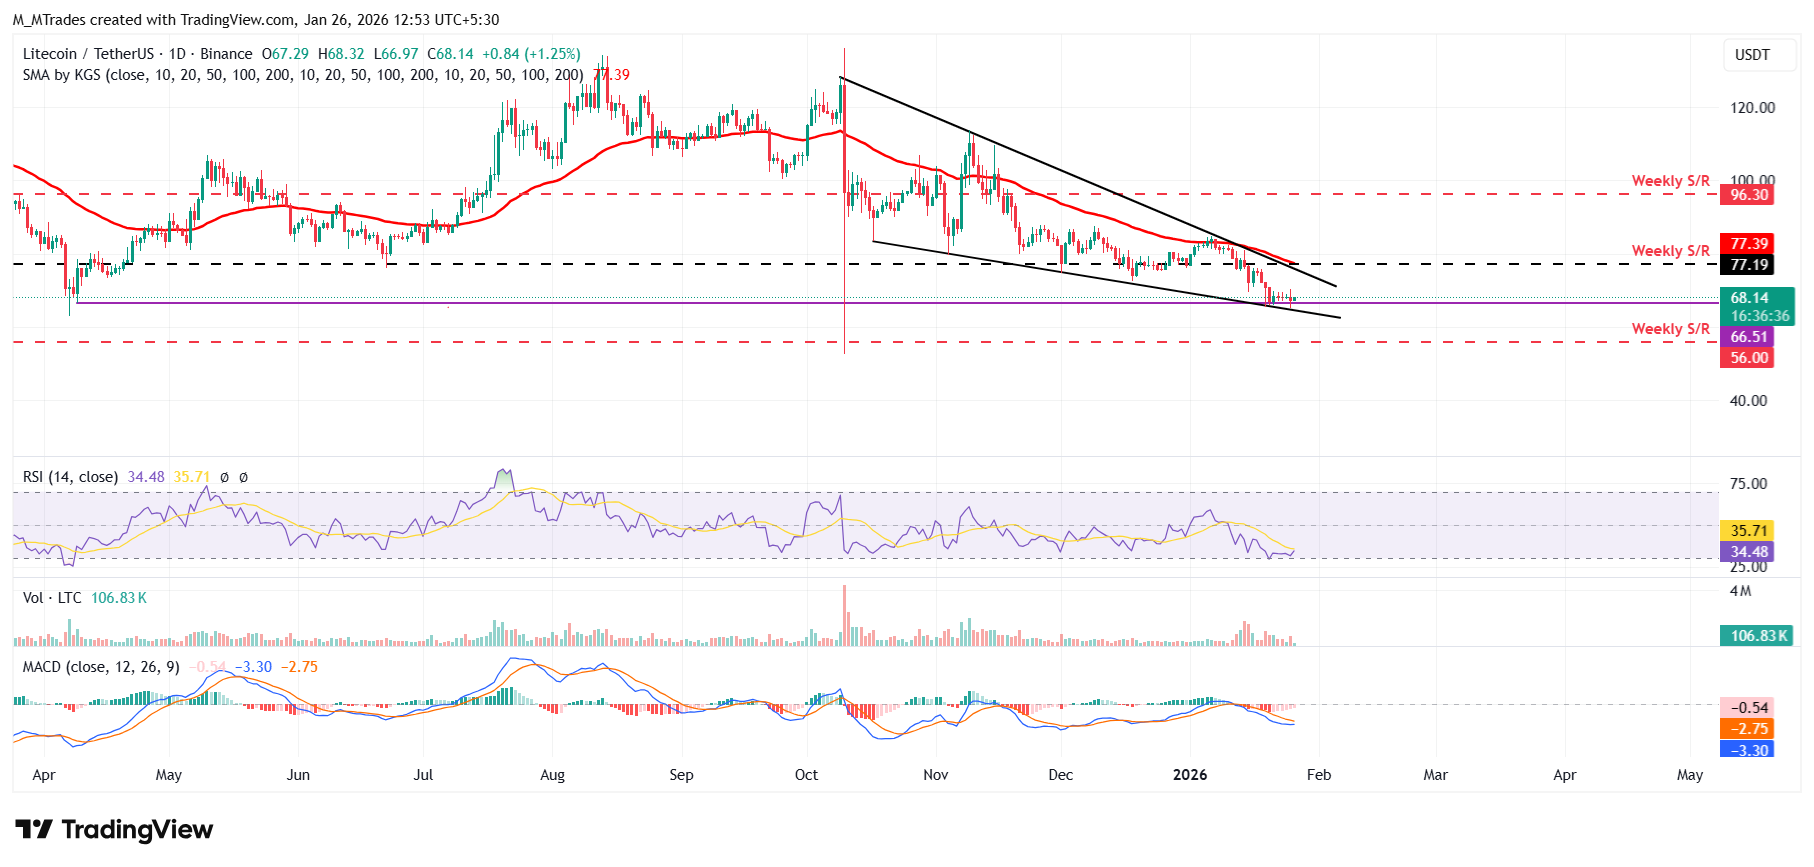
However, if LTC faces a correction, it could extend the decline toward the next weekly support at $56.

超过一百万用户依赖 FXStreet 获取实时市场数据、图表工具、专家洞见和外汇新闻。其全面的经济日历和教育网络研讨会帮助交易者保持信息领先、做出审慎决策。FXStreet 拥有约 60 人的团队,分布在巴塞罗那总部及全球各地区。
阅读更多


