
Meme Coins Price Prediction: DOGE surges, Shiba Inu, Pepe await breakout signals
作者 Manish Chhetri
更新: 30 Apr 2026


热门文章

Dogecoin (DOGE) extends its upward momentum on Thursday, trading above $0.106 and leading gains among major meme coins. Meanwhile, Shiba Inu (SHIB) and Pepe (PEPE) remain range-bound, signaling a pause in momentum as both meme coins consolidate near key resistance levels.
- Dogecoin is trading above $0.106 on Thursday, up 6.5% so far this week.
- Shiba Inu is near the upper boundary of its consolidation at $0.0000063, a breakout suggests a rally ahead.
- Pepe price hovers between the 50-day and 100-day EMAs, signaling indecision among traders.
Dogecoin (DOGE) extends its upward momentum on Thursday, trading above $0.106 and leading gains among major meme coins. Meanwhile, Shiba Inu (SHIB) and Pepe (PEPE) remain range-bound, signaling a pause in momentum as both meme coins consolidate near key resistance levels. A firm close above these key resistance zones could trigger the next leg of upside for these meme coins.
Dogecoin takes the lead
Dogecoin's price is extending its gains, trading above $0.106 on Wednesday and surpassing the key 100-day Exponential Moving Average (EMA) at $0.104.
If DOGE continues its upward momentum and closes above 38.20% Fibonacci retracement level at $0.109 on a daily basis, it could extend the gains toward the weekly resistance at $0.119.
The Relative Strength Index (RSI) on the daily chart is 71, above the overbought threshold and pointing upward, indicating strong bullish momentum. Moreover, the Moving Average Convergence Divergence (MACD) indicator on the same chart shows rising green histogram bars, supporting the positive outlook.
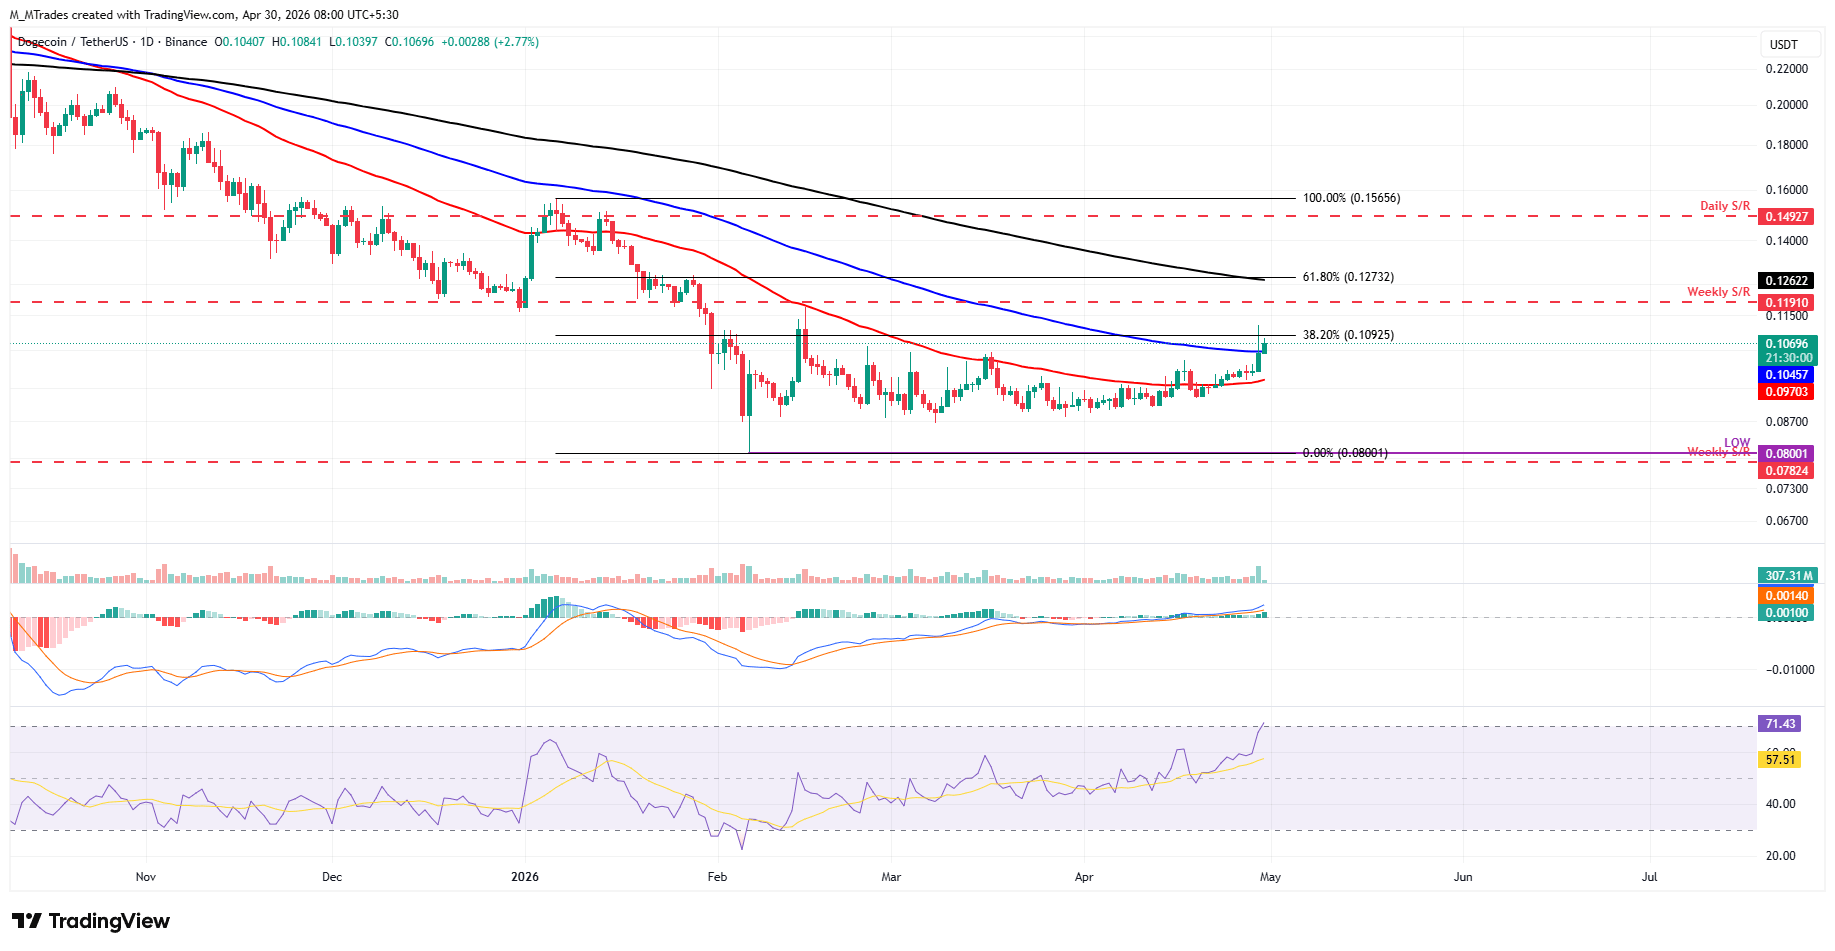
However, if DOGE faces a correction, it could extend the decline toward the 50-day EMA at $0.097.
Shiba Inu could extend gains if it closes above the upper consolidation boundary
Shiba Inu price surged sharply on Wednesday but was rejected from the 100-day EMA at $0.0000064, closing the day with mild gains. As of writing on Thursday, SHIB is approaching the upper consolidation boundary at $0.0000064, where a break above suggests a bullish move.
If SHIB closes above this upper boundary on a daily basis, it could extend the rally toward the 100-day EMA at $0.0000064. A firm close above this level could extend gains toward the weekly resistance at $0.0000068.
The RSI on the daily chart reads 56, above the neutral level of 50 and below the overbought threshold, indicating bullish momentum. Moreover, the MACD indicator on the same chart shows green histogram bars, supporting the positive outlook.
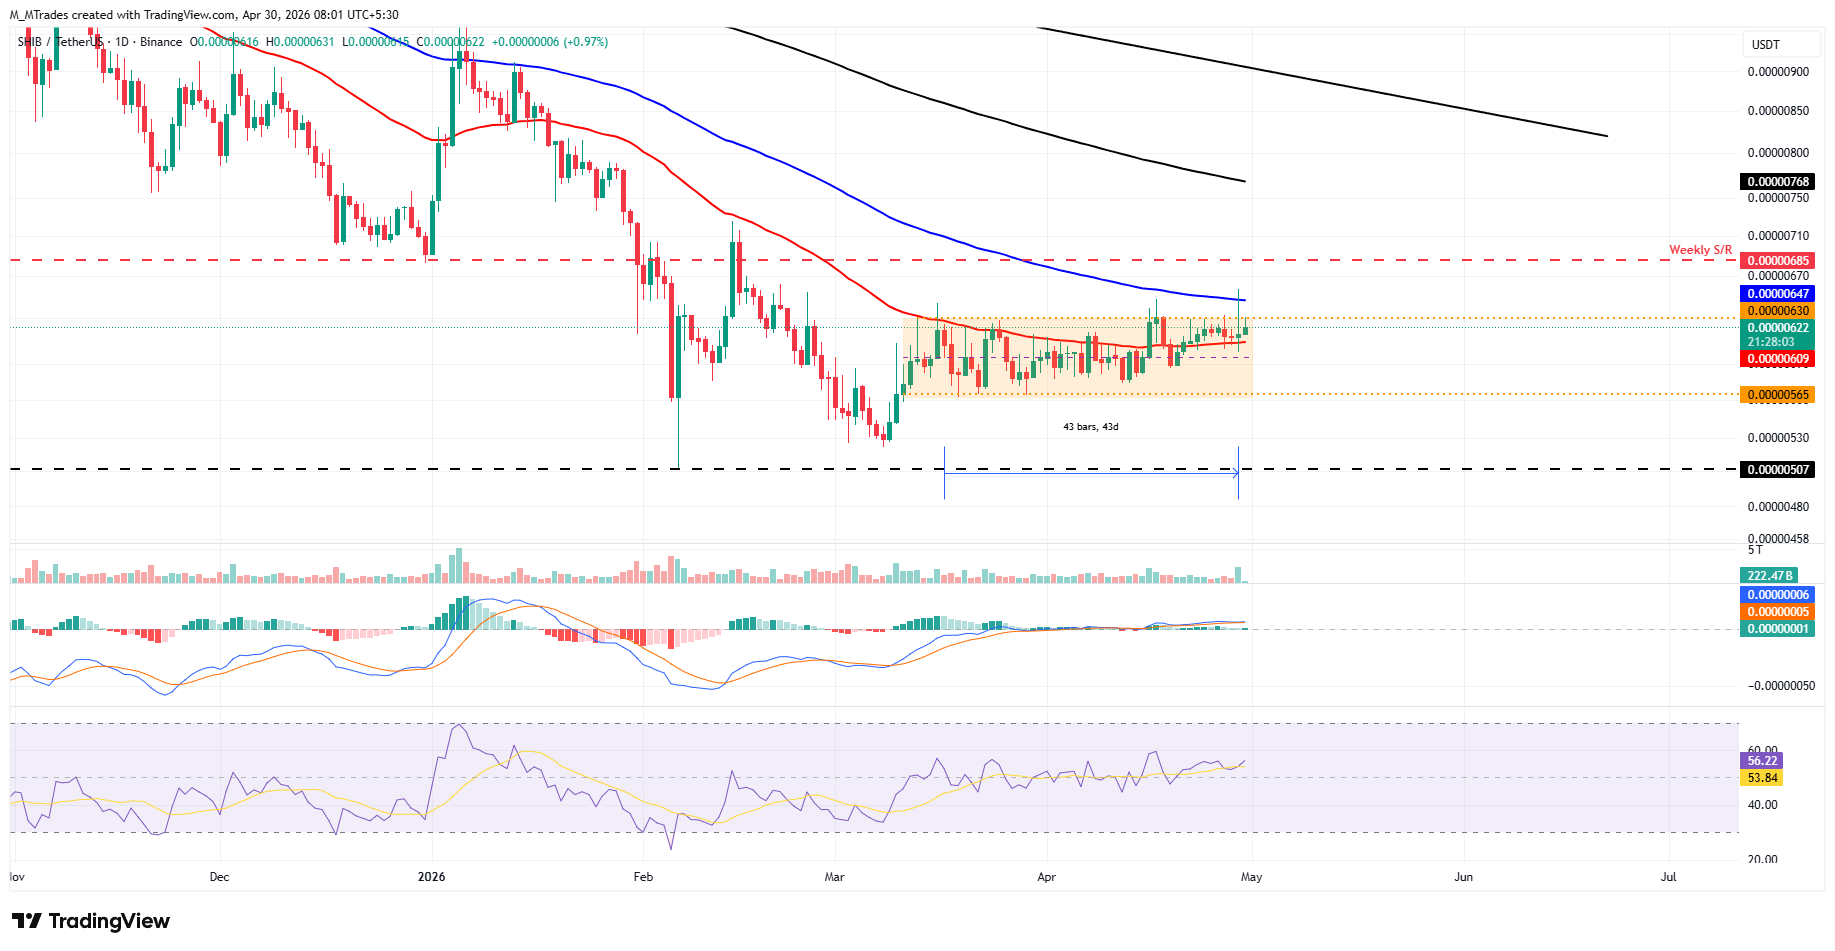
If SHIB faces rejection and corrects, it could extend the decline toward the lower channel range at $0.0000056.
Pepe trades sideways between 50-day and 100-day EMAs
Pepe price has been trading between the 50-day and 100-day EMAs at $0.0000037 and $0.0000040 since last week. As of writing on Thursday, PEPE is hovering at $0.0000038.
If PEPE closes above the 100-day EMA at $0.0000040 on a daily basis, it could extend the rally toward the 200-day EMA at $0.0000050, which roughly coincides with the daily resistance.
The RSI on the daily chart is 54, above the neutral 50 level, indicating mild bullish strength. Moreover, the MACD indicator is converging, indicating indecision among the traders.
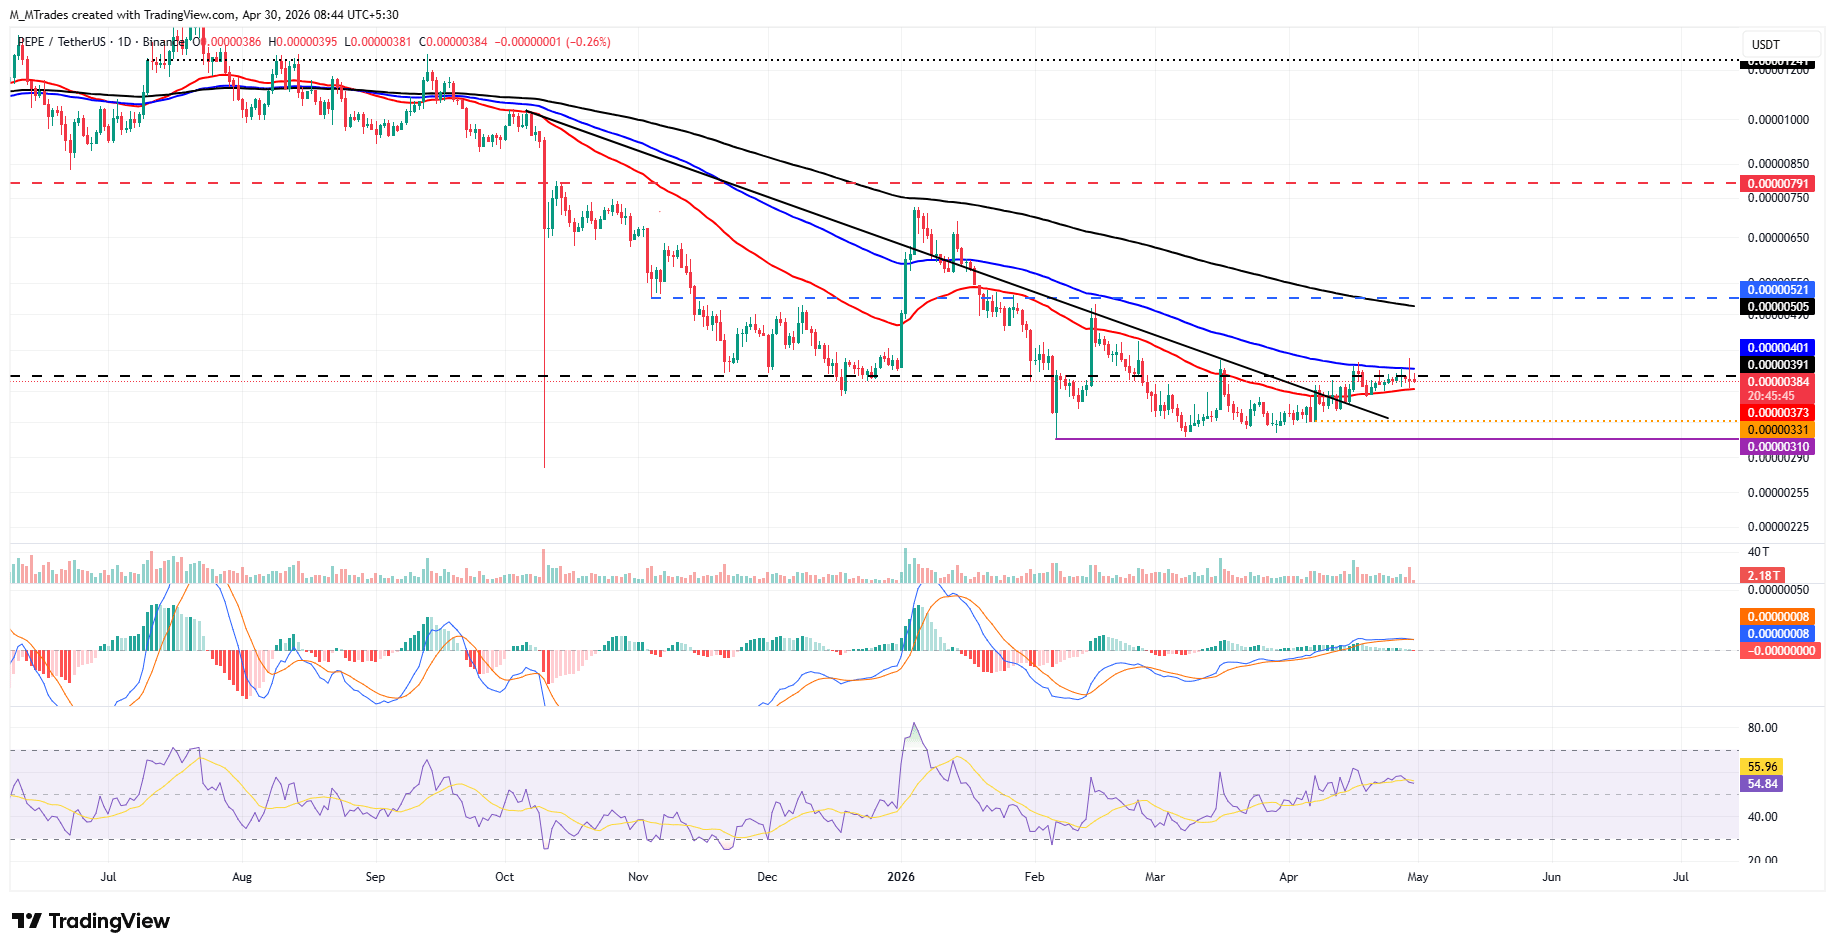
On the other hand, if PEPE pulls back and closes below the 50-day EMA at $0.0000037, it could extend the decline toward the April 7 low at $0.0000033.

超过一百万用户依赖 FXStreet 获取实时市场数据、图表工具、专家洞见和外汇新闻。其全面的经济日历和教育网络研讨会帮助交易者保持信息领先、做出审慎决策。FXStreet 拥有约 60 人的团队,分布在巴塞罗那总部及全球各地区。
阅读更多


