
NZD/USD Price Forecast: RSI flashes oversold as the pair hovers near seven-month lows
作者 Vishal Chaturvedi
更新: 25 Jun 2026


热门文章

NZD/USD pauses a six-day losing streak on Thursday as the US Dollar (USD) eases following the latest US Personal Consumption Expenditures (PCE) data, which broadly matched market expectations. At the time of writing, the pair trades around 0.5650, virtually unchanged near seven-month lows.
- NZD/USD steadies after a six-day slide as the US Dollar eases following US PCE data.
- US core PCE broadly meets expectations, prompting traders to trim September Fed rate-hike bets.
- Technical indicators continue to favor sellers, with NZD/USD pinned near seven-month lows below key moving averages.
NZD/USD pauses a six-day losing streak on Thursday as the US Dollar (USD) eases following the latest US Personal Consumption Expenditures (PCE) data, which broadly matched market expectations. At the time of writing, the pair trades around 0.5650, virtually unchanged near seven-month lows.
Data from the US Bureau of Economic Analysis showed that the Core Personal Consumption Expenditures (PCE) Price Index rose to 3.4% YoY in May from 3.3% in April. On a monthly basis, Core PCE held steady at 0.3%. Meanwhile, headline PCE accelerated to 4.1% YoY from 3.8%, marking its highest annual reading since April 2023.
Following the data release, the US Dollar edged lower as the modest rise in core PCE and the unchanged monthly reading prompted traders to scale back expectations for a September Fed rate hike. According to the CME FedWatch Tool, the probability of a rate increase fell to 60% from 67% before the inflation report.
The US Dollar Index (DXY), which tracks the Greenback against a basket of six major currencies, trades around 101.40 after climbing to a more than one-year high near 101.80 on Wednesday.
Technical Analysis:
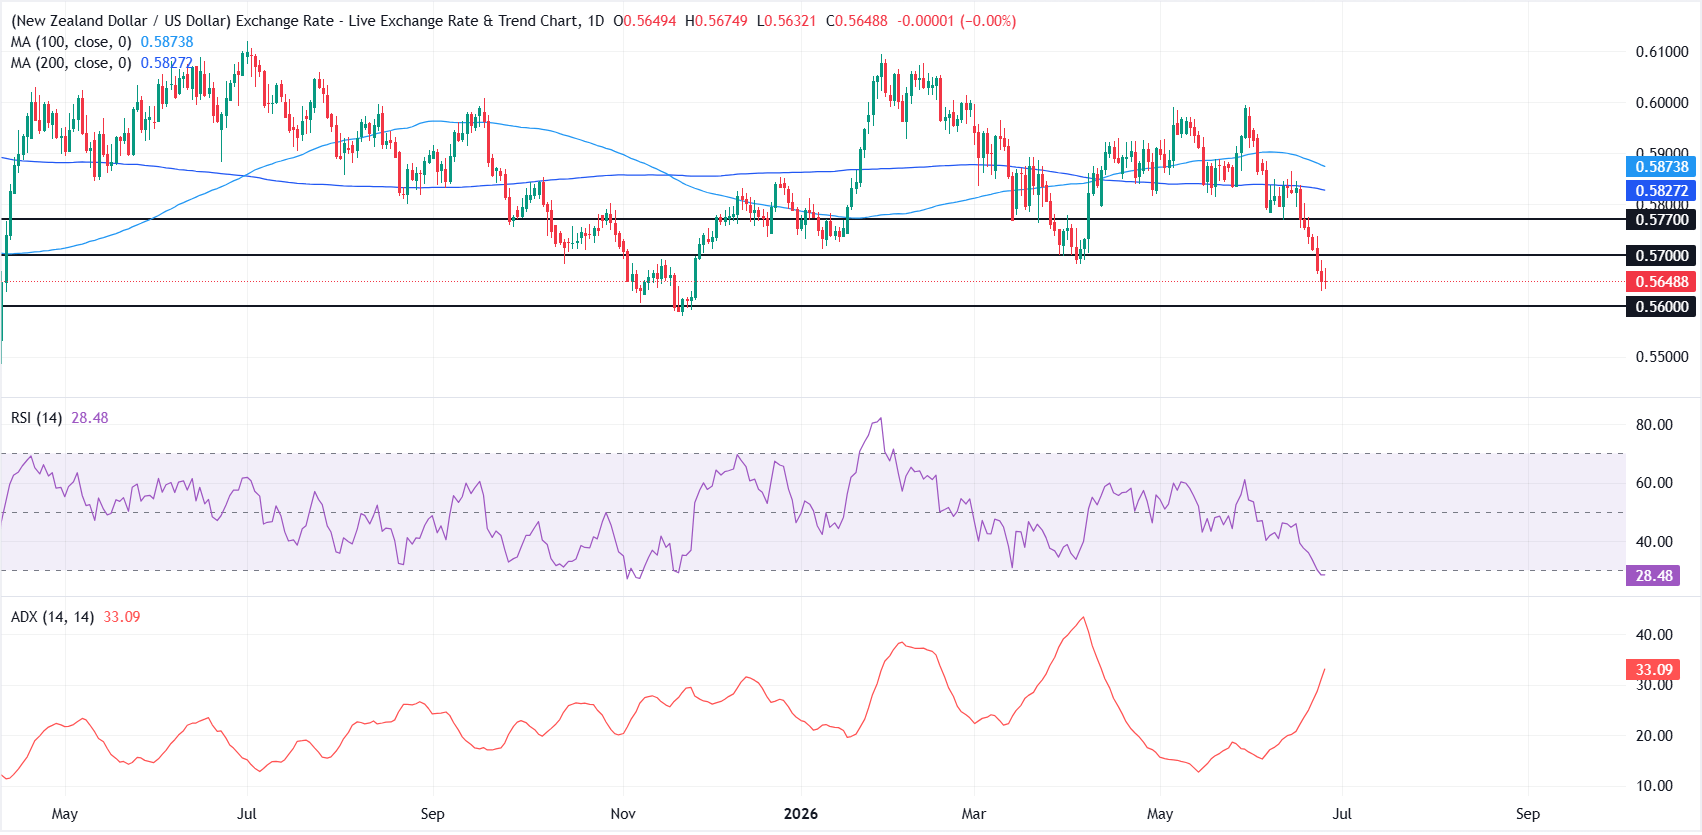
In the daily chart, NZD/USD maintains a bearish near-term bias as spot holds beneath the 200-day Simple Moving Average (SMA) at 0.5827 and the 100-day SMA at 0.5874.
The Relative Strength Index (RSI) is hovering around 29, signalling oversold conditions but only hints at the risk of a corrective bounce rather than a trend reversal. The rising Average Directional Index (ADX) above 30 suggests strengthening downside momentum.
On the topside, initial resistance emerges at 0.5700, followed by 0.5770, where a break would expose the cluster of medium-term moving averages, first at the 200-day SMA near 0.5827 and then the 100-day SMA at 0.5874.
On the downside, immediate support is located at the horizontal level of 0.5600. A sustained drop below this floor would open the way to fresh lows, while holding above it would be a minimum condition for any meaningful corrective recovery attempt.
(The technical analysis of this story was written with the help of an AI tool.)
Inflation FAQs
Inflation measures the rise in the price of a representative basket of goods and services. Headline inflation is usually expressed as a percentage change on a month-on-month (MoM) and year-on-year (YoY) basis. Core inflation excludes more volatile elements such as food and fuel which can fluctuate because of geopolitical and seasonal factors. Core inflation is the figure economists focus on and is the level targeted by central banks, which are mandated to keep inflation at a manageable level, usually around 2%.
The Consumer Price Index (CPI) measures the change in prices of a basket of goods and services over a period of time. It is usually expressed as a percentage change on a month-on-month (MoM) and year-on-year (YoY) basis. Core CPI is the figure targeted by central banks as it excludes volatile food and fuel inputs. When Core CPI rises above 2% it usually results in higher interest rates and vice versa when it falls below 2%. Since higher interest rates are positive for a currency, higher inflation usually results in a stronger currency. The opposite is true when inflation falls.
Although it may seem counter-intuitive, high inflation in a country pushes up the value of its currency and vice versa for lower inflation. This is because the central bank will normally raise interest rates to combat the higher inflation, which attract more global capital inflows from investors looking for a lucrative place to park their money.
Formerly, Gold was the asset investors turned to in times of high inflation because it preserved its value, and whilst investors will often still buy Gold for its safe-haven properties in times of extreme market turmoil, this is not the case most of the time. This is because when inflation is high, central banks will put up interest rates to combat it. Higher interest rates are negative for Gold because they increase the opportunity-cost of holding Gold vis-a-vis an interest-bearing asset or placing the money in a cash deposit account. On the flipside, lower inflation tends to be positive for Gold as it brings interest rates down, making the bright metal a more viable investment alternative.

超过一百万用户依赖 FXStreet 获取实时市场数据、图表工具、专家洞见和外汇新闻。其全面的经济日历和教育网络研讨会帮助交易者保持信息领先、做出审慎决策。FXStreet 拥有约 60 人的团队,分布在巴塞罗那总部及全球各地区。
阅读更多


