
NZD/USD Price Forecast: Slumps further below 200-day SMA, eyes on 0.57
作者 Christian Borjon Valencia
更新: 19 Jun 2026


热门文章

The New Zealand Dollar dives for the third consecutive day, down in the week by over 1.48%, after hitting two-month lows of 0.5722 against the Greenback. The NZD/USD trades at 0.5738, down 0.25% on the day.
- NZD/USD breaks 200-day SMA, confirming bearish technical shift lower.
- Three-day slide exposes January low and 0.5700 support zone.
- Reclaiming 0.5800 needed to challenge 200-day SMA resistance.
The New Zealand Dollar dives for the third consecutive day, down in the week by over 1.48%, after hitting two-month lows of 0.5722 against the Greenback. The NZD/USD trades at 0.5738, down 0.25% on the day.
NZD/USD Price Forecast: Technical outlook
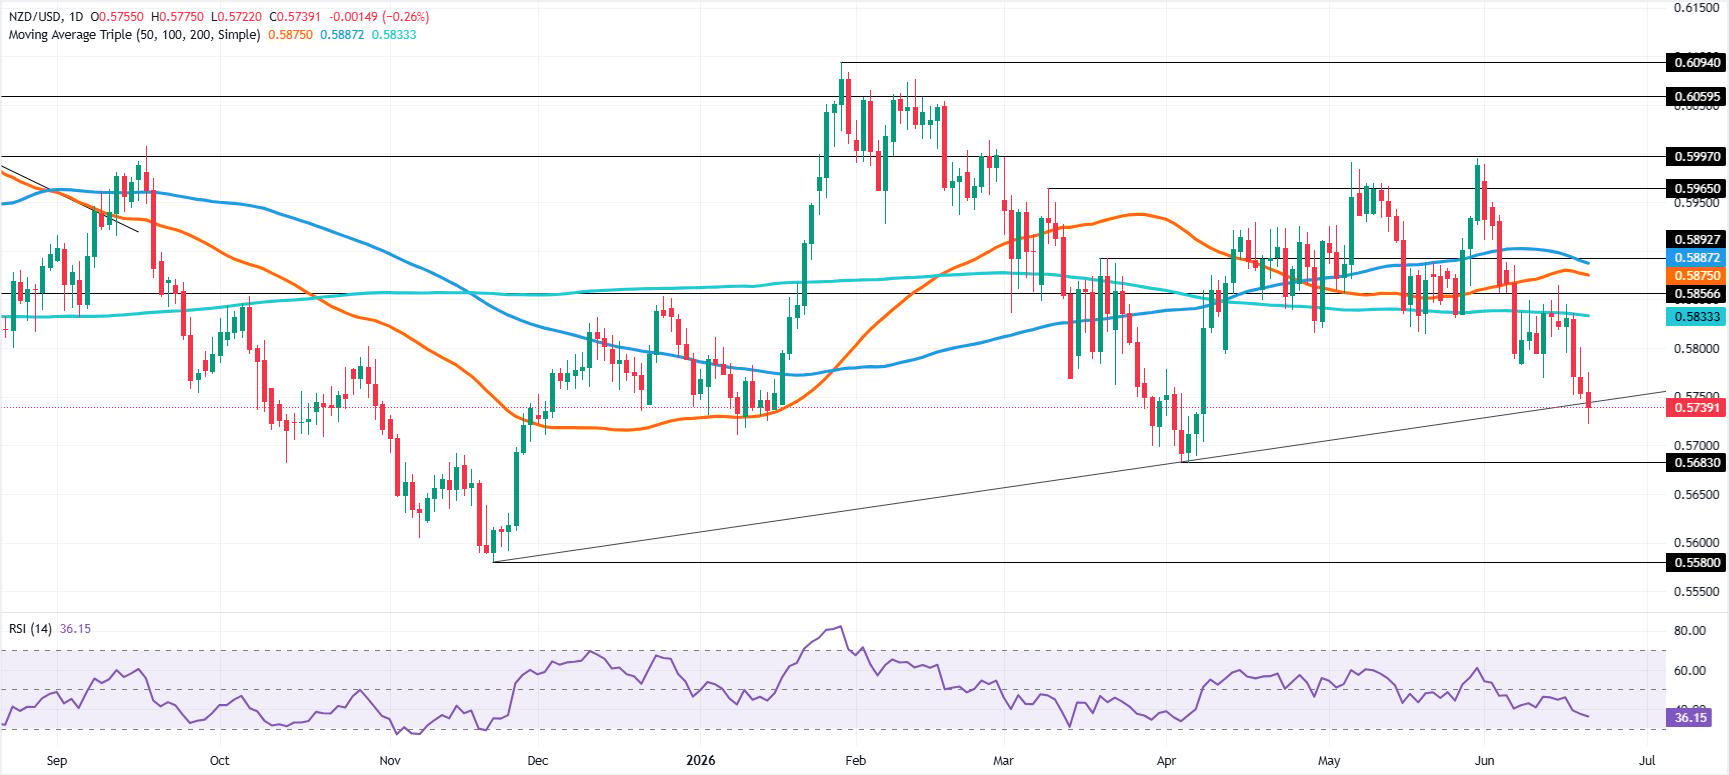
After the Reserve Bank of New Zealand's hawkish tilt, the NZD/USD rose from around 0.5800ish to near 0.6000 before recoiling beneath the 0.5750 figure. Broad US Dollar strength due to the US-Iran conflict, along with the pair diving below the 200-day Simple Moving Average (SMA) at 0.5833, a technical level that suggests an asset is bullish or bearish, depending on whether it's above or below.
Therefore, the NZD/USD path of least resistance is downwards. The next support is the January 9 low of 0.5711, ahead of 0.5700. On further weakness, the next area of interest would be the April 3 swing low of 0.5679, before testing the psychological 0.5650 mark.
For a bullish reversal, buyers must challenge the 0.5800 level to push NZD/USD towards the 200-day SMA. A breach of the latter will expose the 50-day SMA at 0.5875.
NZD/USD Price Chart – Daily
New Zealand Dollar Price This week
The table below shows the percentage change of New Zealand Dollar (NZD) against listed major currencies this week. New Zealand Dollar was the strongest against the Swiss Franc.
| USD | EUR | GBP | JPY | CAD | AUD | NZD | CHF | |
|---|---|---|---|---|---|---|---|---|
| USD | 0.90% | 1.32% | 0.73% | 1.29% | 0.47% | 1.55% | 1.35% | |
| EUR | -0.90% | 0.40% | -0.17% | 0.39% | -0.42% | 0.64% | 0.44% | |
| GBP | -1.32% | -0.40% | -0.73% | -0.01% | -0.82% | 0.27% | 0.05% | |
| JPY | -0.73% | 0.17% | 0.73% | 0.55% | -0.26% | 0.86% | 0.62% | |
| CAD | -1.29% | -0.39% | 0.00% | -0.55% | -0.85% | 0.30% | 0.07% | |
| AUD | -0.47% | 0.42% | 0.82% | 0.26% | 0.85% | 1.10% | 0.87% | |
| NZD | -1.55% | -0.64% | -0.27% | -0.86% | -0.30% | -1.10% | -0.19% | |
| CHF | -1.35% | -0.44% | -0.05% | -0.62% | -0.07% | -0.87% | 0.19% |
The heat map shows percentage changes of major currencies against each other. The base currency is picked from the left column, while the quote currency is picked from the top row. For example, if you pick the New Zealand Dollar from the left column and move along the horizontal line to the US Dollar, the percentage change displayed in the box will represent NZD (base)/USD (quote).

超过一百万用户依赖 FXStreet 获取实时市场数据、图表工具、专家洞见和外汇新闻。其全面的经济日历和教育网络研讨会帮助交易者保持信息领先、做出审慎决策。FXStreet 拥有约 60 人的团队,分布在巴塞罗那总部及全球各地区。
阅读更多


